


Abstract
Frailty, a condition involving increased risk of disability and mortality in older adults, has emerged as a reliable way to predict the effect of aging. Genomic instability may help to anticipate recognition of frail individuals and improving frailty outcomes. Our objective was to evaluate the potential of the micronucleus frequency, evaluated in lymphocytes and buccal cells, to anticipate frailty identification and improve diagnosis reliability. Our results, from a group of older adults over 65, showed that frail individuals had significantly higher frequencies of micronucleus in lymphocytes (19.16 ± 0.66 vs. 13.07 ± 0.78, p < .001) and of binucleated buccal cells (82.65 ± 3.42 vs. 37.16 ± 2.85, p < .001) and lower frequencies of pyknotic and condensed chromatin buccal cells, than nonfrail subjects. When cognitive status was considered, similar results were obtained. Moreover, the presence of frailty and cognitive impairment were independently related to increases in frequencies of lymphocyte micronucleus and binucleated buccal cells. Our results encourage the use of micronucleus frequency in lymphocytes as a complement to clinical parameters in frailty identification. However, these results have to be further evaluated in prefrail patients, to better understand the connection between genomic instability and frailty and to establish these parameters as actual biomarkers of frailty in clinical practice.
Frailty in older adults is an important geriatric syndrome that represents a risk factor for poor health outcomes for those over 65 years old. Nowadays, there are several definitions of frailty; however, Morley and colleagues (1), in the Frailty Consensus Conference of 2012, reached the following consensus definition for physical frailty: “frailty is a medical syndrome with multiple causes and contributors that is characterized by diminished strength, endurance, and reduced physiological function that increases an individual’s vulnerability for developing increased dependency and/or death.” Those authors also agreed that frailty is potentially preventable and can be reversible in its early stages. This idea is also supported by several recent studies (2,3).
Currently, several tools are employed to recognize frailty in older people. One of the most commonly used is the frailty phenotype criteria proposed by Fried and colleagues (4), which includes unintentional weight loss, exhaustion, low physical activity, slow walking time, and low grip strength. The major limitation of this assessment is the late identification of frailty, which is possible only after the onset of clinical manifestations. Therefore, to improve the clinical impact of frailty screening, it is necessary to develop new tools that allow a timely identification of those individuals more prone to develop this syndrome. The availability of these new tools would facilitate the implementation of personalized therapies and the improvement of health outcomes by means of prevention and intervention programs. Within this framework, cellular and molecular biomarkers have been proposed as a feasible end point to widen the definition of frailty (5) and to provide a more accurate identification of frail people in early and potentially reversible stages or prefrail status.
Along an individual’s lifetime, DNA is exposed to exogenous stressors and endogenous agents that can damage it. Some of the lesions induced, for example, mutations and chromosomal rearrangements, lead to a gradual destabilization of the genome integrity called genomic instability, which is one of the main hallmarks of the aging process (6). The involvement of genomic instability in different age-related phenotypes has been previously reported as a consequence of the loss of balance between DNA damage and the correct function of cellular DNA repair mechanisms (6,7). However, recent studies reviewed by Gorbunova and Seluanov (8) suggest the possibility that this imbalance can be the cause of the aging process and age-related phenotypes, rather than its consequence. These authors suggested that not only mutations accumulate with age but also the rate of mutation accumulation increases with age, which could be due to the DNA repair pathways becoming less efficient (7).
The evaluation of chromatin alterations could be important for a better understanding of mutations in age-related changes (8). The micronucleus (MN) test is one of the most commonly used methods for assessing chromosome damage. MN assay provides a reliable measure for both chromosome loss and chromosome breakage because MN is formed from chromosome fragments or whole chromosomes that lag behind during anaphase in cell division (9). MN frequency can be evaluated in different cells and surrogate tissues. For a number of reasons, including ease of sample collection and reproducibility, peripheral blood lymphocytes and exfoliated buccal cells are the most suitable, and consequently, the most frequently employed tissues for MN studies in human populations (10).
The cytokinesis-block MN (CBMN) cytome assay performed in peripheral lymphocytes is a comprehensive system for measuring DNA damage (11); it has been regularly applied in human biomonitoring of genotoxic exposures and is increasingly used in preventive medicine and nutrition (12–14). MN frequency is strongly associated with the aging process, and increases of this biomarker have been reported in several age-related diseases including cancer, diabetes, neurodegenerative diseases such as Alzheimer’s or Parkinson’s, and arthrosis (15,16).
The buccal MN cytome (BMNCyt) assay is an attractive candidate for the study of human populations due to its noninvasive nature. This technique, firstly proposed by Stich and Rosin in 1983 (17), has been employed in multiple studies as a sensitive biomarker of genetic damage and cell death caused by lifestyle-related factors such as alcohol and tobacco consumption, or nutritional deficiencies, and environmental exposures to pollutants, medical procedures, as well as inherited genetic defects in DNA repair (11,18). Together with MN formation, this assay allows as well to identify other abnormalities indicative of different kinds of cellular alterations. These abnormalities are shown as alterations in the nuclear morphology, such as binucleated cells, nuclear buds, pyknosis, karyorrhexis, abnormally condensed chromatin, and karyolysis (19).
The relationship between genome instability and frailty has not been established yet. It is not clear whether or in which way genome instability may influence the susceptibility to frailty, and even the few preliminary studies in this regard failed in finding any association (20). However, due to the well-founded belief that genome instability is involved in the frailty syndrome, given its strong association with aging and age-related diseases, further investigations should be carried out in this line. For this reason, the objective of the present study was to explore the possible relationship between genome instability and frailty status and to determine the suitability of MN assay as a potential biomarker to be employed for early identification of frailty. To this aim, MN frequency in both peripheral blood lymphocytes and exfoliated buccal cells, together with other cellular alterations in buccal mucosa, was evaluated in a population of Spanish older adults, classified as frail, prefrail, and nonfrail according to the Fried’s criteria (4). To provide a more comprehensive evaluation of clinical features associated with frailty, the possible association between nutritional status and cognitive impairment with the level of genomic instability was also evaluated.
Materials and Methods
Subjects and Sample Collection
A total of 257 volunteer donors (84 males and 173 females), aged 65 years or more (79.4 ± 8.8, range 65–102), were recruited from associations of retired older people and nursing homes located in Galicia (NW of Spain). A post hoc assessment of the statistical power of the study based on the MN frequency in lymphocytes, showed that—given the actual size of the three groups—the study had adequate statistical power (80%) to detect, with a type I error of 0.05, a minimum increase of 21.6% in frail versus nonfrail subjects and of 20.1% in prefrail versus nonfrail subjects (Post-hoc Power Calculator by www.ClinCalc.com). All donors, or their relatives in case of inability, signed an informed consent form and completed a questionnaire to collect demographic, lifestyle, and medical information. The study protocol followed the principles embodied in the Declaration of Helsinki and was approved by the University of A Coruña Ethics Committee (reference number CE 18/2014). Qualified staff with extensive experience in the gerontology field (i.e., psychologists, occupational therapists, nurses) was in charge of the clinical evaluation. To unify the criteria in completing the clinical evaluation, all staff members were equally trained prior to the start of the study. Participants were excluded if they were taking medications included in the Anatomical Therapeutic Chemical (ATC) category L (antineoplastic or immunomodulating agents) (21) or they had cancer or any chronic infection (e.g., HIV, HCV, HBV), or if they denied signing the informed consent.
Table 1 shows the general characteristics of the study population. Due to the small number of current smokers and ex-smokers (n = 5 and n = 48, respectively) a new category, “ever smokers,” was created combining both conditions. Similarly, a single category was considered including together malnourished individuals (n = 14) and individuals at risk of malnutrition (n = 80).
Description of the Study Population
| Total | Nonfrail | Prefrail | Frail | p Value | |
|---|---|---|---|---|---|
| Total n (%) | 257 (100) | 39 (15.4) | 131 (50.6) | 87 (34.0) | |
| Gender n (%) | |||||
| Males | 84 (32.7) | 26 (66.7) | 36 (27.5) | 22 (25.3) | <.001b |
| Females | 173 (67.3) | 13 (33.3) | 95 (72.5) | 65 (74.7) | |
| Age (years old)a | 79.4 ± 8.8 (65–102) | 73.3 ± 5.6 (65–85) | 77.1 ± 7.7 (65–100) | 85.6 ± 7.8 (65–102) | <.001c |
| 65–69 | 43 (16.8) | 12 (30.8) | 29 (22.1) | 2 (2.3) | <.001b |
| 70–74 | 41 (16.0) | 11 (28.2) | 26 (19.8) | 4 (4.7) | |
| 75–79 | 47 (18.4) | 10 (25.6) | 24 (18.3) | 13 (15.1) | |
| 80–84 | 46 (18.0) | 5 (12.8) | 27 (20.7) | 14 (16.3) | |
| ≥85 | 79 (30.9) | 1 (2.6) | 25 (19.1) | 53 (61.6) | |
| Smoking habits, n (%) | |||||
| Nonsmokers | 199 (79.0) | 22 (56.4) | 102 (78.5) | 75 (90.4) | <.001b |
| Ever smokers | 53 (21.0) | 17 (43.6) | 28 (21.5) | 8 (9.6) | |
| No. cigarettes/da | 18.4 ± 13.8 (2–60) | 16.1 ± 8.8 (3–40) | 15.7 ± 13.9 (2–60) | 31.4 ± 15.7 (20–60) | .020c |
| Years smokinga | 26.7 ± 16.6 (4–66) | 19.4 ± 9.1 (10–34) | 30.4 ± 18.7 (4–66) | 29.3 ± 18.2 (6–52) | .154c |
| BMI (kg/m2)a | 28.5 ± 5.6 (16.5–53.2) | 28.1 ± 3.2 (21.1–35.1) | 29.1 ± 5.0 (18.9–47.4) | 27.7 ± 7.0 (16.5–53.2) | .191c |
| Nutritional status, n (%) | |||||
| Normal nutrition status | 158 (62.7) | 35 (89.7) | 106 (80.9) | 17 (20.7) | <.001b |
| At risk or malnourished | 94 (36.3) | 4 (10.3) | 25 (19.1) | 65 (79.3) | |
| MNA-SF scorea | 11.8 ± 2.5 (4–14) | 13.3 ± 1.4 (8–14) | 12.8 ± 1.7 (4–14) | 9.7 ± 2.4 (4–14) | <.001c |
| Cognitive status, n (%) | |||||
| No cognitive impairment | 174 (69.6) | 39 (100) | 118 (90.1) | 17 (21.2) | <.001b |
| Cognitive impairment | 76 (30.4) | — | 13 (9.9) | 63 (78.8) | |
| Living conditions, n (%) | |||||
| Family home | 157 (61.1) | 39 (100) | 113 (86.3) | 5 (5.7) | <.001b |
| Family home + daycare center | 27 (10.5) | — | 4 (3.1) | 23 (26.4) | |
| Nursing home | 73 (28.4) | — | 14 (10.6) | 59 (67.9) | |
| Education years, n (%) | |||||
| ≤8 | 115 (45.3) | 19 (48.7) | 73 (55.7) | 23 (27.4) | <.001b |
| 9–17 | 96 (37.8) | 12 (30.8) | 32 (24.4) | 52 (61.9) | |
| >17 | 43 (16.9) | 8 (20.5) | 26 (19.9) | 9 (10.7) | |
Note: ANOVA = analysis of variance; BMI = body mass index. Boldfaced values mean statistical significance.
aMean ± SD (range). bChi-square test (two tails). cANOVA test (two tails).
Peripheral blood and buccal mucosa samples were collected by nurses and trained technicians. Whole blood was collected by venipuncture into Vacutainer tubes containing heparin as an anticoagulant for MN assay in peripheral blood lymphocytes. Exfoliated cells were obtained by gently swabbing oral mucosa on the inner side of both cheeks with a cytobrush and kept in a buffer solution (see below). Samples were transported to the laboratory immediately, where they were processed within 4 hours of collection. All samples were coded at the moment of collection and analyzed under blind conditions.
Frailty Criteria
All subjects included in the study were classified as frail (n = 87), prefrail (n = 131), or nonfrail (n = 39) according to the five Fried’s criteria (4). Individuals positive for three or more criteria were classified as frail; those positive for one or two criteria were classified as prefrail, meanwhile those with no positive items were classified as nonfrail.
Clinical Assessment
The nutritional status of the participants in the study was screened using the Spanish version (22) of the Mini-Nutritional Assessment-Short Form (MNA-SF) (23). The sum of the MNA-SF score distinguishes between elderly patients with (i) normal nutritional status (MNA-SF between 12 and 14 points); (ii) at risk of malnutrition (MNA-SF 8–11 points); and (iii) malnourished (MNA-SF 0–7 points).
The Spanish version (24) of the Mini-Mental State Examination (MMSE) scale (25) was employed to evaluate the global cognitive status. MMSE scores, ranging from 0 to 30, were adjusted for age and level of education, and participants were considered as cognitively impaired if they scored ≤24.
Lymphocyte Micronucleus Assay
The CBMN assay was performed following the protocol described by Fenech (11). MN automated scoring was performed using a Metafer4 System fluorescence, connected to an Axio Imager Z2 microscope (Carl Zeiss Microscopy GmbH, Jena, Germany), equipped with an Automated Slide Feeder x80, controlling the microscope components for automated focusing, light source adjustment (for bright field imaging), and fluorescence filter changes. A minimum of 2,000 binucleated (BN) cells per individual, 1,000 from each duplicate culture, were scored to determine the number of MN in lymphocytes (MN-L). After the automated scan, the image gallery was visually reviewed by an experienced scorer, following the criteria described by Fenech (11) for MN and BN cells, in order to reject unsuitable cells and to correct feature values if necessary.
Buccal Micronucleus Assay
The BMNCyt assay was performed as described by Thomas and colleagues (18). Slides were scored blindly by a single scorer in a Nikon E-800 fluorescence microscope with ethidium bromide filter. The scoring criteria for the distinct cell types and nuclear anomalies were based on those described by Tolbert and colleagues (26) and Thomas and colleagues (18). A minimum of 1,000 cells was scored to determine the frequency of each cell type in the sample, including basal and differentiated cells, binucleated cells (BN-B), condensed chromatin cells (Cond-chrom-B), karyorrhectic cells (Karyorrhectic-B), pyknotic cells (Pyknotic-B), and karyolytic cells (Karyolytic-B). A minimum of 2,000 differentiated cells was scored to analyze the number MN (MN-B) and the number of cells with nuclear buds (NBUD-B).
Statistical Analysis
Statistical analyses were carried out following the recommendations given by Thomas and colleagues (18) for the buccal MN cytome assay. The three groups of older adults (nonfrail, prefrail, and frail) were compared by sociodemographic factors (i.e., gender, age, living conditions, and years of education), lifestyle factors (i.e., smoking habit, alcohol consumption, and nutritional status), and clinical characteristics (i.e., body mass index [BMI] and cognitive status). The chi-square test was applied for categorical variables and the analysis of variance (ANOVA) for continuous variables.
The effect of frailty status on MN tests parameters was preliminarily tested through ANOVA with the Tukey’s post hoc test. Kolmogorov–Smirnov goodness-of-fit test was applied to assess normal distribution of the data; only MN-L followed a normal distribution. A log-transformation of the data was applied to BN-B, and a square root transformation was applied to Karyorrhectic-B, to achieve a better approximation to the normal distribution. No improvement was achieved with transformation in all other parameters, so the Kruskal–Wallis test with Bonferroni’s correction was applied for univariate statistics.
Best fitting multiple regression models were used to estimate the effect of frailty status, nutritional status, and cognitive status. All models included gender, age, BMI, and smoking habit (never/ever smokers). Poisson regression was carried out with NBUD-B, Cond-chrom-B, and Pyknotic-B, and negative binomial regression was fitted for MN-L, MN-B, BN-B, Karyorrhectic-B, and Karyolytic-B. Mean ratio (MR) was used as the point estimate of effect accompanied by its 95% confidence interval (95% CI). For those MN test parameters significantly influenced by frailty, cognitive status, and nutritional status new models were run including frailty and cognitive status or frailty and nutritional status mutually adjusted, and adjusting also by gender, age, BMI, and smoking habit.
Partial correlation coefficients adjusted by gender, age, BMI, and smoking were used to estimate associations between MN tests parameters. The threshold of significance was established at 0.05. The statistical software used for the analyses were the IBM SPSS software package V. 20 (SPSS, Inc) and the STATA/SE software package V. 12.0 (StataCorp LP).
Results
A total of 257 older adults (age range 65–102, including 31% aged 85 and over) were included in this study. After clinical classification based on Fried’s criteria, 39 subjects (15.4%) were classified as nonfrail, 131 (50.6%) as prefrail, and 87 (34.0%) as frail (Table 1). Sixty-eight per cent (n = 89) of prefrail subjects showed only one frailty criterion, while 32% (n = 42) showed two frailty criteria. The most commonly reported positive item (96%, n = 126) was muscle weakness (low grip strength). Smoking was more frequent in the nonfrail group. Although the number of cigarettes smoked per day was higher in the frail smokers, no significant difference in the duration of smoking was observed among the three groups. The proportion of individuals malnourished or at risk for this condition was much higher among the group of frail (79.2%), than in prefrail (19.1%) or nonfrail (10.3%) and, accordingly, the MNA-SF score was significantly lower in the frail group. The presence of cognitive impairment was observed in 9.9% of prefrail subjects and in the 78.8% of frail subjects. No case of cognitive impairment was reported in the nonfrail individuals. All nonfrail subjects and the large majority of prefrails lived at family home. Most frail subjects lived in nursing homes, although a quarter of them lived at family home but attending daycare centers. The duration of education was similar in the nonfrail and prefrail groups, whereas frail subjects presented a significantly lower number of years of education.
Table 2 shows the results of both MN assays in the nonfrail, prefrail, and frail groups. Buccal basal cells were not observed in any of the individuals analyzed, and all micronucleated buccal cells contained only one MN. Univariate analysis of data showed that the frequencies of MN-L and BN-B increased progressively with frailty status, showing significant differences when frail and nonfrail subjects are compared. On the contrary, decreases in the frail group were observed in the frequencies of Pyknotic-B, as compared with the other two groups, and Karyolytic-B, as compared to the group of nonfrail individuals. No differences were obtained for the frequencies of MN-B, NBUD-B, Cond-chrom-B, or Karyorrhectic-B.
Results of Micronuclei Evaluation in Lymphocytes and Buccal Cells in the Study Group, Classified According to Frailty Status (Univariate Analysis)
| Nonfrail | Prefrail | Frail | p Valuea | ||||
|---|---|---|---|---|---|---|---|
| n | Mean ± SE | n | Mean ± SE | n | Mean ± SE | ||
| ‰MN-L | 37 | 13.07 ± 0.78 | 122 | 14.87 ± 0.45 | 83 | 19.16 ± 0.66b,c | <.001 |
| ‰MN-B | 30 | 0.70 ± 0.36 | 102 | 0.46 ± 0.10 | 81 | 0.75 ± 0.17 | .582 |
| ‰NBUD-B | 30 | 0.10 ± 0.06 | 102 | 0.03 ± 0.02 | 81 | 0.02 ± 0.02 | .151 |
| ‰BN-B | 30 | 36.17 ± 2.85 | 102 | 43.13 ± 2.18 | 81 | 82.65 ± 3.42b,c | <.001 |
| ‰Cond-chrom-B | 30 | 0.53 ± 0.40 | 102 | 0.04 ± 0.02 | 81 | 0.02 ± 0.02 | .554 |
| ‰Karyorrhectic-B | 30 | 22.50 ± 3.12 | 102 | 18.96 ± 1.34 | 81 | 22.14 ± 2.06 | .537 |
| ‰Pyknotic-B | 30 | 0.57 ± 0.14 | 102 | 0.33 ± 0.07 | 81 | 0.11 ± 0.04b,c | .001 |
| ‰Karyolytic-B | 30 | 3.37 ± 0.90 | 102 | 2.21 ± 0.26 | 81 | 2.63 ± 0.65b | .018 |
Note: ANOVA = analysis of variance; MN-L = micronuclei in lymphocytes; MN-B = micronucleus in buccal cells; NBUD-B = nuclear buds in buccal cells; BN-B = binucleated buccal cells; Cond-chrom-B = buccal cells with condensed chromatin; Karyorrhectic-B = karyorrhectic buccal cells; Pyknotic-B = pyknotic buccal cells; Karyolytic-B = karyolitic buccal cells. Boldfaced values mean statistical significance.
aMultiple group comparison (ANOVA or Kruskal–Wallis test). bStatistically different from nonfrail. cStatistically different from prefrail (Tukey’s test or Bonferroni’s correction).
When correlations between MN-L and all parameters obtained in the BMNCyt assay were assessed, a significant association was only found for BN-B (r = .367, p < .001). In order to determine the single contribution of each frailty criterion to MN-L frequency, this parameter was compared in the groups of subjects negative and positive for each individual criterion (Figure 1). Highly significant increases in MN-L rate were observed in subjects positive for the criteria low physical activity, slow walking time and low grip strength when compared to those individuals negative for the corresponding criterion. No difference was observed in unintentional weight loss, and a borderline significant difference in exhaustion.
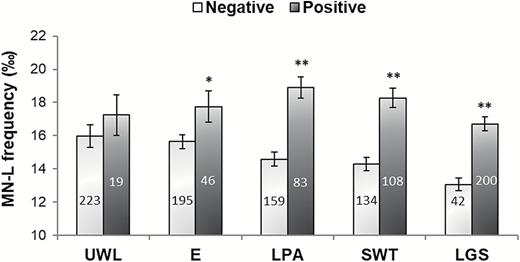
Micronuclei in lymphocytes (MN-L) frequency in the older adult population, according to each frailty criterion (4). The number of individuals included in each group is indicated inside each rod. *p < .05, **p < .001, significant difference with regard to negative (Student’s t test). Bars represent mean standard error. UWL = unintentional weight loss; E = exhaustion; LPA = low physical activity; SWT = slow walking time; LGS = low grip strength.
Results obtained in the multivariate statistical analyses, adjusting for gender, age, BMI, and smoking habit, confirmed previous univariate analysis results (Table 3), that is, frail individuals showed a 44% significant increase in the frequency of MN in lymphocytes, a significant doubling of binucleated buccal cells, and significant decreases in the frequencies of pyknotic buccal cells, and of condensed chromatin buccal cells. Only in this last outcome, prefrail subjects presented a significant result, whereas all the other parameters did not significantly differ from nonfrail subjects.
Effect of Frailty Status on MN Tests Parameters in Lymphocytes and Buccal Cells
| ‰MN-L | ‰MN-B | ‰NBUD-B | ‰BN-B | |||||
|---|---|---|---|---|---|---|---|---|
| Mean Ratio | 95% CI | Mean Ratio | 95% CI | Mean Ratio | 95% CI | Mean Ratio | 95% CI | |
| Frailty status | ||||||||
| Nonfrail | 1.00 | 1.00 | 1.00 | 1.00 | ||||
| Prefrail | 1.07 | (0.94–1.22) | 0.77 | (0.24–2.47) | 0.39 | (0.06–2.42) | 1.14 | (0.94–1.39) |
| Frail | 1.44** | (1.24–1.67) | 1.23 | (0.32–4.70) | 0.41 | (0.04–4.63) | 2.06** | (1.65–2.57) |
| ‰Cond-chrom-B | ‰Karyorrhectic-B | ‰Pyknotic-B | ‰Karyolytic-B | |||||
| Frailty status | ||||||||
| Nonfrail | 1.00 | 1.00 | 1.00 | 1.00 | ||||
| Prefrail | 0.15* | (0.04–0.50) | 0.84 | (0.60–1.16) | 0.72 | (0.37–1.41) | 0.68 | (0.35–1.35) |
| Frail | 0.13** | (0.02–0.84) | 1.02 | (0.70–1.49) | 0.29* | (0.10–0.81) | 0.85 | (0.39–1.86) |
Note: CI = confidence interval; BMI = body mass index; BN-B = binucleated buccal cells; Cond-chrom-B = buccal cells with condensed chromatin; Karyolytic-B = karyolitic buccal cells; Karyorrhectic-B = karyorrhectic buccal cells; MN-B = micronucleus in buccal cells; MN-L = micronuclei in lymphocytes; NBUD-B = nuclear buds in buccal cells; Pyknotic-B = pyknotic buccal cells. Models are adjusted by age, sex, BMI, and smoking habit. Boldfaced values mean statistical significance.
*p < .05; **p < .01.
A borderline significant influence of age on the study outcomes was found for the frequency of MN-L and Pyknotic-B (MR = 0.99, 95% CI = 0.99–1.00, p = .022 and MR = 0.96, 95% CI = 0.92–1.00, p = .029, respectively). Females presented significantly higher rates of MN-L than males (MR = 1.18, 95% CI = 1.09–1.29, p < .001), but significantly lower values of Cond-chrom-B (MR = 0.16, 95% CI = 0.05–0.55, p = .003). BMI influenced significantly and inversely the frequency of Karyolytic-B (MR = 0.96, 95% CI = 0.92–0.99, p = .014).
The possible influence of nutritional status and cognitive status on the various study parameters was assessed (Table 4). Individuals malnourished or at risk of malnutrition presented significantly higher values of MN-L and BN-B and significantly lower frequency of Pyknotic-B than individuals with normal nutrition. Equivalent results were observed for subjects with cognitive impairment, as compared to subjects with normal cognitive status.
Effect of Nutritional Status and Cognitive Status on MN Tests Parameters in Lymphocytes and Buccal Cells
| ‰MN-L | ‰MN-B | ‰NBUD-B | ‰BN-B | |||||
|---|---|---|---|---|---|---|---|---|
| Mean Ratio | 95% CI | Mean Ratio | 95% CI | Mean Ratio | 95% CI | Mean Ratio | 95% CI | |
| Nutritional status | ||||||||
| Normal nutrition | 1.00 | 1.00 | 1.00 | 1.00 | ||||
| At risk or malnourished | 1.23** | (1.12–1.35) | 1.38 | (0.55–3.46) | 0.73 | (0.11–4.74) | 1.50** | (1.29–1.75) |
| Cognitive status | ||||||||
| No cognitive impairment | 1.00 | 1.00 | 1.00 | 1.00 | ||||
| Cognitive impairment | 1.40** | (1.27–1.55) | 2.11 | (0.91–4.88) | 0.81 | (0.13–5.18) | 1.87** | (1.61–2.17) |
| ‰Cond-chrom-B | ‰Karyorrhectic-B | ‰Pyknotic-B | ‰Karyolytic-B | |||||
| Nutritional status | ||||||||
| Normal nutrition | 1.00 | 1.00 | 1.00 | 1.00 | ||||
| At risk or malnourished | 1.57 | (0.17–14.71) | 1.27 | (1.01–1.61) | 0.39* | (0.18–0.88) | 1.28 | (0.77–2.11) |
| Cognitive status | ||||||||
| No cognitive impairment | 1.00 | 1.00 | 1.00 | 1.00 | ||||
| Cognitive impairment | 0.35 | (0.07–1.72) | 1.08 | (0.84–1.38) | 0.28** | (0.11–0.73) | 1.15 | (0.68–1.94) |
Note: CI = confidence interval; BMI = body mass index; BN-B = binucleated buccal cells; Cond-chrom-B = buccal cells with condensed chromatin; MN-B = micronucleus in buccal cells; Karyolytic-B = karyolitic buccal cells; Karyorrhectic-B = karyorrhectic buccal cells; MN-L = micronuclei in lymphocytes; NBUD-B = nuclear buds in buccal cells; Pyknotic-B = pyknotic buccal cells. Models are adjusted by age, sex, BMI, and smoking habit. Boldfaced values mean statistical significance.
*p < .05; **p < .01.
When frailty status and cognitive status were mutually adjusted, the presence of frailty and cognitive impairment were independently related to an increase in the frequency of MN-L (MR = 1.22, 95% CI = 1.02–1.46, p < .05 for frailty and MR = 1.25, 95% CI = 1.10–1.43, p < .01 for cognitive impairment) and BN-B (MR = 1.59, 95% CI = 1.23–2.05, p < .001 for frailty and MR = 1.45, 95% CI = 1.21–1.75, p < .001 for cognitive impairment), both of them remaining significant. A decrease of Pyknotic-B frequency remained, not any longer significant (MR = 0.54, 95% CI = 0.13–2.31, p = .404 for frailty and MR = 0.38, 95% CI = 0.10–1.40, p = .146 for cognitive impairment). On the contrary, the inclusion of frailty in models fitting nutritional status reduced the strength of the association between this parameter and all end points of the cytome assay, which resulted not any longer significant.
Discussion
Frailty is a multidimensional geriatric syndrome characterized by increased vulnerability to stressors, resulting from a decline in reserve and function across multiple physiological systems. Hence, frailty is associated with an increased risk of adverse health outcomes including morbidity, disability, falls, hospitalization, institutionalization, and mortality (27). The association of genomic instability and the aging process has been widely described (7,8,28). Frailty is considered a consequence of the deregulation of several physiological systems (immune, endocrine, muscular) occurred during the aging process. For this reason, a direct association between frailty and genomic instability seems to be also plausible, and, accordingly, it has been previously assessed by evaluating different genomic biomarkers, including telomere length (29), DNA methylation (30), or DNA damage and repair impairment (31). Nevertheless, all these studies failed in finding a relationship between frailty and any of these genomic parameters.
Since MN frequency is a well-established biomarker of genomic instability, and in order to address its suitability as a potential biomarker of frailty, in the present study MN formation in peripheral blood lymphocytes and exfoliated buccal cells was determined in a population of elder individuals classified as nonfrail, prefrail, or frail, according to the five phenotypic criteria proposed by Fried and colleagues (4). Results obtained showed a significant progressive increase in the frequency of MN-L with frailty severity, whereas no difference among groups was found in the frequency of MN-B. Although similar results would be initially expected from both approaches, this discrepancy between results obtained from lymphocytes and buccal cells was previously reported (e.g., in subjects with Down’s syndrome regarding healthy controls (32) and in Alzheimer’s disease patients and controls (16)). As suggested by Ferreira and colleagues (32), this may be due to differences in metabolism and/or apoptosis levels between exfoliated buccal cells and lymphocytes. In addition, buccal epithelial cells are considered short-lived cells due to their continuous renewal; therefore, the presence of MN in buccal mucosa has been mainly linked to recent exposure to genotoxic agents more than to fixed genetic damage (33), a condition that would contribute to explain the differences found in our study between the two tissues.
As previously indicated, MN production was associated with aging and age-related diseases in both peripheral lymphocytes and buccal cells in a number of previous studies (10,15,28). Moreover, this biomarker has also been associated with features of the aging phenotype, including loss of function, mental retardation, disability, and death (34). However, to the best of our knowledge, this is the first study evaluating MN formation in buccal mucosa cells from frail older subjects and the second one in applying this approach to lymphocytes of older adults classified according to frailty status. Opposing to our results, this single previous study (35) failed in finding a relationship between frailty and MN-L frequency in an Italian elder population. However, in that work, no distinction was considered between prefrail and nonfrail groups, so they were analyzed together. This decision could have possibly masked the difference between frail subjects and nonfrail controls, due to the lower MN-L frequency in the prefrail group. Moreover, their sample population size was smaller (N = 180), and the regression models applied did not include BMI and smoking habit, which could have consistently contributed to explain the lack of association reported.
Although in our study, the significant increase in MN-L frequency regarding the nonfrail subjects was only found in the frail group, prefrail individuals also showed a slight increase in this parameter, supporting a possible linear association between genomic instability and frailty.
Another original result from this study refers to the different contributions of the five different frailty criteria (4) to the increase of the MN-L (Figure 1); low physical activity, slow walking time, and low grip strength contribute the most, whereas unintentional weight loss does not contribute at all. The lack of contribution of this last criterion was in some way unexpected, especially considering the observed effect of nutritional status on the final results (Table 4) and the previous studies linking diet deficiencies and chromosomal damage (36). However, it must be taken into account that unintentional weight loss in elderly, or aging-related sarcopenia, has multifactorial causes including disuse, changing endocrine function, chronic diseases, and so on, being nutritional deficiencies just one of them (37).
Although less employed than the CBMN test, the BMNCyt assay in exfoliated cells is a useful and minimally invasive method for monitoring genetic damage in humans. It has been previously employed as a tool to evaluate age-associated genomic instability both in healthy individuals (25) and Down’s syndrome individuals, who experience premature aging (28,32). In these cases, a positive association between MN production and aging was found. Besides, an increase in MN-B frequency was previously reported in several age-related diseases such as diabetes (38), cancer (39), or rheumatoid arthritis (40).
Tissue regenerative capacity depends on the number and division rate of the proliferating cells, along with genomic stability and propensity to cell death. This process is basic for healthy aging. Buccal mucosa offers the possibility to study the regenerative capacity of the epithelial tissue, in an easily accessible and noninvasive sampling procedure (18). Thus, together with MN evaluation, BMNCyt assay allows studying several endpoints for other nuclear abnormalities that occur during the normal cell division. These abnormalities have been previously employed as a biomarker of DNA damage (NBUD-B), defects in cytokinesis (BN-B) and proliferative potential (basal cell frequency), and/or cell death (Cond-chrom-B, Karyorrhectic-B, Pyknotic-B, and Karyolytic-B) (19).
Even though the rate of BN-B decreased significantly with age, it was found significantly higher in the frail group and showed a progressive increase with frailty severity. Thus, these results indicate alterations in the cytokinesis process, which could lead to alterations in cell proliferation, in frail subjects. Besides, decreases were obtained in buccal cell death parameters (Pyknotic-B, Karyolytic-B, and Cond-chrom-B, the two former significant) in the frail group with regard to the other two. Since significant increases in apoptosis indicative parameters (Cond-chrom-B, Karyorrhectic-B) were previously observed in healthy older subjects (aged 65–70) as compared with younger individuals (aged 18–25) (41), our results may reflect important changes in the profile of the buccal mucosa related to frailty and not associated with age.
The proportion of basal cells and cells undergoing cell death in buccal mucosa is an indication of the regenerative capacity of this tissue (18). In our study, no basal cells were found in the scored samples, possibly due to the subjects’ advanced age and the expected wear of their mucous tissue. Besides, the rates of cells undergoing cell death (Cond-chrom-B, Pyknotic-B, and Karyolytic-B) resulted significantly decreased in frail and prefrail groups, suggesting a minor regenerative capacity of the buccal mucosa in these individuals.
Together with data on frailty, the possible influence of the nutritional status and the cognitive impairment of the study subjects on the obtained results were analyzed. Malnourishment is a common status in the elderly adults. In our study population, 14.6% frail individuals were malnourished, whereas 79.2% frail and 19.1% prefrail individuals were at risk of being malnourished. When the influence of nutritional status on MN tests parameters was assessed, higher levels of MN-L and BN-B and lower levels of Pyknotic-B were observed in individuals malnourished or at risk of malnutrition regarding those with normal nutrition. These results coincide with those for frailty status, which is not unexpected because it has been previously described that those individuals with an impaired nutritional status are more likely to be frail (42). Furthermore, the frailty criterion unintentional weight loss is related to nutritional status, indeed “involuntary weight loss during the last three months” is one of the items included in the MNA-SF questionnaire.
Micronutrient status plays an important role in the protection against genome damage by providing co-factors required for an efficient DNA repair, detoxification, or maintenance of genome methylation (43). Consequently, and in agreement with our results, vitamin and mineral deficiencies in diet could be associated with increased genomic damage and cancer risk (44). In this regard, Fenech and colleagues (45) also reported an increase in MN-L frequency in older men (aged 50–70) with nonoptimal values of serum folate and homocysteine regarding subjects with higher levels of these micronutrients. A complete review on the effects of dietary intervention on MN levels concluded that micronutrient supplementation (e.g., with vitamins, antioxidants, wine) could lead to a significant reduction of MN frequency, in both peripheral lymphocytes and buccal mucosa cells, in supplemented subjects (43). This observation, together with the influence of nutritional status found in the present study, would support the idea that MN-L frequency associated with frailty or prefrailty status could be reduced, at least in part, with a proper diet intervention in the elderly adults.
A similar relationship was found when the influence of cognitive status was assessed. In particular, increases in MN-L and BN-B cells and a decrease in Pyknotic-B were observed in subjects with cognitive impairment. Supporting this last result, decreases in the buccal cell death parameters (Karyorrhectic-B, Cond-chrom-B) were previously observed in Alzheimer’s patients with regard to healthy controls (41). However, since the significant effect on MN-L and BN-B cells remained when both statuses were mutually adjusted, it seems that cognitive status has a strong influence on the obtained results. Accordingly, a relationship between frailty status and cognitive impairment has been previously described (46), as well as the association between MN frequency, as a biomarker of genomic instability, and cognitive impairment (41). This demonstrated association between both statuses, frailty and cognitive, strongly complicates the distinction between genomic or cellular alterations related to frailty condition and those due to cognitive impairment. The Fried’s criteria, frequently used in clinical settings and employed in the present study to identify frail people, do not consider cognitive features of the individuals, and consequently, the initial distinction between subjects with differential cognitive status cannot be conducted. However, more and more authors are increasingly claiming for differentiating physical frailty from cognitive frailty (47). Our results would support the need for this distinction in order to enhance reliability when testing the suitability of a potential biomarker for frailty identification.
Conclusions
Different studies support the reversibility of frailty status or its improvement by changes in diet, physical exercise, and medications (2,3). Identifying frail people as early as possible seems, therefore, crucial for geriatricians and health care professionals because it would allow to implement interdisciplinary and personalized cares and to improve outcomes by means of prevention and intervention programs. All this would lead to decrease the need for admission to nursing homes and hospitals, lowering the risk of dependence and death, and eventually improve the welfare and personal satisfaction, reducing the health, social, and economic costs associated with frailty.
The use of biomarkers could result highly helpful in identifying frailty of prefrailty status. Given its sensitivity, specificity, objectivity, and predictive capacity, several authors have pointed out that cellular and molecular biomarkers may potentially be used for frailty identification (20). However, to date, no specific biological marker has been identified as a definitive marker for frailty.
In order to deeply investigate this, the potential use of MN frequency, as an indicator of genomic instability, for frailty identification has been addressed in the present study. According to our findings, MN frequency evaluated in lymphocytes (as a marker of fixed or accumulated genetic damage), but not in buccal cells (reflection of recent damage) could be considered as a biomarker of frailty. Thus, these results demonstrate for the first time a direct relationship between frailty in older adults and genome instability. Even though this association resulted statistically significant only in the frail group, also individuals with a prefrail status showed an increase in the MN-L frequency, supporting this relationship and opening the door to further investigations in this line. Moreover, associations between frailty and cell death parameters were obtained from the BMNCyt assay, which supports the use of this minimally invasive method as a complement in frailty identification, at least in its advanced state, where these differences resulted statistically significant.
In summary, our results support the use of MN frequency evaluated in lymphocytes for frailty identification. However, because this association was significant only when the frailty is phenotypically more evident and not in a prefrail status, which would be desirable from a clinical point of view, additional research is necessary to fully understand the connection between genomic instability and frailty syndrome in the elderly adults. Besides, given the influence of the individual cognitive impairment on the MN-L results, it is also necessary to determine the weight of cognitive impairment in this association prior to establishing this parameter as an actual biomarker of frailty in clinical practice.
Funding
This work was supported by Xunta de Galicia (ED431B 2016/013, ED431C 2017/49, FrailNet network IN607C 2016/08, and ED481B 2016/190-0 to V.V.), INDITEX-UDC (to M.S.-F. and D. M.-P.), Deputación Provincial de A Coruña (to M.S.-F.), and Associazione Italiana per la Ricerca sul Cancro (IG17564 to S.B.).
Conflict of Interest
None reported.

