


Abstract
Experiences of nature provide many mental-health benefits, particularly for people living in urban areas. The natural characteristics of city residents’ neighborhoods are likely to be crucial determinants of the daily nature dose that they receive; however, which characteristics are important remains unclear. One possibility is that the greatest benefits are provided by characteristics that are most visible during the day and so most likely to be experienced by people. We demonstrate that of five neighborhood nature characteristics tested, vegetation cover and afternoon bird abundances were positively associated with a lower prevalence of depression, anxiety, and stress. Furthermore, dose–response modeling shows a threshold response at which the population prevalence of mental-health issues is significantly lower beyond minimum limits of neighborhood vegetation cover (depression more than 20% cover, anxiety more than 30% cover, stress more than 20% cover). Our findings demonstrate quantifiable associations of mental health with the characteristics of nearby nature that people actually experience.
The economic costs of anxiety and mood disorders, such as depression, have been estimated at €187.4 billion per year for Europe alone (Gustavsson et al. 2012, Olesen et al. 2012). Alongside stress, they are some of the most prevalent work-related health issues (13.7% of all reported work-related cases; Eurostat 2012). This growing problem has, at least in part, been attributed to the increasing disconnect between people and the natural world that is resulting from more urbanized, sedentary lifestyles (the “extinction of experience”; Miller 2005, Soga and Gaston 2015). This is supported by research that shows interactions with nature promote psychological restoration (Kaplan 1995), improved mood (Hartig et al. 2003, Barton and Pretty 2010, Roe and Aspinall 2011), improved attention (Hartig et al. 2003, Ottosson and Grahn 2005) and reduced stress and anxiety (Ulrich et al. 1991, Grahn and Stigsdotter 2003, Hartig et al. 2003, Maas et al. 2009).
The causal factors behind poor mental health are complex and diverse (Kinderman et al. 2015), and cultural and socioeconomic differences between regions may influence responses to interactions with nature (reviewed by Keniger et al. 2013). Understanding and capitalizing on the mechanisms by which natural environments provide psychological benefits nonetheless have the potential to be a novel and cost-effective approach to reducing the prevalence of some forms of mental ill health (Hartig et al. 2014, Shanahan et al. 2015b). Indeed, nature is likely to influence mental health through a range of mechanistic pathways (Shanahan et al. 2015b). Attention-restoration theory proposes that the natural world promotes recovery from mental fatigue that occurs during the performance of cognitive tasks that require the prolonged maintenance of directed attention (Kaplan 1995), whereas stress-reduction theory argues that natural environments facilitate reductions in physiological arousal following stress (Ulrich et al. 1991). Both of these complementary theoretical frameworks lead to improved mental health from experiencing nature through decreased rumination, increased cognition, and reduced stress (Berman et al. 2012, Jiang et al. 2014, Tyrväinen et al. 2014, Bratman et al. 2015).
Increasingly, evidence suggests that the availability and quality of neighborhood green spaces are associated with greater well-being (White et al. 2013) and lower levels of depression, anxiety, and stress (Beyer et al. 2014). These benefits may be gained from intentionally interacting with nature (e.g., through visiting neighborhood green spaces or spending time in a garden), from incidental interactions whereby people are exposed to nature as they engage in other activities (e.g., walking to the shops), or indirectly while not actually being present in nature (e.g., viewing it through a window; Keniger et al. 2013). The natural environment around the home is the nature that most people will experience every day and therefore, through all three kinds of nature interactions, will significantly contribute toward people's daily nature experience.
To date, most research into the health benefits of nature has considered the role of green spaces per se. The role of specific biological components of those spaces remains unclear, although these need to be identified effectively to guide planning to operationalize the use of nature as a health-promoting tool. In urban areas, two of the most visible elements of nature are vegetation cover and bird communities. The presence of vegetation has been found to have positive mental-health benefits, including but not limited to helping to reduce stress and promoting restoration from mental fatigue (e.g., Fuller et al. 2007, Alvarsson et al. 2010, Dallimer et al. 2012). Having more bird species in the environment and watching birds have been shown to be good for people's psychological well-being (Fuller et al. 2007, Curtin 2009, Brock et al. 2015, Cox and Gaston 2016), whereas listening to bird song has been shown to contribute toward perceived attention restoration and stress recovery (Ratcliffe et al. 2013).
Previous studies investigating the relationship between components of biodiversity and psychological well-being have focused on measuring absolute diversity (how much diversity is estimated actually to be present; Fuller et al. 2007, Luck et al. 2011) and/or the diversity that people perceive to be present (Dallimer et al. 2012, Shwartz et al. 2014, Belaire et al. 2015). However, these may not reflect the biodiversity that people actually experience. In particular, daily activity levels of people and other organisms often differ, so understanding the well-being effects of the diversity that people actually experience requires consideration of lower than actual values.
Here, we address two key questions. First, what components of nature are linked to positive mental-health outcomes? To answer this, we explore the relationships between three established self-reported measures of mental health for depression, anxiety, and stress and five metrics of neighborhood nature (vegetation cover, estimated actual abundance and richness of birds, and the abundance and richness of birds that people are likely to experience). Our second question is whether there is a threshold in the mental-health response. To answer this, we use dose–response modeling to estimate the point at which neighborhood vegetation cover (a tangible component of nature that relevant stakeholders can manage) influences the prevalence of depression, anxiety, and stress and the reduction in prevalence that could be achieved through enhanced exposure across the urban population.
Assessment of mental health and the participants
We delivered an urban lifestyle questionnaire online (see Shanahan et al. 2016 for details) through a market research company (Shape the Future Ltd) to 1023 adults enrolled in their survey database. All the participants lived within the urban limits of the “Cranfield triangle,” a region in southern England, United Kingdom, comprising the three adjacent towns of Milton Keynes, Luton, and Bedford. Together, they constitute an urbanized area of approximately 157 square kilometers and an urban population of approximately 524,000 (according to the 2011 UK census). The triangle represents great variation in human population density (including examples of low- and high-density living), urban history, and urban form. The survey was delivered in May 2014, a period of reasonably mild weather when the respondents were most likely to engage with nature around their home, so the benefits of nature may be more pronounced. The participants were self-selecting and were compensated with either a nominal fee or a prize draw entry (see supplemental appendix S1 for ethical clearance). A subset of 263 respondents for whom there was both vegetation and bird survey data was then used in the analysis (see the metrics of neighborhood nature section below).
The survey respondents were asked to complete the short version of the Depression, Anxiety, and Stress Scale (DASS 21; Lovibond and Lovibond 1995). On a four-point scale, the respondents rated the extent to which each of 21 statements applied to them over the previous week (seven statements each for depression, anxiety, and stress; supplemental table S2a). To characterize the degree of severity for each mental disorder relative to the wider population, these scores were summed for each disorder before banding as normal, mild, moderate, severe, or extremely severe (table S2b; Lovibond and Lovibond 1995). If a respondent did not score a statement, then the relevant disorder for that respondent was discarded from the analysis (remaining respondents; depression = 248, anxiety = 259, stress = 240).
The survey collected sociodemographic and personal circumstance data that could potentially influence mental health, including age, gender, the primary language spoken at home, personal annual income, the number of days exercised for 30 minutes or more during the survey week (an an indicator of physical activity), self-assessment of health, and highest formal qualification. As a potential confound of recent nature exposure, we asked the respondents relatively how much time they spent out of doors in the previous week (supplemental table S1 shows how these variables were used for analysis). The respondents were requested to provide a full UK postcode so that their neighborhood could be characterized (one UK postcode covers approximately 20 households). On the basis of the postcode, the English Index of Multiple Deprivation (IMD) was used to assess the level of socioeconomic disadvantage (sharegeo.ac.uk; data sourced from data.gov.uk). Finally, using the UK Gridded Population Based on the Census 2011 and Land Cover Map 2007 (Reis et al. 2016), we calculated neighborhood population density (see supplemental appendix S2 for full description of these two variables).
Metrics of neighborhood nature
We measured five key components of nature that people were exposed to around the home. We first measured neighborhood vegetation cover as vegetation 0.7 meters (m) or more in height, within a 250 m buffer around the centroid of each respondent's postcode, approximately reflecting the viewscape from and the area immediately adjacent to people's homes. Vegetation cover maps were derived from airborne hyperspectral and light detection and ranging (LiDAR) data; full details of the spatial product development are provided in the supplemental appendix S3.
We conducted extensive bird surveys within the towns to generate a further four metrics of neighborhood nature. We estimated actual bird abundance and species richness as that recorded during early-morning surveys, when birds are most active and so most likely to be recorded (supplemental appendix S4). We also estimated the bird abundance and species richness that people were likely to experience as those birds that were recorded during afternoon surveys when most people are also active (appendix S4). These were derived from point count surveys, using distance sampling, at up to four locations within 116 tiles, each of 500 m × 500 m squares that were selected randomly across the three towns (full details are provided in appendix S4). We estimated neighborhood bird abundances and richness for those respondents whose 250-m neighborhood buffer overlapped with at least one bird survey location within a survey tile (respondents = 263; tiles = 84; see supplemental table S3 for sociodemographics of subset; supplemental figure S1 illustrates an example of overlap). This subset of respondents was used in subsequent analyses.
The neighborhood vegetation cover varied ninefold across the 263 respondents (supplemental table S4). Pearson's rank sum tests of the five metrics of neighborhood nature showed that actual and afternoon species richness were highly correlated (Pearson's r = 0.72, p < .0001), whereas the remaining nature variables were either weakly or not correlated (r < 0.28; see supplemental table S5 for correlation matrix between nature variables).
Relationships between mental health and neighborhood nature
We used ordinal regression to explore relationships between the five metrics of neighborhood nature and each mental-health disorder in turn. We incorporated age, gender, language, income, physical activity, self-assessment of health, level of education, relative time out of doors in the previous week, neighborhood population density and the IMD as covariates. We standardized the five nature metrics and neighborhood population density such that each had mean zero and standard deviation one. Because multicollinearity of more than 0.7 can severely distort model estimation (e.g., Dormann et al. 2013, Cade 2015), we built two models for each mental state, including either actual or afternoon species richness in each along with the other three nature metrics and covariates. We used the Multi-Model Inference (MuMIn) package (Bartoń 2015) to produce all subsets of models on the basis of the global model and to rank them on the basis of the Akaike Information Criterion (AICc). Overdispersion in models is problematic in AICc analysis and may be due to not accounting for important covariates or multicollinearity, which can result in the selection of overly complex models that can lead to poor inference. Following Burnham and Anderson (2002, p. 131) and Richards (2008), we reduced the retention of overly complex models by excluding from the set of candidate models all models that are more complicated versions of any model with a lower AICc value (i.e., nesting of models). To be 95% sure that the most parsimonious models were maintained within the best-supported model set, we then retained all models in which ΔAICc < 6 (Richards 2005, 2008). We then calculated averaged parameter estimates and standard errors using model averaging among the retained models (Burnham and Anderson 2002).
People living in neighborhoods with higher levels of vegetation cover and afternoon bird abundances had reduced severity of depression, anxiety, and stress (table 1; figure 1). In contrast, there was no relationship with the estimated actual neighborhood bird abundance and species richness or afternoon species richness (table 1). The respondents who spent less time outdoors than usual in the last week had worse depression and anxiety (table 1). The respondents over the age of 45 years were less likely to suffer from depression than the younger respondents, whereas those between 46 and 60 years were less likely to suffer from anxiety (table 1). Mental health was positively correlated with self-reported physical health (table 1; inherent bias within self-reported surveys is here, at least in part, mitigated through large sample sizes and a robust ordinal regression analytical approach).
Nested model averaging of ordinal regression showing negative relationships between two visible components of nature around the home and three mental-health disorders while adjusting for sociodemographic factors.
| Variables | Depression | Anxiety | Stress | |||
|---|---|---|---|---|---|---|
| M | Standard error (SE) | M | SE | M | SE | |
| Vegetation cover | –0.41 (0.15)** | –0.34* | 0.16 | –0.30* | 0.15 | |
| Actual abundance | – | 0.26 | 0.16 | 0.25 | 0.16 | |
| Actual richness+ | – | – | – | |||
| Afternoon abundance | –0.43 (0.15)** | –0.54** | 0.18 | –0.35* | 0.18 | |
| Afternoon richness+ | – | – | – | |||
| Gender (male) | – | 0.49 | 0.32 | – | ||
| Language | 0.57 | 0.36 | – | – | ||
| Income | 0.13 | 0.08 | – | – | ||
| Physical activity | – | – | – | |||
| IMD | – | – | – | |||
| Population density | – | – | – | |||
| Relative time outdoors | ||||||
| About the same | –0.74 (0.33)* | –0.95* | 0.36 | 0.55 | 0.36 | |
| More time | –0.84 (0.38)* | –1.29** | 0.42 | –0.88 | 0.48 | |
| Age | ||||||
| Age (31–45 yrs) | –0.11 (0.33) | –0.02 | 0.35 | 0.59 | 0.35 | |
| Age (46–60 years) | –1.13 (0.39)** | –1.23** | 0.44 | –0.78 | 0.46 | |
| Age (>60 years) | –1.90 (0.82)* | –0.93 | 0.65 | –1.70 | 1.07 | |
| Self–assessment of Health | ||||||
| Poor | –1.81 | 1.02 | –3.75** | 1.39 | – | |
| Average | –2.28 (0.94)** | –3.92*** | 1.32 | – | ||
| Good | –3.49 (0.95)*** | –4.57*** | 1.32 | – | ||
| Very good | –3.30 (0.96)*** | –4.73*** | 1.35 | – | ||
| Level of education | ||||||
| Education (18+) | – | – | – | |||
| – | ||||||
| Education (Undergraduate) | – | – | – | |||
| Education (Postgraduate) | – | – | – | |||
Note: For the categorical variables (listed in italics), we show the model-averaged coefficients of variables relative to a comparative base factor level (e.g., age less than 30 years, so a positive coefficient suggests that those more than 30 years old have worse mental health. The other base factors are the following: gender, female; language, English is the primary language spoken at home; relative time outdoors, less time; self-assessment of health, very poor; education, 16+ years. The significant variables and factor levels relative to base level are shown as *p < .05; **p < .01; ***p < .001.
For each mental-health disorder, we built two identical models, testing each measure of richness separately (see methods); the variable was not retained in the top nested models in which delta < 6.
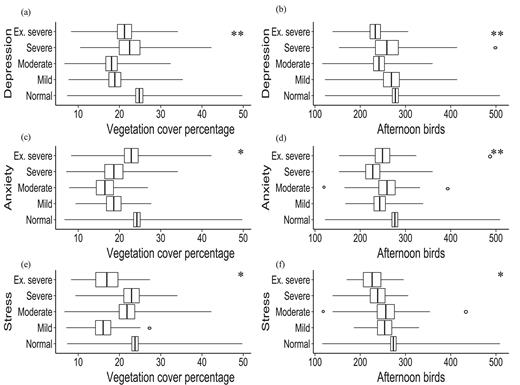
The relationships between depression (a,b), anxiety (c,d), and stress (e,f), with 1) neighborhood vegetation cover (a,c,e) and 2) afternoon bird abundances (b,d,f). Error bars are standard errors and significant results are shown as: *P < 0.05; **P < 0.01.
Here, we have shown that metrics of nature that were most visible during the day and so most likely to be experienced by people, namely vegetation cover and afternoon bird abundances, were positively associated with a lower population prevalence of depression, anxiety, and stress. This may have arisen for a range of nonmutually exclusive reasons. First, experiences of visible nature may act to improve people's mental health, as was predicted from previous empirical studies of interactions between nature and well-being (see our introduction for references). Second, people with no or low mental-health disorders may be self-selected by electing to move into neighborhoods that are greener. Third, they may provide resources for birds, thereby increasing opportunities for closer interactions throughout the day. Therefore, it is unclear whether a lower population prevalence of poor mental health is shaped by the natural environment people live in or whether people move to a neighborhood that reflects that trait, or whether it is some combination of these factors. However, we found no relationship with the metrics estimating actual bird community composition or actual or afternoon species richness, nor were there relationships between mental health and covariates such as the IMD, education, or population density, although this is not entirely unsurprising given the complex nature of mental-health disorders and that previous studies have recorded wide variation in these relationships across different human populations (e.g., Das et al. 2007). The difference in the associations of actual and visable bird abundance with mental health is indicative of an effect of visible nature on mental health. Notwithstanding, future research needs to focus on further unpicking causal pathways, such as through studies of brain activity and function during exposure to nature (e.g., Bratman et al. 2012, 2015).
The shape of the relationships between vegetation cover and the increasing severity of each mental-health disorder suggests that the greatest benefits were gained by those respondents with mild or moderate mental-health disorders (figure 1). This may be because the severity of depression often determines behaviors and therefore the degree to which people engage with nature. So people suffering from severe mental-health disorders may be less likely to venture outdoors, and the mechanisms behind their disorders may be different, thereby reducing the positive influence of nature. The respondents who spent relatively less time out doors in the survey week were more likely to report worse depression and anxiety. Intriguingly, this suggests that the relative nature experienced is a significant contribuing factor.
We found no relationship between mental health and either measure of bird richness or that of actual abundance. Given that most people cannot distinguish between species (Dallimer et al. 2012, Shwartz et al. 2014) benefits may be provided through directly experiencing abundance, with richness contributing when people can see multiple species within a relatively small timeframe, such as around a feeder (Cox and Gaston 2015). Although the positive benefits for mental health of interacting with birds is compelling, in this study, it was not possible to determine the actual abundances of birds that the respondents interacted with; therefore, there may be more than one explanation for the positive associations between afternoon bird abundances and improved mental health. First, as seems likely, the abundances recorded by ecologists in the afternoon may be a good representation of the birds that most people experience and gain benefits from. Second, these abundances may be a proxy for another biological component.
Dose–response relationships between neighborhood vegetation cover and mental health
We next calculated the dose–response of each mental-health disorder within the survey population that could be attributed to levels of neighborhood vegetation cover. We created a further three binary response variables: those with normal mental health for each of depression, anxiety, and stress and those suffering with mild or worse cases (Lovibond and Lovibond 1995). We used logistic regression for each binary response variable in turn to estimate the relative odds of occurrence in an individual given specific risk factors that were statistically significant in the previous analysis. Each covariate (i.e., risk factor) was transformed into a binary factor conveying high versus low risk (see supplemental table S6). For each mental-health disorder, we ran multiple logistic regression models. The first model contained the risk factors described above with the binary factor vegetation cover set at 10%, below which the risk of poor mental health was considered high. The model was then repeated applying an incrementally increased break point in vegetation cover (i.e., less than 15%, less than 20%, less than 25%, 30%, and less than 35%). We identified the point at which the health gains were first recorded as better than the null model on a plot of dose versus the odds ratio for use in the analysis described below (i.e., the confidence interval did not overlap with an odds ratio of one).
For each mental-health disorder, we calculated the population average attributable fraction to estimate the proportion of cases in the population attributable to each of the predictor variables (or risk factors; e.g., Rueckinger et al. 2009). Each risk factor was removed sequentially from the population by classifying every individual as low risk. The probability of each person experiencing mild or worse depression, anxiety, or stress was then calculated, in which the sum of all probabilities across the population was the adjusted number of disease cases expected if the risk factor were not present. The attributable fraction was calculated by subtracting this adjusted number of cases from the observed number of cases. The risk factors were removed in every possible order, and an average attributable fraction from all analyses was obtained (table 2).
Dose–response modeling shows the proportion of mental-health cases in the study population attributable to various risk factors (average population attributable fraction; AAF).
| Depression | Anxiety | Stress | |||||
|---|---|---|---|---|---|---|---|
| Risk factor | Odds ratio (95% CI) | AFF | Odds ratio (95% CI) | AFF | Odds ratio (95% CI) | AFF | |
| Age | Higher risk < 46 years | 3.28 (1.48:7.78) | 0.37 | 2.11 (0.96:4.66) | 0.22 | NA | NA |
| Self-assessment of health | Higher risk < average health | 6.0 (2.02:17.8) | 0.07 | 3.65 (1.31:9.98) | 0.49 | NA | NA |
| Relative time outdoors | Higher risk < less time outdoors | 3.30 (1.64:6.62) | 0.12 | 2.50 (1.25:4.98) | 0.09 | NA | NA |
| Vegetation cover | Higher risk < % vegetation cover* | 2.00 (1.11:3.61) | 0.11 | 2.29 (1.01:5.20) | 0.25 | 1.76 (1.01:3.83) | 0.17 |
| Afternoon bird abundance | Higher risk < 266 birds | 2.03 (1.16:3.52) | 0.15 | 3.05 (1.70:5.50) | 0.24 | 1.70 (0.93:3.44) | 0.17 |
Note: We show a positive association between a reduced population prevalence of depression, anxiety, and stress and minimal thresholds of neighborhood vegetation cover* (depression more than 20% cover, anxiety more than 30% cover, stress more than 20% cover). An odds ratio above 1 indicates that the mental-health disorder is more likely to be present where the risk factor is present.
After accounting for covariates, the odds of having mild or worse depression were significantly lower when neighborhood vegetation cover reached a threshold of 20%, with gains in the odds ratio of 0.35 by 35% vegetation cover (figure 2a). There was a significantly lower chance of having anxiety and stress after 30% and 20% vegetation cover respectively, although there was greater variability in the dose–response curve (figure 2b and 2c). The power of the tests for all three mental-health disorders was reduced at higher levels of vegetation cover (indicated by wider 95% confidence intervals) because the proportion of the respondents reporting poor mental health declined at these levels; increasing the number of respondents may reduce the variability in the dose–response curves.
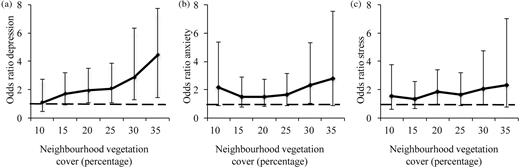
Dose-response relationships between neighborhood vegetation cover and the adjusted odds ratio from logistic regression, of a) depression, b) anxiety, c) stress (error bars are 95% confidence intervals). An odds ratio above one indicates an individual is more likely to have mental health disorders where the vegetation cover threshold is not met.
This threshold analysis has important implications for setting future research directions toward operationalizing nature as a tool for improving health and well-being for populations. Although there is unlikely to be a one-size-fits-all policy for optimizing nature in cities, establishing minimum levels of vegetation cover in neighborhoods is a practical approach that could be incorporated into city design.
The results suggest that if all the respondents lived in neighborhoods with vegetation cover of more than 20%, then the total number showing symptoms of depression would be reduced by up to 11%. The number of cases of anxiety and stress could be reduced by up to 25% and 17% if vegetation cover were more than 30% and more than 20%, respectively. Within the survey population, 38%, 76%, and 38% of the respondents were considered at risk of showing symptoms of depression, anxiety, and stress, respectively, because neighborhood vegetation cover levels were not met. In 2007, it was estimated that depression cost the English economy £7.5 billion, and anxiety cost £8.9 billion in health costs and lost workdays (McCrone et al. 2008). Although the causes of poor mental health are diverse, a simplistic calculation would be that if minimal levels of neighborhood vegetation cover were met, it has the potential to contribute toward an annual saving of up to £0.5 billion and £2.6 billion per year for depression and anxiety alone. Doubtless, the financial implications are marked. Consequently, manipulation of neighborhood vegetation and bird populations to “optimal” levels can and should be encouraged to be undertaken by both private and public stakeholders. There are multiple approaches available, including through the innovative addition of green infrastructure such as tree planting, through the addition of green walls and roofs (Tzoulas et al. 2007), or through the provision of supplementary food and nesting locations to increase local bird abundances (Fuller et al. 2008) and to bring birds into closer contact with people.
Research is starting to tease apart the mechanistic pathways behind how different components of nature benefit mental health (e.g., Bratman et al. 2015, Shanahan et al. 2015a). Although this study does not demonstrate causation per se, the positive relationships between two metrics of neighborhood nature and better mental health are consistent with a mechanistic effect. Indeed, the dose–response relationship for depression—and to a lesser extent, anxiety and stress—is considered to provide some evidence of causality according to Hill's criteria (Hill 1965). These benefits are likely to be provided via two pathways: first by increasing the attractiveness and appeal of green space such that people are more likely to spend time out of doors and therefore increase the likelihood that they will engage in physical or social activities, and second by increasing the visual complexity of the landscape, enhancing its effect on mental restoration and well-being (Shanahan et al. 2015b). However, at the same time, it is important to acknowledge that living close to too much, or inappropriate, nature can also provide a range of dis-services, such as the destruction of property from vegetation and breeding birds (e.g., Rock 2005) or increased levels of vegetation leading to feelings of decreased safety in some neighborhoods (e.g., Kuo et al. 1998). Future research into “best” doses of nature would benefit from exploring the trade-offs between the benefits and dis-services.
Conclusions
Although the causes and drivers of poor mental health are diverse (Kinderman et al. 2015), this study suggests that even low levels of key components of neighborhood nature can be associated with better mental health, providing promise for preventative health approaches. This study shows that quantifiable reductions in the population prevalence of poor mental health can be achieved if minimal thresholds of vegetation cover are met. This has important implications for policy to set minimum levels of neighborhood nature and paves the way to test for health gains that arise from specific interventions. Obviously, optimized levels of nature are not a silver bullet for the prevention or treatment of mental-health problems, but it is an approach that can and should be applied in conjunction with existing frameworks such as medical and social services, reducing crime, and increasing community-driven action. Indeed, optimizing the key components of nearby nature has been shown to change behavior toward increased social cohesion (e.g., Weinstein et al. 2015) and green exercise (e.g., Mitchell and Popham 2008).
Supplemental material
Supplementary data are available at BIOSCI online.
Acknowledgments
We thank M. Evans and M. Gregory for their fieldwork and Professor Harris and Dr. Evans for their support and helpful consultations. We would like to thank six anonymous reviewers for their helpful comments. The data are available on request from the corresponding author and will be made available from mid-2017 at the NERC Environmental Data Information Centre.
Funding statement
DTCC, HLH, KEP, GMS, KA, SH and KJG were funded by the Biodiversity and Ecosystem Service Sustainability project, Natural Environment Research Council grant no. NE/J015237/1. DFS is supported through Australian Research Council Discovery Grant no. DP120102857 and the Centre of Excellence for Environmental Decisions (CEED, Australia); RAF holds an Australian Research Council Future Fellowship.
