


Background. The optimal perioperative use of intensive care unit (ICU) resources is not yet defined. We sought to determine the effect of ICU admission on perioperative (30 day) and long-term mortality.
Methods. This was an observational study of all surgical patients in Scotland during 2005–7 followed up until 2012. Patient, operative, and care process factors were extracted. The primary outcome was perioperative mortality; secondary outcomes were 1 and 4 yr mortality. Multivariable regression was used to construct a risk prediction model to allow standard-risk and high-risk groups to be defined based on deciles of predicted perioperative mortality risk, and to determine the effect of ICU admission (direct from theatre; indirect after initial care on ward; no ICU admission) on outcome adjusted for confounders.
Results. There were 572 598 patients included. The risk model performed well (c-index 0.92). Perioperative mortality occurred in 1125 (0.2%) in the standard-risk group (n=510 979) and in 3636 (6.4%) in the high-risk group (n=56 785). Patients with no ICU admission within 7 days of surgery had the lowest perioperative mortality (whole cohort 0.7%; high-risk cohort 5.3%). Indirect ICU admission was associated with a higher risk of perioperative mortality when compared with direct admission for the whole cohort (20.9 vs 12.1%; adjusted odds ratio 2.39, 95% confidence interval 2.01–2.84; P<0.01) and for high-risk patients (26.2 vs 17.8%; adjusted odds ratio 1.64, 95% confidence interval 1.37–1.96; P<0.01). Compared with direct ICU admission, indirectly admitted patients had higher severity of illness on admission, required more organ support, and had an increased duration of ICU stay.
Conclusions. Indirect ICU admission was associated with increased mortality and increased requirement for organ support.
Trial registration. UKCRN registry no. 15761.
Editor’s key points
High-dependency and intensive care beds are limited in many parts of the world.
Unplanned admission to intensive care is a well- validated clinical indicator of quality and safety.
This study found a strong association between unplanned admission to intensive care with both short- and long-term mortality.
Routine preoperative identification of those most at risk of serious postoperative complications should lead to a direct admission to intensive care.
Identifying the patients at highest risk of dying or developing major complications in the postoperative period remains a major challenge. There is evidence that the proportion of patients who die from postoperative complications varies between hospitals; the so-called ‘failure-to-rescue’ group.8 Thus, routine postoperative admission to critical care after many types of high-risk surgery has long been regarded as an important standard of care;11 however, little evidence to support this exists and that which does is conflicting.7,9,12 There is great interest in identifying which groups of patients are likely to benefit from use of perioperative critical care and whether it offers advantages over standard care after major surgery. The effect of intensive care unit (ICU) admission on postoperative outcome is not something that can easily be tested in a clinical trial, hence the reliance on observational studies.13
High-quality, linked data are available for all patients treated in National Health Service hospitals in Scotland. We sought to use these data to describe the patient characteristics and short- and long-term outcomes of all patients in Scotland undergoing non-cardiac surgery, to explore factors associated with greater risk of death, and to describe current use of intensive care services in Scotland for surgical patients. In particular, we wished to determine the association between mortality and direct admission to the ICU compared with patients admitted to the ICU after a period of care on the ward.
Methods
Ethics, sponsorship, and indemnity
The Chairs of South East Scotland Research Ethics Committees 01 and 02 reviewed the study protocol and waived the need for a full ethics submission. The study underwent review by Information Services Division’s (ISD) Privacy Advisory Committee, which undertakes the role of Caldicott guardianship (Reference PAC 58/11).
Study population and data sources
We used a cohort study design with data held by ISD Scotland. These data are complete, linked, comprise all hospital and ICU admissions in Scotland, and have a low incidence of missing data.14 15 Further details of the linkage process are available in the online supplementary material. We extracted a complete record of surgical inpatients managed in Scotland between January 1, 2005 and December 31, 2007 from the ISD Scottish Morbidity Record (SMR01) database. All adult patients undergoing inpatient general surgery were eligible for inclusion in this study. The Operating Procedure Coding System-4.2 (OPCS)16 was used to identify general surgical procedures. We excluded cardiac and neurosurgical procedures because these patients all have established patient pathways or are managed in specialist centres. In addition, we excluded admissions involving endoscopy, organ transplantation, obstetrics, or the surgical management of burns. For patients with more than one included surgical procedure during the 3 yr study period, we used only the first surgical procedure.
Variables
For each patient, a full data extract was requested, including: age; gender; socio-economic status; surgical OPCS code; diagnosis on admission to hospital [using International Classification of Diseases, 10th Edition (ICD-10) code]; surgical status (elective vs emergency classification); and number of hospital admissions in the 5 yr before the index hospital admission. The OPCS codes and ICD-10 codes were grouped based on frequency. In addition, we reported a measure of co-morbidity using a count of co-morbidities that constitute the Charlson co-morbidity index, a measure of co-morbidity derived from 17 chronic conditions.17 This approach has been used in other investigations.18 Socio-economic status was assigned using quintiles of the Scottish Index of Multiple Deprivation (SIMD), which is based on area of residence and comprises multiple domains of differentially weighted measures of deprivation, including income, employment, education, crime, and housing.19 Operative severity was assigned to each procedure using the ‘BUPA Schedule of Procedures’.20 BUPA operative severity and emergency surgical status are used in ‘Physiological and Operative Severity for the Enumeration of Morbidity and Mortality’ (POSSUM), a widely used risk prediction tool for comparative surgical audit.21 We ascertained admission to an ICU by linkage to the Scottish Intensive Care Society Audit Group (SICSAG) database and obtained ICU-specific variables for those admitted to the ICU, as follows: severity of illness score on ICU admission [measured by Simplified Acute Physiology Score II (SAPS II)]; SAPS II-predicted mortality; requirement and duration of organ support (mechanical ventilation, renal replacement therapy, and cardiovascular support); ICU length of stay; and ICU mortality. Patients were classified by the main exposure variable as follows: those not admitted to ICU during the first 7 days after surgery (‘no ICU admission’); those whose ICU admission occurred immediately after surgery (i.e. transferred directly from theatre or recovery room to ICU, ‘direct ICU admission’); and those who were admitted to the ICU after ≤7 days in a non-ICU environment after surgery (‘indirect ICU admission’).
The primary outcome measure was death within 30 days of the procedure (perioperative mortality). Secondary outcomes were 1 and 4 yr mortality and duration of hospital admission. The 4 yr follow-up was assumed to be complete for all patients. Scottish national statistics indicate that the population has low levels of emigration; ∼1.3% in total and 0.7% in those aged >35 yr.22
Statistical analysis
Univariable analyses were done to test the association of patient and operative factors with mortality at 30 days and 1 and 4 yr. Independent predictors of mortality at these three time points were identified using multivariable logistic regression models. Using 30 day mortality as the dependent variable, we grouped patients into deciles by predicted mortality using variables in the multivariable model with the addition of first-order interactions that improved model fit based on the area under the receiver operating curve and Bayesian Information Criterion (interaction terms comprised: BUPA surgical status*OPCS procedure chapter; emergency surgical status*OPCS procedure chapter). We undertook model checks and assessed discrimination, overall performance, and calibration, reporting the area under the receiver operator curve, Brier score, and Hosmer–Lemeshow goodness of fit. Patients in the highest risk decile were deemed ‘high risk’; all other patients were deemed ‘standard risk’.
All analyses were undertaken using Stata 13 (StataCorp, College Station, TX, USA) and R (R Foundation, Vienna, Austria). We report descriptive and outcome data for standard- and high-risk groups and for patients with no ICU admission, direct ICU admission, and indirect ICU admission, with statistical testing where appropriate. We evaluated the association between ICU admission status and survival in high-risk patients using direct admission to the ICU as the reference category, adjusting for potential confounders using multivariable logistic regression. We present these associations on both relative and absolute scales of risk. Risk on a relative scale remains constant across risk deciles but gives less clear indication of its impact at a population level. We therefore calculated adjusted absolute risk differences across deciles of predicted risk using the ‘margins’ command in Stata. Survival analysis was undertaken for 4 yr mortality and groups were compared using the log-rank test. Statistical significance was set at P<0.05.
Subgroup and sensitivity analyses
To examine patterns of ICU use more fully and potentially to reduce confounding, the following subgroups were analysed: all high-risk patents and patients having elective, major colorectal surgery, and emergency vascular surgery. We chose the last two groups because the procedures are commonly performed major procedures with a high rate of ICU admission. Given that a potential immortal time bias exists (those in the indirect ICU group were required to survive long enough to be admitted to the ICU to a maximum of 7 days after surgery, which was not the situation in the other two groups), we undertook a sensitivity analysis restricted to those alive on successive postoperative days up to postoperative day 8 to ascertain the potential magnitude of this bias.
Results
Study cohort characteristics
A full description of the study cohort, including outcome data, is provided in Table 1. There were 1 014 796 patient records with included codes identified. After exclusion of records relating to re-admissions, patients aged <16 yr, non-surgical or diagnostic procedural codes, and discordant operative or death dates, 572 598 patients remained. A flowchart outlining the selection of the study cohort is presented in Supplementary Fig. 1. A total of 5294 (0.9%) patients died before discharge from hospital and 59 799 (10.4%) died by the end of the 4 yr follow-up period. The commonest five ‘complex major’ surgical procedures for the whole cohort and important subgroups are outlined in Table 2.
Patient characteristics and outcomes in the whole cohort and by risk groups. Missing data were as follows: gender n=2, socio-economic status n=3868, BUPA (British United Provident Association) operative category n=965, and ICU admission status (operation during ICU stay or unknown) n=930. Low- and high-risk groups were derived from a complete patient regression analysis of the data set; missing n=4834 (0.84%). ICU, intensive care unit; IQR, interquartile range
| Whole cohort | Standard risk | High risk | |
|---|---|---|---|
| N | 572 598 | 510 979 | 56 785 |
| Age [yr; mean (sd)] | 53.2 (16–106; 19.5) | 50.7 (16–104; 18.7) | 75.9 (16–104; 10.1) |
| Gender [n (%)] | |||
| Male | 258 249 (45.1) | 228 798 (44.8) | 26 852 (47.3) |
| Female | 314 347 (54.9) | 282 181 (55.2) | 29 933 (52.7) |
| Surgical status [n (%)] | |||
| Elective | 468 176 (81.8) | 44 2080 (86.5) | 23 900 (42.1) |
| Emergency | 104 422 (18.2) | 68 899 (13.5) | 32 885 (57.9) |
| Socio-economic status quintile [n (%)] | |||
| 1 (least deprived) | 95 605 (16.8) | 86 880 (17.0) | 8592 (15.1) |
| 2 | 107 644 (18.9) | 97 516 (19.1) | 9984 (17.6) |
| 3 | 117 680 (20.7) | 105 947 (20.7) | 11 484 (20.2) |
| 4 | 123 642 (21.7) | 110 068 (21.5) | 13 340 (23.5) |
| 5 (most deprived) | 124 159 (21.8) | 110 568 (21.6) | 13 385 (23.6) |
| Count of Charlson co-morbidities [n (%)] | |||
| 0 | 515 241 (90.0) | 472 213 (92.4) | 38 347 (67.5) |
| 1 | 51 734 (9.0) | 35 804 (7.0) | 15 793 (27.8) |
| 2 | 4976 (0.9) | 2654 (0.5) | 2308 (4.1) |
| 3+ | 647 (0.1) | 308 (0.1) | 337 (0.6) |
| BUPA operative severity category [n (%)] | |||
| Minor | 97 391 (17.0) | 92 050 (18.0) | 4779 (8.4) |
| Intermediate | 201 089 (35.2) | 189 568 (37.1) | 10 328 (18.2) |
| Major | 184 511 (32.3) | 161 176 (31.5) | 21 917 (38.6) |
| Major+ | 30 393 (5.3) | 21 368 (4.2) | 8595 (15.1) |
| Complex major | 58 249 (10.2) | 46 817 (9.2) | 11 166 (19.7) |
| Total number of previous hospital admissions [n (%)] | |||
| 0 | 267 929 (46.8) | 249 982 (48.9) | 14 269 (25.1) |
| 1 | 123 676 (21.6) | 113 659 (22.2) | 9515 (16.8) |
| 2 | 64 238 (11.2) | 56 243 (11.0) | 7758 (13.7) |
| 3 | 36 380 (6.4) | 30 701 (6.0) | 5557 (9.8) |
| 4 | 22 438 (3.9) | 18 220 (3.6) | 4144 (7.3) |
| 5+ | 57 937 (10.1) | 42 174 (8.3) | 15 542 (27.4) |
| Hospital length of stay [days; median (IQR)] | 1 (0, 3) | 0 (0, 2) | 9 (3, 22) |
| ICU admission status [n (%)] | |||
| No ICU admission within 7 days of surgery | 565 493 (98.9) | 507 863 (99.5) | 52 866 (93.6) |
| Direct admission to ICU from theatre | 4593 (0.8) | 1837 (0.4) | 2696 (4.8) |
| Indirect admission to ICU within 7 days | 1582 (0.3) | 680 (0.1) | 893 (1.6) |
| Mortality [n (%)] | |||
| Hospital | 5294 (0.9) | 1011 (0.2) | 4239 (7.5) |
| 30 day | 4806 (0.8) | 1125 (0.2) | 3636 (6.4) |
| 1 yr | 21 412 (3.7) | 9054 (1.8) | 12 261 (21.6) |
| 4 yr | 59 799 (10.4) | 34 339 (6.7) | 25 276 (44.5) |
Commonest five complex major procedures undertaken in high-risk group by ICU admission status. Three-digit code refers to Operating Procedure Coding System-4.2 code. ICU, intensive care unit
| Whole cohort (n=13 935) | n (%) | No ICU admission within 7 days (n=12 475) | n (%) | Direct admission to ICU from theatre (n=1116) | n (%) | Indirect admission to ICU within 7 days (n=344) | n (%) |
|---|---|---|---|---|---|---|---|
| H33 excision of rectum | 2253 (20.2) | H33 excision of rectum | 1770 (19.1) | H33 excision of rectum | 326 (23.0) | H33 excision of rectum | 143 (34.9) |
| T30 opening of abdomen | 948 (8.5) | L59 other bypass of femoral artery | 869 (9.4) | L18 emergency replacement of aneurysmal segment aorta | 222 (15.6) | T30 opening of abdomen | 76 (18.5) |
| L59 other bypass of femoral artery | 895 (8.0) | W37 total prosthetic replacement of hip | 841 (9.1) | L19 other replacement of aneurysmal segment | 153 (10.8) | H10 excision of sigmoid colon | 35 (8.5) |
| W37 total prosthetic replacement of hip | 877 (7.9) | L29 reconstruction of carotid artery | 765 (8.3) | T30 opening of abdomen | 153 (10.8) | L19 other replacement of aneurysmal segment aorta | 24 (5.9) |
| L29 reconstruction of carotid artery | 788 (7.06) | T30 opening of abdomen | 695 (7.5) | G01 excision of oesophagus and stomach | 130 (9.2) | L18 emergency replacement of aneurysmal segment | 22 (5.4) |
Predictors of 30 day mortality and creation of risk groups
In univariable and multivariable analyses of the whole cohort, statistically significant associations were seen between mortality at each of the three time points and all variables (Supplementary Tables 1 and 2). A multivariable model constructed to predict perioperative mortality with additional interaction terms demonstrated excellent discrimination (area under the receiver operating curve=0.922; Supplementary Fig. 2) and reasonable calibration and overall performance, with slight underprediction of mortality in risk decile 8 (Supplementary Fig. 3; Hosmer–Lemeshow test statistic χ2=34.7, P = <0.001; Brier Score 0.008). Baseline descriptive and outcome data for standard- and high-risk groups derived from this model are provided in Table 1.
Postoperative ICU admission
The rate of direct admission to the ICU in standard- and high-risk cohorts was 0.4 and 4.8% and the rate of indirect admission to the ICU 0.1 and 1.6%, respectively (Table 1). Patients admitted directly to the ICU from the operating theatre or recovery room were more likely to be older and having emergency or BUPA category 4 or 5 (‘major+ or complex major’) surgery when compared with those admitted indirectly. When restricted to the high-risk group, increased representation of major+ and complex major surgery was the only significant difference between groups. The total duration of hospital admission was longer in patients admitted to the ICU after surgery; this was greatest in the group with indirect admission. When compared with direct ICU admission, patients admitted indirectly to the ICU had greater severity of illness on ICU admission, higher predicted and observed risk of mortality, longer duration of ICU stay, and increased requirement for ventilation and other forms of organ support (Table 3).
Patient characteristics and outcome by ICU admission status for the whole cohort and the high-risk group. P-values are presented for hypothesis tests comparing the direct ICU admission group with the indirect ICU admission group. Missing data for ICU-specific variables were as follows (whole cohort/high-risk cohort): SAPS II score and mortality prediction n=211/n=57, ICU length of stay n=85/n=52, all organ support variables n=291/n=142, and ICU mortality n=21/n=12. CVS, cardiovascular support; ICU, intensive care unit; RRT, renal replacement therapy; SAPS II, Simplified Acute Physiology Score II
| Whole cohort | High-risk cohort | |||||||
|---|---|---|---|---|---|---|---|---|
| No ICU admission | Direct ICU admission | Indirect ICU admission | P-value | No ICU admission | Direct ICU admission | Indirect ICU admission | P-value | |
| n | 565 489 | 4593 | 1582 | 52 866 | 2696 | 893 | ||
| Age [yr; mean (sd)] | 53.0 (16–106; 19.5) | 64.4 (16–104; 16.5) | 63.3 (16–100; 17.0) | 0.03 | 76.2 (23–106; 10.1) | 71.9 (20–102; 10.4) | 72.5 (23–100; 10.2) | 0.11 |
| Gender [n (%)] | 0.44 | 0.40 | ||||||
| Male | 254 381 (45.0) | 2487 (54.1) | 839 (53.0) | 24 662 (46.7) | 1511 (56.0) | 487 (54.5) | ||
| Female | 311 106 (55.0) | 2106 (45.9) | 743 (47.0) | 28 204 (53.3) | 1185 (44.0) | 406 (45.5) | ||
| Surgical status [n (%)] | <0.01 | 0.07 | ||||||
| Elective | 464 192 (82.1) | 2602 (56.7) | 821 (51.9) | 22 124 (41.8) | 1228 (45.5) | 376 (42.1) | ||
| Emergency | 101 297 (17.9) | 1991 (43.3) | 761 (48.1) | 30 742 (58.2) | 1468 (54.5) | 517 (57.9) | ||
| Count of Charlson co-morbidities [n (%)] | 0.22 | 0.35 | ||||||
| 0 | 509 909 (90.2) | 3367 (73.3) | 1188 (75.1%) | 35 766 (67.7) | 1744 (64.7) | 598 (67.0) | ||
| 1 | 50 175 (8.9) | 1083 (23.6) | 335 (21.2%) | 14 636 (27.7) | 832 (30.9) | 244 (27.3) | ||
| 2+ | 4782 (0.8) | 126 (2.7) | 53 (3.4%) | 2146 (4.1) | 107 (4.0) | 45 (5.0) | ||
| BUPA operative severity category [n (%)] | <0.01 | <0.01 | ||||||
| Minor | 97 191 (17.2) | 105 (2.3) | 69 (4.4) | 4744 (9.0) | 12 (0.4) | 17 (1.9) | ||
| Intermediate | 199 797 (35.4) | 439 (9.6) | 260 (16.4) | 9947 (18.8) | 142 (5.3) | 96 (10.8) | ||
| Major | 182 805 (32.4) | 1132 (24.6) | 424 (26.8) | 20 999 (39.7) | 631 (23.4) | 212 (23.7) | ||
| Major+ | 29 329 (5.2) | 757 (16.5) | 247 (15.6) | 7911 (15.0) | 492 (18.2) | 158 (17.7) | ||
| Complex | 55 403 (9.8) | 2160 (47) | 581 (36.7) | 9265 (17.5) | 1419 (52.6) | 410 (45.9) | ||
| ICU characteristics | ||||||||
| SAPS II [median (IQR)] | – | 24.0 (15.0, 36.0) | 28.0 (18.0, 41.0) | <0.01 | – | 29.0 (20.0, 40.0) | 32.0 (23.0, 44.0) | <0.01 |
| SAPS II mortality prediction [median (IQR)] | – | 5.8 (2.0, 18.1) | 8.8 (2.9, 26.6) | <0.01 | – | 9.7 (3.7, 24.7) | 12.8 (5.2, 32.6) | <0.01 |
| ICU length of stay [days; median (IQR)] | – | 1.8 (0.9, 3.7) | 2.2 (0.9, 5.0) | <0.01 | – | 2.0 (1.0, 4.1) | 2.5 (1.1, 5.1) | <0.01 |
| Ventilated at any time [n (%)] | – | 2142 (49) | 878 (58) | <0.01 | – | 1432 (55.3) | 510 (55.9) | 0.03 |
| Ventilator days [mean (sd)] | – | 1.9 (4.5) | 3.3 (6.8) | <0.01 | – | 2.2 (4.8) | 3.2 (6.6) | <0.01 |
| RRT at any time [n (%)] | – | 231 (5.3) | 174 (11.5) | <0.01 | – | 170 (6.6) | 104 (12.1) | <0.01 |
| Days of RRT [mean (sd)] | – | 0.3 (2.0) | 0.7 (2.9) | <0.01 | – | 0.4 (2.1) | 0.7 (2.6) | <0.01 |
| CVS support at any time [n (%)] | – | 1272 (29.1) | 614 (40.5) | <0.01 | – | 974 (37.6) | 384 (44.8) | <0.01 |
| Days of CVS support [mean (sd)] | – | 0.9 (2.0) | 1.4 (3.1) | <0.01 | – | 1.1 (2.2) | 1.5 (3.0) | <0.01 |
| Hospital stay [days; median (IQR)] | 1 (0, 3) | 14 (8, 27) | 16 (9, 31) | <0.01 | 9 (3, 21) | 17 (10, 31) | 17 (10, 33) | 0.13 |
| Mortality [n (%)] | ||||||||
| ICU | – | 318 (6.9) | 240 (15.2) | <0.01 | – | 271 (10.1) | 158 (17.8) | <0.01 |
| Hospital | 4027 (0.7) | 641 (14.0) | 384 (24.3) | <0.01 | 3297 (6.2) | 551 (20.4) | 270 (30.2) | <0.01 |
| 30 day | 3728 (0.7) | 556 (12.1) | 330 (20.9) | <0.01 | 2818 (5.3) | 481 (17.8) | 234 (26.2) | <0.01 |
| 1 yr | 19 619 (3.5) | 992 (21.6) | 494 (31.2) | <0.01 | 10 921 (20.7) | 827 (30.7) | 355 (39.8) | <0.01 |
| 4 yr | 56 997 (10.1) | 1674 (36.4) | 707 (44.7) | <0.01 | 23 213 (43.9) | 1339 (49.7) | 511 (57.2) | <0.01 |
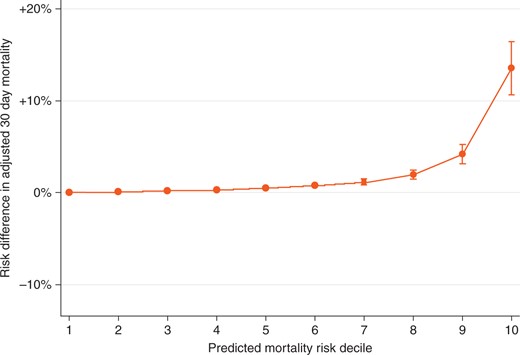
Absolute risk difference in adjusted 30 day mortality of indirect vs direct ICU admission across deciles of predicted mortality risk. ICU, intensive care unit.
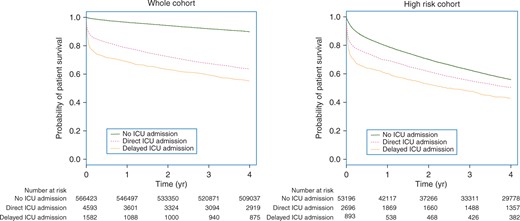
Survival analysis by ICU admission status: whole cohort and high-risk subgroup. ICU, intensive care unit.
Adjusted risk of death according to ICU admission status in the whole cohort and subgoups. CI, confidence interval; ICU, intensive care unit; OR, odds ratio
| 30 day mortality | 1 yr mortality | 4 yr mortality | |||||||
|---|---|---|---|---|---|---|---|---|---|
| OR | 95% CI | P-value | OR | 95% CI | P-value | OR | 95% CI | P-value | |
| Whole cohort (n=566 835) | |||||||||
| Direct ICU admission | 1 | 1 | 1 | ||||||
| No ICU admission | 0.26 | 0.23, 0.29 | <0.01 | 0.42 | 0.39, 0.46 | <0.01 | 0.52 | 0.48, 0.56 | <0.01 |
| Indirect ICU admission | 2.39 | 2.01, 2.84 | <0.01 | 2.12 | 1.82, 2.47 | <0.01 | 1.81 | 1.57, 2.10 | <0.01 |
| High-risk decile (n=56 455) | |||||||||
| Direct ICU admission | 1 | 1 | 1 | ||||||
| No ICU admission | 0.32 | 0.28, 0.36 | <0.01 | 0.51 | 0.46, 0.56 | <0.01 | 0.6 | 0.55, 0.66 | <0.01 |
| Indirect ICU admission | 1.71 | 1.41,2.08 | <0.01 | 1.56 | 1.31, 1.85 | <0.01 | 1.39 | 1.17, 1.65 | <0.01 |
| Elective colorectal surgery (n=5902) | |||||||||
| Direct ICU admission | 1 | ||||||||
| No ICU admission | 0.29 | 0.20, 0.41 | <0.01 | – | – | – | – | – | – |
| Indirect ICU admission | 2.00 | 1.21, 3.30 | <0.01 | – | – | – | – | – | – |
| Emergency major vascular surgery (n=5528) | |||||||||
| Direct ICU admission | 1 | ||||||||
| No ICU admission | 0.32 | 0.24, 0.42 | <0.01 | – | – | – | – | – | – |
| Indirect ICU admission | 2.06 | 1.23, 3.44 | <0.01 | – | – | – | – | – | – |
Subgroup and sensitivity analyses
In subgroup analyses, similar associations were seen in analyses restricted to the high-risk group (Table 4); after adjustment for case-mix and risk factors, no postoperative ICU admission was associated with a reduction in the risk of death at 30 days (OR 0.32, 95% CI 0.28–0.36; P<0.01), and indirect ICU admission was associated with further increased risk of 30 day mortality (OR 1.71; 95% CI 1.41–2.08; P<0.01), when compared with direct ICU admission. The subgroups of major elective colorectal and emergency vascular surgery demonstrated a similar magnitude of increased risk of perioperative mortality in the indirect ICU admission group relative to the direct group (Table 4).
In the sensitivity analysis to assess the potential effect of immortal time bias, the adjusted risk of death for those admitted indirectly to the ICU compared with those admitted directly to the ICU was highest for those alive on the third postoperative day (OR 2.65, 95% CI 2.20–3.20, compared with OR 2.39 in the primary analysis). This indicated that the likely magnitude of the immortal time bias was small (Supplementary Fig. 4).
Discussion
The principal finding of this study was that after adjustment for case-mix and risk factors, indirect postoperative admission to an ICU was associated with increased perioperative and long-term mortality. A 4 yr follow-up was available for all patients in this study; however, 30 day to 1 yr mortality is likely to be the time period most affected by postoperative ICU admission. These findings were observed in the whole cohort and when restricted to a high-risk cohort and specific groups of high-risk surgical procedures. In absolute terms, the magnitude of increased risk is most marked for patients in the top two deciles of postoperative risk, suggesting a number needed to treat of 7 to prevent one postoperative death in the highest risk decile. Compared with direct ICU admission, no ICU admission was associated with lower risk of death even in the high-risk cohort. This is likely to represent residual confounding.
Surgical patients make up a sizeable proportion of ICU admissions. Of particular concern to clinicians are ‘failure-to-rescue’ patients (i.e. those who die from early postoperative complications).8 Other studies have suggested increased mortality associated with delayed ICU admission as a result of lack of bed availability in mixed medical–surgical populations23,24 or in patients held in postanaesthesia care units.25 Our work focuses on the decision to admit patients directly to the ICU after surgery, for logic dictates that if patients are identified as being at high risk of developing postoperative complications, elective admission to an ICU will enable early recognition and prompt treatment should they occur, resulting in improved survival.
Our findings are consistent with other recent estimates of 30 day and 1 yr mortality after high-risk surgery26 and another recent epidemiological study of ICU use in Medicare beneficiaries undergoing major surgical procedures in the USA.12 The latter study suggested little consensus on admission criteria and no evidence of improved outcome associated with routine ICU admission. After certain procedures, the study demonstrated an association between ICU admission, increased length of hospital admission, and costs.
We believe that the present study has the following strengths. Firstly, to our knowledge, this is the first direct-linkage cohort study to report complete short- and long-term outcomes after surgery at a national level. Other studies have used data from large administrative databases that do not have full national coverage (e.g. Medicare,12 Veterans Affair beneficiaries5,27 in the USA) or data sets with no linkage to ICU or registry data, thereby necessitating an ecological approach, with potential for bias.7,9 Secondly, previous studies have defined the high-risk surgical group by surgical procedure only.13 The methodology used in our study has the advantage of considering both patient-level and operative-level factors to predict outcome, with excellent discrimination and overall model performance, although the risk prediction model requires validation in an external data set. This study demonstrates a group of patients at particularly high risk of perioperative mortality and the variable use of critical care facilities, which has not been reported previously at a population level.
Despite access to high-quality data, these findings may be subject to bias and residual confounding. Only first admissions in the 3 yr period were included to allow long-term follow-up. As re-admitted patients are often sicker and have more co- morbidities, this may have introduced selection bias. We were unable reliably to identify patients admitted to high-dependency units in our data extract. Finally, the decision to admit a patient to the ICU after surgery is often multifactorial and includes reasons not easily captured in administrative data, such as unexpected perioperative events, concerns by the clinical team, and the availability of ICU beds. Even with exhaustive attempts to adjust for differences in case-mix, we were not able to account fully for these factors.
This study highlights important issues around how ICU resources are used after surgery. Firstly, absolute increases in mortality between indirect and direct admission to the ICU are greatest in higher risk deciles, as expected. If it were possible to identify patients in advance who were admitted to the ward but who subsequently required ICU admission, admitting 24 of these patients in risk decile 9 electively to the ICU might prevent one perioperative death (number needed to treat=24); likewise, admitting seven of these patients in the highest risk decile might prevent one perioperative death (number needed to treat=7). This suggests that, at a population level, this group of patients would benefit most from direct ICU admission after surgery. Secondly our data suggest that the type of surgery rather than patient factors (e.g. co-morbidity) may drive the decision to admit patients to ICU after surgery. Finally, in common with other studies,12 morality was higher in patients admitted directly to the ICU compared with no ICU admission either in the high-risk group or in predefined subgroups even after adjustment for potential confounders. This indicates residual confounding.
The indication for elective admission to the ICU after major surgery remains unclear. Many of the advantages of ICU care can now be delivered in a specialist ward or high-dependency unit setting. Few surgical patients require invasive monitoring or organ support after surgery; instead, analgesia, early mobilization, fluid therapy, and early identification of complications can be delivered in other settings without some of the potential disadvantages associated with ICU admission, such as delayed mobilization or risk of hospital-acquired infection.28 Thus, it may be the availability of ICU beds for those who require them9,10 rather than routine admission for many types of low-risk major surgical procedures that is the more important factor.12
In conclusion, in a national linked cohort study and after adjustment for patient, surgical, and socio-economic factors, the highest mortality rates were observed in patients admitted to the ICU after a period of care on a standard ward, and the absolute increase in risk was most marked in the highest risk patients. Future studies are required to improve perioperative management pathways for this high-risk group, including optimal use of critical care resources.
Authors’ contributions
Conceived the project and secured the funding: M.A.G., N.I.L., T.S.W., R.W.P., R.M.P.
Study design, interpretation of results and preparation of the manuscript: all authors.
M.A.G., N.I.L., C.H., L.S., S.G., E.M.H. designed and performed the data extraction, cleaned and recoded the data, and performed aspects of the analysis.
Overall responsibility for the integrity of the manuscript: M.A.G., N.I.L.
Supplementary material
Supplementary material is available at British Journal of Anaesthesia online.
Declaration of interest
M.A.G. is a Chief Scientist’s Office (CSO) NHS Research Scheme Clinician. R.M.P. lectures and performed consultancy work for Nestle Health Sciences, Medtronic, Edwards Lifesciences, and Massimo Inc. All other authors report no conflict of interest.
Funding
Chief Scientist’s Office Scotland (grant no. CHZ/821/4).
Handling editor: P. S. Myles
References


