


Abstract
Studies of the same disease often implicate different brain regions, contributing to a perceived reproducibility crisis in neuroimaging. Here, we leverage the normative human brain connectome to test whether seemingly heterogeneous neuroimaging findings localize to connected brain networks. We use neurodegenerative disease, and specifically Alzheimer’s disease, as our example as it is one of the diseases that has been studied the most using neuroimaging. First, we show that neuroimaging findings in Alzheimer’s disease occur in different brain regions across different studies but localize to the same functionally connected brain network. Second, we show that neuroimaging findings across different neurodegenerative diseases (Alzheimer’s disease, frontotemporal dementia, corticobasal syndrome, and progressive non-fluent aphasia) localize to different disease-specific brain networks. Finally, we show that neuroimaging findings for a specific symptom within a disease (delusions in Alzheimer’s disease) localize to a symptom-specific brain network. Our results suggest that neuroimaging studies that appear poorly reproducible may identify different regions within the same connected brain network. Human connectome data can be used to link heterogeneous neuroimaging findings to common neuroanatomy, improving localization of neuropsychiatric diseases and symptoms.
Introduction
Neuroimaging studies designed to localize a disease, symptom, or psychological process often fail to identify the same brain region across different studies (Button et al., 2013; Poldrack et al., 2017). For example, neuroimaging studies of Alzheimer’s disease identify different brain regions depending on the imaging modality (Schroeter and Neumann, 2011). Similarly, studies of specific symptoms within Alzheimer’s disease (e.g. delusions) have been highly inconsistent (Ismail et al., 2011). This heterogeneity has raised concerns of a ‘reproducibility crisis’ in neuroimaging, similar to concerns regarding reproducibility of neuroscience research in general (Open Science Collaboration, 2015; Baker and Penny, 2016). Given the importance of this issue, much effort has gone towards identifying factors responsible for this lack of reproducibility such as sample size, bias, study design, data processing, selective reporting, and a variety of statistical issues (Carp, 2012; Button et al., 2013; Eklund et al., 2016; Poldrack et al., 2017).
One factor that has received less attention is our assumptions regarding what exactly should be reproducible. In neuroimaging, a common assumption is that findings should replicate to the same brain region (Eickhoff et al., 2009; Yarkoni et al., 2011). However cognitive functions, neuropsychiatric symptoms, and diseases may better localize to brain networks than single brain regions (Fox et al., 2005; Dickerson et al., 2009; Seeley et al., 2009; Bickart et al., 2014). For example, brain lesions causing the same symptom routinely occur in multiple different brain locations (Boes et al., 2015; Fischer et al., 2016; Laganiere et al., 2016; Darby and Fox, 2017; Darby et al., 2017, 2018a, b; Fasano et al., 2017). If lesions causing the same symptom do not localize to the same brain region, then why should neuroimaging findings?
Recently, we showed that the normative human brain connectome can be used to link heterogeneous lesion locations causing the same symptom to a common brain network (Boes et al., 2015; Fischer et al., 2016; Laganiere et al., 2016; Darby and Fox, 2017; Darby et al., 2017, 2018a, b; Fasano et al., 2017). This approach has helped localize lesion-induced hallucinations (Boes et al., 2015), delusions (Darby and Fox, 2017; Darby et al., 2017), coma (Fischer et al., 2016), movement disorders (Laganiere et al., 2016; Fasano et al., 2017), and criminality (Darby et al., 2018a) to symptom-specific brain networks. Here, we test whether a similar approach can help reconcile heterogeneous neuroimaging findings across different studies.
As an initial test of this hypothesis, we focus on neuroimaging findings in Alzheimer’s disease. We chose Alzheimer’s disease because it is one of the most studied brain disorders using neuroimaging (Weiner and Veitch, 2015), has major public health implications (Prince et al., 2013), and because existing evidence suggests that Alzheimer’s disease pathology may localize better to a brain network than a single brain region (Seeley et al., 2009; Zhou et al., 2012; Fornito et al., 2015; Seeley, 2017). We hypothesize that: (i) neuroimaging abnormalities in Alzheimer’s disease across different studies and imaging modalities (atrophy, metabolism, perfusion) will share a common network localization; (ii) neuroimaging findings in Alzheimer’s disease will have distinct network localization compared to neuroimaging findings reported in other neurodegenerative diseases; and (iii) neuroimaging correlates of a specific symptom within Alzheimer’s disease (delusions) will show symptom-specific network localization.
Materials and methods
Study selection
We identified studies reporting neuroimaging abnormalities in patients with Alzheimer’s disease versus controls using structural atrophy (nine studies), hypometabolism (nine studies), or hypoperfusion (eight studies) from a recently published coordinate-based meta-analysis using activation likelihood estimation (ALE) (Schroeter and Neumann, 2011). We next identified structural atrophy studies of patients with Alzheimer’s disease, behavioural variant frontotemporal dementia (bvFTD), corticobasal syndrome (CBS), and progressive non-fluent aphasia (PNFA) through a literature search. We selected these non-Alzheimer’s disease dementia syndromes based on a prior study showing that these syndromes also localized to distinct functional brain networks (Seeley et al., 2009). Finally, we identified studies reporting neuroimaging abnormalities in dementia patients with versus without delusions. Inclusion required whole brain analysis with coordinates for significant differences reported in MNI or Talairach space. Talairach coordinates were converted into MNI coordinates using the automated transformation implemented in GingerALE software(version 2.3.3 www.brainmap.org).
Replication of activation likelihood estimation results
We first replicate the findings from Schroeter and Neumann (2011) by performing an ALE analysis using GingerALE. Briefly, a 3D Gaussian probability distribution is created centred on each individual foci and modified by the sample size from each study in order to estimate the spatial uncertainty surrounding each focus. These distributions are then combined across all experiments to arrive at the activation likelihood estimate maps. Finally, a cluster-level inference is used to determine significance. The true convergence on the ALE is compared against a null distribution of 1000 simulated datasets with identical number of foci, experiments, and subjects, but with the foci randomly distributed. Cluster-forming threshold was set at P < 0.001 and cluster-level inference threshold was set at P < 0.05.
Network localization meta-analysis
This prior meta-analysis concluded that neuroimaging findings in different imaging modalities are distinct (Schroeter and Neumann, 2011). Here, we instead test the hypothesis that these neuroimaging abnormalities are all functionally connected to the same network of brain regions. Spherical seeds (4 mm) were created centred at each reported coordinate and were added together to generate a study-specific combined seed, similar to the methods in other neuroimaging meta-analysis techniques (Eickhoff et al., 2009; Yarkoni et al., 2011). To ensure results were independent of sphere size, analyses were repeated using 2 mm and 6 mm spheres. Next, we identified regions functionally connected to each study’s combined seed using a publicly available connectome of 1000 normal subjects from the Brain Genomics Superstruct Project (https://dataverse.harvard.edu/dataverse/GSP) (Yeo et al., 2011; Holmes et al., 2015). This approach is similar to other recent connectome-based studies (Darby and Fox, 2017; Horn et al., 2017; Darby et al., 2018a). Connectivity maps were thresholded at t > 5, which corrects for multiple comparisons on a voxel-wise basis using a family-wise error (FWE) rate of P < 0.05 (uncorrected P < 10−6). Note that voxel-based correction is more conservative than cluster-based correction (Eklund et al., 2016). To ensure results were not dependent on threshold, analyses were repeated for thresholds of t > 7 and t > 10. Binarized maps from each study were then added together to identify regions significantly connected to all, or most, studies. We specifically tested: (i) whether network localization was consistent within each neuroimaging modality; and (ii) whether network localization was consistent across different neuroimaging modalities. To provide a quantitative measure, we also calculated a dice index of similarity between each pair of binarized connectivity maps, defined as 2 × (volume overlap) / (volume map #1) + (volume map #2).
Specificity of network localization meta-analysis
Specificity of network localization of neuroimaging findings was assessed by comparing the unthresholded connectivity maps from studies of Alzheimer’s patients with connectivity maps from studies of patients with FTD, CBS, and PNFA using a two-sample t-test. To demonstrate generalizability, we also computed a network localization for neuroimaging abnormalities in bvFTD, CBS, and PNFA by comparing connectivity maps from each syndrome versus all other neurodegenerative syndromes. We hypothesized that each neurodegenerative disorder would localize to unique brain networks (Seeley et al., 2009), with the null hypothesis that network localization would not differ according to dementia syndrome. Statistical comparison between diseases was conducted using Statistical Parametric Mapping software (SPM12, http://www.fil.ion.ucl.ac.uk/spm/software/spm12/), unthresholded connectivity maps, voxel-wise whole-brain analysis, and the default parameters for cluster-based FWE correction for multiple comparisons (cluster defining threshold of P < 0.001, FWE-corrected threshold of P < 0.05). To ensure that the results were not dependent on the selected statistical approach, analyses were repeated using permutation-based correction implemented in Statistical non-Parametric Mapping software (SnPM13, http://warwick.ac.uk/snpm, cluster defining threshold of P < 0.001, FWE-corrected threshold of P < 0.05).
Network localization of specific symptoms
Finally, we demonstrate that our approach can be used to localize specific symptoms within a neurodegenerative disease. We generated connectivity maps based on neuroimaging abnormalities reported in studies of Alzheimer’s patients with delusions (versus patients without delusions, n = 12 studies). We compared these maps to connectivity maps derived from neuroimaging abnormalities reported in studies of patients with Alzheimer’s disease in general (versus subjects without Alzheimer’s disease, n = 26 studies) using a two-sample t-test implemented in SPM12, as described in the previous paragraph.
We next assessed whether network localization of neuroimaging abnormalities in dementia patients matched network localization in lesion-induced delusions. We created an a priori region of interest in the right ventral frontal cortex based on our lesion network mapping localization of delusions following focal brain lesions (Darby et al., 2017). Functional connectivity between this a priori region of interest and neuroimaging coordinates from each study of patients with Alzheimer’s disease with delusions was computed. Specifically, functional MRI time courses were extracted for the a priori region of interest and the coordinates, Pearson’s correlation coefficient between time-courses were computed, r-values were transformed into a normal distribution using the Fischer’s r to z transformation, and Fischer z-values were averaged across all subjects in our normative 1000 subject dataset. Differences in connectivity strength to our a priori region of interest were assessed between studies of patients with Alzheimer’s disease with versus without delusions using a two-tailed t-test. Statistics for our a priori region of interest analysis were computed using the statistical package STATA (College Station, TX, version 14.0).
Data availability
Data are available from the corresponding authors upon request.
Results
Network localization of neuroimaging findings in Alzheimer’s disease is reproducible within and across imaging modalities
We identified 26 studies reporting neuroimaging abnormalities in patients with Alzheimer’s disease based on structural imaging (nine studies), metabolism (nine studies), or perfusion (eight studies; Supplementary Table 1). To avoid bias, we used the same studies selected for a recent coordinate-based meta-analysis of neuroimaging findings in Alzheimer’s disease (Schroeter and Neumann, 2011). Using standard meta-analytic methods (Eickhoff et al., 2009), these neuroimaging findings were heterogeneous (Schroeter and Neumann, 2011). Within an imaging modality, some brain regions appeared more often than expected by chance (Fig. 1A). However, only 6/9 structural studies (67%), 3/9 metabolic studies (33%), and 4/8 perfusion studies (50%) contributed to the most consistent finding within each modality. Across the three different imaging modalities, no consistent neuroimaging abnormalities were present (Fig. 1A, right).
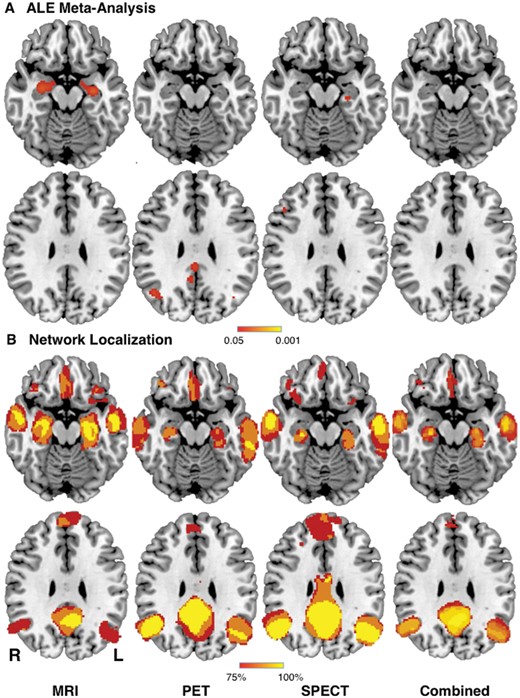
Network localization improves reproducibility of neuroimaging findings across modalities in Alzheimer’s disease. (A) Replication of prior ALE meta-analysis (Schroeter and Neumann, 2011) showing neuroimaging findings in Alzheimer’s disease patients based on structural (MRI), metabolic (PET), and perfusion (single-photon emission computed tomography, SPECT) imaging. No neuroimaging findings were reproducible across modalities (Combined). (B) In contrast, network localization of these same neuroimaging findings showed high reproducibility within and across modalities, with 100% of studies showing connectivity to the same set of brain regions. L = left; R = right.
Next, we tested whether these heterogeneous neuroimaging findings localized to a common brain network. For each study, a 4-mm sphere was generated at each coordinate to obtain a study-specific map of neuroimaging abnormalities (Fig. 2A). Next, brain regions functionally connected to each study-specific map were identified using a large (n = 1000), publicly available normative connectome (FWE-corrected P < 0.05; Fig. 2B). Finally, network maps from each study were overlaid to identify any common and reproducible connections across studies (Fig. 2C). When we applied this approach to our 26 studies of Alzheimer’s disease, we found that 100% of studies reported neuroimaging abnormalities that were connected to the same set of brain regions, both within and across imaging modalities (Fig. 1B and Supplementary Table 2). Results were independent of specific methodology such as sphere size (spatial correlation > 0.99) or map threshold (spatial correlation > 0.97; Supplementary Fig. 1.)
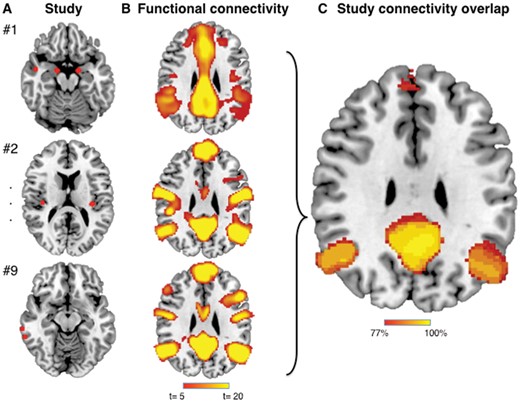
Network localization of neuroimaging findings method. (A) Spherical seeds (4 mm) were generated at each reported significant coordinate for each study, then added together to create a combined map of neuroimaging findings for each study. (B) Regions significantly connected to each study’s neuroimaging findings were calculated using a large (n = 1000) normative connectome (maps thresholded at t > 5 corresponding to voxel-wise FWE-corrected P < 0.05). (C) Network maps from each study were overlaid to identify functional connections common to the greatest number of studies.
To quantify the consistency of these network patterns across individual studies, we calculated the dice index between each pair of network maps (a higher dice index indicates more similar maps). The mean dice index for all pairs was 0.58 (standard deviation 0.15, Supplementary Fig. 2), which was significantly higher than the null hypothesis of 0 (t = 69, P < 0.0001). Dice indices were significantly higher within a modality versus between modalities (0.62 versus 0.56, t = 3.5, P = 0.0005).
Network localization of neuroimaging findings is specific for different dementia disorders
To determine whether this network localization was specific to Alzheimer’s disease, we compared neuroimaging findings in Alzheimer’s disease to neuroimaging findings in other neurodegenerative disorders. For this analysis we focused on structural atrophy, as it was the most commonly used imaging modality and avoids bias that could stem from use of different imaging modalities in different neurodegenerative diseases. We compared neuroimaging findings in Alzheimer’s disease (31 studies), to those in bvFTD (21 studies), CBS (12 studies), and PNFA (eight studies; Supplementary Table 1). Network localization to regions including the mesial temporal lobes, temporal-parietal lobes, and precuneus was specific for Alzheimer’s disease compared to other neurodegenerative disorders (FWE-corrected P < 0.05; Fig. 3A and Supplementary Table 3). Neuroimaging findings from each of the other disorders also showed network specificity, including fronto-insular and orbitofrontal cortex in frontotemporal dementia (Fig. 3B); intraparietal sulcus in corticobasal syndrome (Fig. 3C); and left inferior frontal gyrus in PNFA (Fig. 3D). Results were independent of the statistical method used (Supplementary Fig. 3). Network overlap maps for each syndrome are shown in Supplementary Fig. 4.
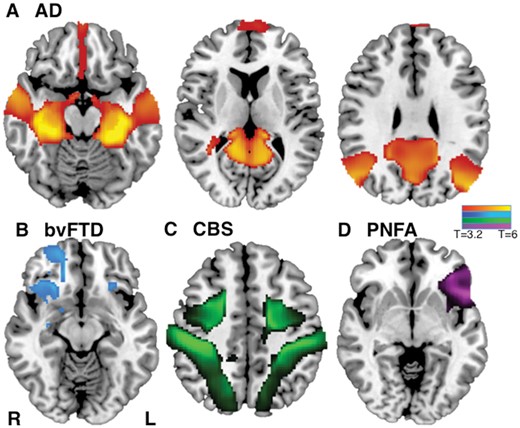
Network localization of neuroimaging findings is distinct for different neurodegenerative disorders. Specificity of network localization for each dementia syndrome versus all other syndromes (FWE-corrected P < 0.05) for Alzheimer’s disease (AD) (A), bvFTD (B), CBS (C), and PNFA (D). L = left; R = right.
Network localization of neuroimaging findings in dementia patients with delusions
Finally, we tested whether our network localization method would be useful for specific symptoms within patients with Alzheimer’s disease. We focused on delusions because neuroimaging studies of this symptom in Alzheimer’s disease have been inconsistent (Ismail et al., 2011) and we had a clear a priori hypothesis regarding the network localization of delusions based on a recent study of focal brain lesions (Darby and Fox, 2017; Darby et al., 2017). We identified 12 studies reporting neuroimaging abnormalities in patients with Alzheimer’s disease with delusions (atrophy, metabolism, and perfusion) (Supplementary Table 1). Standard coordinate-based meta-analysis using ALE identified two regions where abnormalities occurred above chance, but again the results were heterogeneous, with only 2/12 (16%) of studies contributing to each peak (Supplementary Fig. 5). Further, neither peak aligned with our a priori localization of delusions based on focal brain lesions.
Using network localization, we found that the neuroimaging abnormalities from 90% of studies were functionally connected to right frontal cortex (Fig. 4A). Connectivity of neuroimaging abnormalities to the right frontal cortex was specific to studies of patients with Alzheimer’s disease with delusions (n = 12) versus studies of patients with Alzheimer’s disease without delusions (n = 26; FWE corrected P < 0.05; Fig. 4B). This location in the right frontal cortex matched our a priori localization of delusions almost exactly (Fig. 4C). To confirm this match quantitatively, we determined the strength of connectivity between the location of neuroimaging abnormalities in patients with Alzheimer’s disease and our a priori region of interest in the right frontal cortex. Coordinates from neuroimaging studies of patients with Alzheimer’s disease with delusions were significantly connected to this a priori region (Fisher r to z = 0.14, P < 0.001), and significantly more connected to this a priori region of interest than coordinates from neuroimaging studies of patients with Alzheimer’s disease without delusions (P < 0.005; Fig. 4D).
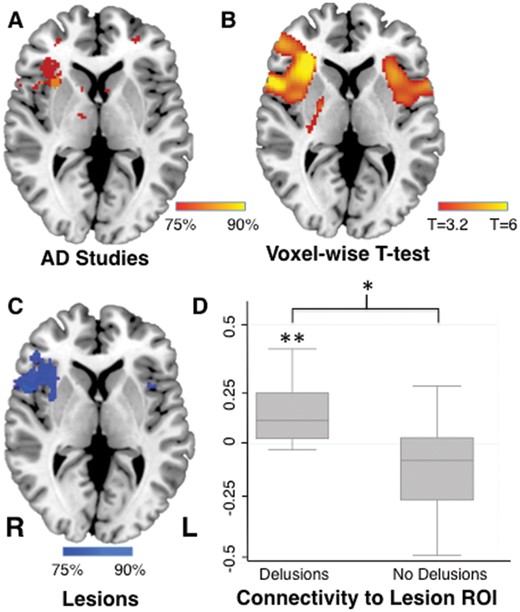
Common network localization for delusions in dementia and focal brain lesions. Neuroimaging findings from studies of Alzheimer’s disease patients with delusions were functionally connected to the right frontal cortex (A), a connectivity pattern that was specific compared to neuroimaging findings from studies of Alzheimer’s disease patients without delusion (B). Lesion locations causing delusions are also connected to the right frontal cortex (Darby et al., 2017), providing an a priori region of interest for the present study (C). Neuroimaging findings from studies of Alzheimer’s disease patients with delusions were significantly connected to this region of interest (Fischer’s r to z), and significantly more connected than neuroimaging findings in Alzheimer’s disease patients without delusions (D). *P < 0.005, **P < 0.001. L = left; R = right; ROI = region of interest.
Discussion
By looking at the set of regions functionally connected to each neuroimaging finding, rather than just the coordinates themselves, we show that neuroimaging findings that seem poorly reproducible localize to specific brain networks. To validate our method, we show network localization of heterogeneous neuroimaging findings (i) within a disease across different imaging modalities; (ii) within an imaging modality across different diseases; and (iii) for a specific symptom within a disease. These results suggest that network localization may help reconcile heterogeneous neuroimaging findings across studies, improving our ability to link brain symptoms or diseases to neuroanatomy.
Comparing neuroimaging results across studies
By far the most common approach for comparing neuroimaging results across studies is coordinate-based meta-analysis (Eickhoff et al., 2009; Yarkoni et al., 2011). Because the majority of neuroimaging studies report the location of significant findings as x, y, z coordinates in a standardized brain space, coordinate-based meta-analysis gives researchers a powerful tool to investigate the reproducibility of neuroimaging findings. Many approaches have been developed, including ALE (Eickhoff et al., 2009), multi-level kernel density analysis (MKDA) (Wager et al., 2004), and signal differential mapping (SDM) (Radua et al., 2012). These techniques can all help determine whether coordinates identified across different studies appear more commonly (or in closer anatomical proximity) than might be expected by chance.
Recently, neuroimaging meta-analysis techniques have begun to incorporate the concept of network localization using meta-analytic connectivity modelling (Lancaster et al., 2005; Neumann et al., 2005; Robinson et al., 2010, 2012). Meta-analytic connectivity modelling determines whether different brain regions are coactive across different functional neuroimaging studies (functional MRI and PET) using either the same task (Lancaster et al., 2005; Neumann et al., 2005), or many different tasks (Robinson et al., 2010, 2012). Brain networks derived from meta-analytic connectivity modelling are similar to those derived from resting state functional connectivity (Smith et al., 2009), supporting the hypothesis that regions activated by the same tasks fall within the same functionally connected brain network.
However, all of these prior meta-analytic techniques assume that neuroimaging findings should reproduce to the same brain location(s). Even meta-analytic connectivity modelling, which focuses on brain networks, relies on the similar coordinates appearing across different studies. If different studies identify coordinates in completely different brain locations, as occurred in Alzheimer’s disease or delusions within Alzheimer disease, we would conclude that the neuroimaging results are not reproducible. In many ways, the analysis approach is similar to classical lesion analysis, which assumes that lesions causing the same symptom should overlap in the same location(s) (Adolphs, 2016).
Our approach is fundamentally different from prior neuroimaging meta-analysis techniques. Rather than assume that coordinates from individual studies should occur in the same brain location, we assume that they should occur within the same brain network. This approach has proven valuable in lesion mapping, where brain lesions causing the same symptom often occur in different brain locations, but are part of the same brain network (Boes et al., 2015; Fischer et al., 2016; Laganiere et al., 2016; Darby and Fox, 2017; Darby et al., 2017, 2018a; Fasano et al., 2017). Here, we show that this approach is equally valuable for neuroimaging findings across different studies. By shifting our hypothesis from regional localization to network localization, we show that seemingly inconsistent findings are, in fact, reproducible.
Network localization in neurodegenerative disorders
Although our technique can theoretically be applied to neuroimaging findings for any disease, symptom, or brain function, we focused on Alzheimer’s disease for initial methodological validation due to documented heterogeneity in neuroimaging findings (Schroeter and Neumann, 2011) and accumulating evidence that this disease localizes to a connected brain network (Buckner et al., 2009; Seeley et al., 2009; Greicius and Kimmel, 2012; Zhou et al., 2012). If one identifies an area of peak atrophy in patients with Alzheimer’s disease, other brain regions connected to this peak region will likely also show atrophy (Seeley et al., 2009; Raj et al., 2012), and show progression of atrophy over time (Mandelli et al., 2016; Torok et al., 2018). Similarly, this same network also shows changes on functional neuroimaging (Jack et al., 2010; Zhou et al., 2010). As such, the novel contribution of the current study is not suggesting that Alzheimer’s disease localizes to a brain network or even the identification of this network. Rather, we used Alzheimer’s disease to validate a new method for linking heterogeneous neuroimaging findings across different studies to a common brain network in a data-driven manner.
Beyond Alzheimer’s disease, our technique appears to be useful for neurodegenerative diseases in general, with disease-specific localization of neuroimaging findings in Alzheimer’s disease, FTD, CBS, and PNFA. Our results are consistent with prior work suggesting these syndromes localize to distinct brain networks (Seeley et al., 2009; Zhou et al., 2012). There are multiple hypotheses as to why neuroimaging findings in neurodegenerative disease might localize to functionally connected brain networks, including prion-like spread of pathological protein through synaptic connections (Zhou et al., 2012), or that network dysfunction itself might contribute to neurodegeneration (Buckner et al., 2009; Zhou et al., 2012; Jones et al., 2016, 2017; Wiepert et al., 2017). An important caveat is that network localization corresponds to a patient’s clinical diagnosis, but not necessarily to the underlying neuropathology causing that clinical syndrome. Multiple different pathologies can cause the same clinical syndrome (e.g. tau and TDP-43 pathology causing the clinical syndrome of bvFTD), and a single pathology can affect several different networks, resulting in different clinical syndromes (e.g. Alzheimer’s disease pathology can be associated with the clinical syndrome of Alzheimer’s disease, but also CBS, posterior cortical atrophy, or logopenic primary progressive aphasia in different patients).
While the current study addressed heterogeneity in neuroimaging findings across different studies, there is also heterogeneity in neuroimaging findings across individual patients. Whether network localization can be used to explain this heterogeneity at the individual level remains unknown. Prior studies have found that individual-specific models of atrophy progression, based on diffusion-weighted connectivity, are better than disease-specific models in predicting longitudinal changes in atrophy progression in Alzheimer’s disease (Torok et al., 2018).
Imaging is also increasingly being used as a biomarker and secondary endpoint in therapeutic trials in dementia. Our results suggest that the sensitivity of these biomarkers may be increased if one looks for imaging changes within specific target networks rather than specific target regions. Further development of network localization of neuroimaging abnormalities in individual dementia patients may therefore be critical to the potential use of neuroimaging biomarkers in clinical trials.
Finally, an important contribution of the current paper is the finding that neuroimaging correlates of specific symptoms localize to specific brain networks. Despite extensive research suggesting that neurodegenerative syndromes localize to specific brain networks (Lehmann et al., 2013), there has been little to no evidence showing that specific symptoms within neurodegenerative disease localize to specific brain networks. As neuroimaging correlates of specific symptoms tend to be more variable across studies than neuroimaging correlates of specific diseases, this may prove particularly valuable.
Network localization of similar symptoms across aetiologies
An emerging theme in neurology and psychiatry is that specific symptoms may share a common neurobiological substrate independent of the underlying disease process (Insel et al., 2010). For example, lesions that cause hemichorea are connected to the same region in the basal ganglia that is thought to cause chorea in Huntington’s disease and chorea from hyperglycaemia (Laganiere et al., 2016). Here, we applied this same concept to identify a shared neuroanatomical substrate for delusions. Recently, we found that lesions causing delusions occurred in multiple different brain locations, but were all connected to a common location in the right frontal cortex (Darby and Fox, 2017; Darby et al., 2017). We now show that neuroimaging correlates of delusions in patients with Alzheimer’s disease occur in multiple different brain locations, but these locations are connected to the same neuroanatomic substrate in the right ventral cortex. This convergence suggests that not only is our technique useful in comparing neuroimaging correlates of specific symptoms across different studies, but that our method may be useful for comparing neuroimaging correlates of specific symptoms across different disease aetiologies.
Prior work has shown that the therapeutic efficacy of invasive and non-invasive brain stimulation targets in neurological and psychiatric diseases depends on that target’s connectivity to disease-related brain networks (Fox et al., 2012, 2014; Horn et al., 2017). Our current results show common network localization for neuroimaging findings within a disease, and for a specific neuropsychiatric symptom (delusions) across diseases. Symptom-specific brain networks derived using the current method can provide testable therapeutic targets for future brain stimulation trials.
Limitations
There are several limitations to our study. First, we focused on neuroimaging findings in Alzheimer’s disease and neurodegenerative disease, which may have a higher probability of localizing to a common brain network than neuroimaging findings in other diseases. Similarly, we applied our method to just a single symptom, delusions. Whether our method is equally useful for other diseases such as depression, or for other symptoms, remains to be tested. That said, we are optimistic that our method for network localization of neuroimaging findings will prove broadly applicable. First, many brain functions (Fox and Raichle, 2007), brain diseases (Fox and Greicius, 2010; Fornito et al., 2015), and symptoms (Fox and Greicius, 2010; Fornito et al., 2015) appear to localize better to specific networks than single brain regions. Diseases such as depression, which are known for highly heterogeneous neuroimaging findings, are now thought to localize to brain networks (Gong and He, 2015), and the current technique might be used to test these hypotheses. Similarly, there is good reason to believe that individual symptoms will localize to specific brain networks (Insel et al., 2010). This is perhaps most obvious for symptoms caused by focal brain lesions, in which an identical connectome-based approach to the one presented here for focal neuroimaging findings has proven broadly applicable (Boes et al., 2015; Fischer et al., 2016; Laganiere et al., 2016; Darby and Fox, 2017; Darby et al., 2017, 2018a; Fasano et al., 2017).
A second potential limitation is that we used a normative group level connectome to determine network localization of neuroimaging findings. The advantage of a normative connectome is that it is large (in this case, n = 1000), publicly available, and provides a standardized template for use across neuroimaging studies. However, it is possible that results could be improved by using a connectome better matched to the disease, gender, or average age of the patients that generated the original neuroimaging findings. That said, prior work from our group suggests that using age-matched or disease-matched connectomes makes little difference with respect to network localization (Fox et al., 2014; Boes et al., 2015; Horn et al., 2017).
Third, we used a limited set of statistical approaches to provide a simple, ‘proof of concept’ demonstration of network localization. More advanced statistical approaches similar to those used by coordinate-based meta-analysis techniques (Eickhoff et al., 2009; Yarkoni et al., 2011) and graph theory measures of network function (Bullmore et al., 2009) could be incorporated into our network localization approach in future studies. Similarly, individual studies selected for our meta-analyses differed in their power and statistical approach, leading to heterogeneity in which peaks were reported as significant. While this heterogeneity should bias us against finding reproducible network localization across studies, future work accounting for these sources of variance may further improve the current method.
Fourth, we found that heterogeneous neuroimaging findings across studies share connectivity to common brain regions, but this does not mean there are not important differences between studies. Indeed, the region of shared connectivity across all studies was small relative to the network derived from each individual study (Fig. 2 and Supplementary Fig. 4). This is expected as individual studies differ in neuroimaging modality, statistical approach, and clinical population including age, disease severity, and co-morbid symptoms. The current paper focused on what these studies share, but future work using network localization to better understand differences between studies may prove equally valuable.
Finally, the current results should not be used to minimize concerns regarding poor sample size, study design, and statistical analysis that limit reproducibility in neuroimaging studies (Carp, 2012; Button et al., 2013; Eklund et al., 2016; Poldrack et al., 2017). In the current study, we varied parameters to show that results were independent of methodological choices such as seed size, threshold, and statistical approach. Additionally, we used a single software package (SPM), FWE rather than FDR (false discovery rate) correction, and the default settings for FWE cluster-based correction within SPM in accordance with existing best practice recommendations (Poldrack et al., 2017). These choices reduce but don’t eliminate the risk of false positives (Eklund et al., 2016; Poldrack et al., 2017). Continued efforts to address these concerns in science in general (Open Science Collaboration, 2015), and neuroimaging in particular (Poldrack et al., 2017), will be critical to advance the field. The current study complements these initiatives by suggesting that challenging our assumptions regarding how findings should reproduce may also be valuable.
Abbreviations
- ALE
activation likelihood estimation
- bvFTD
behavioural variant frontotemporal dementia
- CBS
corticobasal syndrome
- PNFA
progressive non-fluent aphasia
Funding
Investigators were supported by funding from the Sidney R. Baer, Jr. Foundation (R.D., M.F.), the NIH (R01MH113929, K23NS083741 to M.F.), the Nancy Lurie Marks Foundation (M.F.), the Dystonia Medical Research Foundation (M.F.), the Alzheimer’s Association (R.D.), the BrightFocus Foundation (R.D.), The Vanderbilt Faculty Research Scholars Award (R.D.), Academy of Finland (#295580 to J.J.) and the Finnish Medical Foundation (J.J.).
Competing interests
The authors report no competing interests.

