


Abstract
Recent neuroimaging studies have demonstrated changes in brain function in cognitively normal subjects at increased risk of developing Alzheimer's disease. Amnestic mild cognitive impairment (AMCI) carries a high risk of developing into Alzheimer's disease. In AMCI altered cortical activation has been demonstrated during memory tasks, using functional MRI (fMRI). Memory and attention are closely related cognitive functions. It is unclear whether the memory impairment of AMCI is associated with attentional deficits of the sort likely to be revealed by tasks requiring divided attention. Ten older adults (mean age 72 years, range 57–81 years) with AMCI were compared with healthy matched controls on divided attention and passive sensory processing tasks using fMRI. During the divided attention task both groups activated similar regions of left hemispheric prefrontal and extrastriate visual cortex. However, the AMCI group had attenuated prefrontal activation compared with age matched controls. On the passive sensory processing task there was no difference between the AMCI and control groups. We conclude that there are changes in the functional network subserving divided attention in patients with AMCI as reflected in the attenuation of prefrontal cortical activation. These findings have implications for evaluating cognition in AMCI and also for monitoring the effects of future treatments in AMCI.
Introduction
Mild cognitive impairment (MCI) is necessarily heterogeneous since it may involve any of a number of cognitive domains (Dubois and Albert, 2004). MCI is a precursor for dementia of any aetiology. Alzheimer's disease is characterized by amnesia as an early feature with the gradual emergence of impairment in other cognitive domains (McKhann et al., 1984; Grady et al., 1988; Hodges and Patterson, 1995). Amnestic mild cognitive impairment (AMCI) denotes a subtype of MCI with an emphasis on episodic memory impairment that specifically represents a high risk state for developing Alzheimer's disease, with a 10–15% annual conversion rate to Alzheimer's disease, compared with 1–2% in the normal elderly population (Petersen et al., 1999, 2001). Evidence from functional MRI (fMRI) studies has revealed altered memory function prior to the clinical emergence of symptoms in subjects at increased risk of Alzheimer's disease (Smith et al., 1999; Bookheimer et al., 2000). Subjects at risk by virtue of family history of Alzheimer's disease (at least one first-degree relative with clinical Alzheimer's disease) and apolipoprotein E status (at least one apolipoprotein ε4 allele) had reduced activation in mid- and posterior inferotemporal areas during the recall of items from both working and long-term memory (Smith et al., 1999).
Whether AMCI is characterized solely by amnesia or whether the amnesia is accompanied by impairment of attention is uncertain. Data from patients with Alzheimer's disease suggest that attention is affected early in the disease and that the initial impairment in episodic memory is followed by impairment firstly of divided attention and subsequently of selective attention (Perry and Hodges, 1999).
Divided attention refers to the capacity simultaneously to direct attention towards multiple stimuli or tasks. In comparison with a single task or stimulus, divided attention is associated with an increased demand on cognitive processing which is reflected in reduced accuracy and/or processing speed [the latter measured as reaction time (RT) (Posner, 1978)]. Impairments in either divided attention or memory have reciprocal deleterious effects on each other (Sarter and Turchi, 2002). Impaired divided attention results in a breakdown of source monitoring leading to memory distortion (Johnson, 1997). While normally the effect of practice on divided attention tasks leads to automated parallel processing and reduced attentional load, memory impairment curtails this automation (Schneider and Shiffrin, 1977; Sarter and Turchi, 2002).
Divided attention has been associated with activation of prefrontal cortex, both in single (visual) modality tasks (Corbetta et al., 1991; D'Esposito et al., 1995) and in mixed (visual and somatosensory) modality tasks (Johannsen et al., 1997, 1999). More complex dual tasks requiring working memory and semantic processing engender activation in prefrontal cortex bilaterally (Koechlin et al., 1999; Iidaka et al., 2000). A recent fMRI study in healthy subjects showed activation of the left prefrontal cortex during a well-designed divided attention task, requiring concurrent processing of auditory tones and visual patterns (Loose et al., 2003).
Increasing cognitive demand in the face of failing capacity leads to attenuated activation of brain areas which subserve the capacity being assessed (Nestor et al., 1991; Goldberg et al., 1998). Divided attention compared with selective attention requires an increase in cognitive resource and may therefore provide a useful early probe of regional changes in cortical function in AMCI patients. Thus the premise of this study was that one of the early detectable deficits in AMCI is reduced divided attention, and that it would be possible to correlate this with fMRI changes. We examined changes on fMRI during a divided attention paradigm in patients with AMCI and in healthy controls. We also compared the AMCI patients with controls on passive auditory and visual processing tasks to examine any generalized non-specific effects of AMCI on fMRI signal. We hypothesized that: (i) healthy subjects will have activation of prefrontal cortex during divided attention; (ii) AMCI patients will have reduced activation of prefrontal cortex during divided attention when compared with healthy control subjects; and (iii) there will be no between-group differences evident within cortical regions associated with passive visual and auditory processing.
Methods
Subjects
Ten right-handed patients (five women, five men, mean age 72 years, range 57–81 years) diagnosed with AMCI were recruited from our memory clinic. AMCI was diagnosed using specific operational criteria (Petersen et al., 2001) which included: (i) memory complaint corroborated by an informant; (ii) abnormal memory function documented by impaired recall on the new learning subscale of the Cambridge Cognitive Examination (CAMCOG) (Roth et al., 1986); (iii) preserved general cognitive function based on a Clinical Dementia Rating Score ≤0.5 (Morris, 1993); (iv) intact activities of daily living; and (v) not meeting National Institute of Neurological and Communicative Disorders and Stroke/Alzheimer's Disease and Related Disorders Association criteria for Alzheimer's disease (McKhann et al., 1984). Patients with significant vascular risk factors as measured by a score of 4 or more on the modified Hachinski score (Hachinski et al., 1975) were excluded. All patients underwent a thorough psychiatric and physical examination and other causes of cognitive impairment were excluded.
Ten right-handed healthy control subjects (six women, four men) were recruited. They were matched for age (mean age 68 years, range 50–84) and educational attainment (AMCI mean 10.3 years, SD 1.8, range 9–15; controls mean 10.1 years, SD 1.4, range 9–12; F = 0.64, P < 0.8) and had no evidence of cognitive impairment. All subjects completed a neuropsychological test battery, including the CAMCOG and the Mini-Mental State Examination (MMSE) (Folstein et al., 1975).
Participants completed a single fMRI scanning session at the Maudsley Hospital, London, UK, lasting approximately 1 hour. This session involved a passive visual and auditory processing paradigm, a divided attention paradigm and a series of high-resolution MRI scans, followed by a post-scan debriefing.
The study was approved by the West Essex Local Research Ethics Committee and all subjects provided written informed consent.
Experimental design
Divided attention paradigm
The paradigm consisted of 10 blocks with five divided attention blocks alternating with five comparison blocks. Each block comprised 16 pairs of stimuli. Subjects were familiarized with the task outside the scanner and reminded of instructions immediately prior to commencing scanning. Instructions were identical for both types of block. Subjects were instructed to press a button with their right index finger whenever they saw the target letter ‘q’ or heard the target number ‘8’. The auditory–digit component consisted of the digits 0 to 9 read aloud in a pseudorandom order by an unfamiliar male voice. The visual–letter component comprised discrete lower case letters (a, b, i, l, m, q, r, s, u, w, z) presented in a pseudorandom order. During the divided attention task subjects were simultaneously presented with visual (letters) and auditory (spoken digits) stimuli with an interstimulus interval of 1.75 s. Each divided attention block contained three auditory and three visual targets. The comparison attention (cA) task was designed to match the auditory, visual and motor aspects of the divided attention task and contained five targets per block. Subjects were presented with identical auditory and visual stimuli, in a repeating sequence, with a target cue every third stimulus (008008008…). In order to minimize habituation, subjects were not warned of a switch from the divided attention to cA condition and the block length differed from that used in training sessions. The RT and accuracy of each response were recorded for all stimuli.
Visual and auditory processing paradigm (vis–aud)
This paradigm consisted of visual and auditory stimuli presented in alternating ON and OFF epochs. The visual stimulus consisted of a square black and white chequerboard pattern that filled up the entire screen. The squares were reversed at three distinct frequencies (2, 4, 8 Hz) for fixed epochs of 16 s alternating with 16 s of cross-hair fixation (OFF). The order of reversal frequencies was randomized within each set of three consecutive stimulation–fixation cycles. The auditory stimulus consisted of a male voice reading a list of nouns presented at three randomized word rates (30, 60, 90 words/min) for fixed epochs of 24 s, alternating with 24 s of silence (OFF). The visual and auditory stimuli were presented asynchronously from each other over the 280 s duration of the entire paradigm.
Stimuli presentation
Auditory stimuli were presented via MRI-compatible air-conducting headphones and visual stimuli were back-projected with an LCD projector (Proxima Desktop Projector 5500) on to a screen 2.5 m from the subject's head and were visible to the subject via a prism mounted on the head coil. The paradigms were programmed in Microsoft Visual Basic Professional 6.0 and presented on a PC running MS Windows NT.
Image acquisition
Gradient echo echoplanar imaging (EPI) data were acquired on a neuro-optimized GE Signa 1.5 Tesla system (General Electric, Milwaukee WI, USA) at the Maudsley Hospital, London. Consistent image quality was ensured by a semiautomated quality control procedure. A quadrature birdcage headcoil was used for radio frequency transmission and reception. One hundred and forty-four T2*-weighted whole-brain volumes depicting blood oxygen level-dependent contrast were acquired during the divided attention paradigm at each of 16 near-axial non-contiguous planes parallel to the intercommissural line (slice thickness = 7 mm; gap = 0.7 mm; TR = 2.0 s; echo time = 40 ms; flip angle = 70°; matrix = 64 × 64). Functional data collected during the vis–aud paradigm had the same scan parameters with 140 T2*-weighted blood oxygenation level-dependent (BOLD) depicting images collected. At the same time, a high-resolution gradient echo image of the whole brain was acquired in the intercommissural plane consisting of 43 slices (slice thickness = 3 mm; gap = 0.3 mm; TR = 3 s; flip angle = 90°; matrix = 128 × 128). This EPI data set provided almost complete brain coverage.
Individual analysis
The data were first realigned (Bullmore et al., 1999a) to minimize motion-related artefacts and smoothed using a Gaussian filter (full width half maximum 5 mm). Responses to the experimental paradigms were then detected by time-series analysis using gamma variate functions (peak responses at 4 and 8 s) to model the BOLD response. The analysis was implemented as follows. First, each experimental condition was convoluted separately with the 4 and 8 s Poisson functions to yield two models of the expected haemodynamic response to that condition. The weighted sum of these two convolutions that gave the best fit to the time series at each voxel was then computed. This weighted sum effectively allows voxel-wise variability in time to peak haemodynamic response. In order to constrain the possible range of fits of physiologically plausible BOLD responses, a constrained fitting procedure (Friman et al., 2003) was used. Following this fitting operation, a goodness of fit statistic was computed at each voxel. This was the ratio of the sum of squares of deviations from the mean intensity value due to the model (fitted time series) divided by the sum of squares due to the residuals (original time series minus model time series). This statistic is called the SSQratio. The percentage change in the BOLD signal at each voxel was also calculated. This was [(fitmax − fitmin)/mean signal intensity] × 100, where fitmax and fitmin were the maximum and minimum values of the fitted response for the time series in question.
In order to sample the distribution of SSQratio under the null hypothesis that observed values of SSQratio were not determined by experimental design (with minimal assumptions), the time series at each voxel was permuted using a wavelet-based resampling method (Bullmore et al., 2001; Breakspear et al., 2003). This process was repeated 20 times at each voxel and the data were combined over all voxels, resulting in 20 permuted parametric maps of SSQratio at each plane for each subject. The same permutation strategy was applied at each voxel to preserve spatial correlational structure in the data during randomization. Combining the randomized data over all voxels yields the distribution of SSQratio under the null hypothesis. A test that any given voxel is activated at any required type I error can then be carried out by obtaining the appropriate critical value of SSQratio from the null distribution. For example, SSQratio values in the observed data lying above the 99th percentile of the null distribution have a probability under the null hypothesis of ≤0.01. This permutation method gives very good type I error control with minimal distributional assumptions (Bullmore et al., 2001; Breakspear et al., 2003).
Group mapping
In order to extend inference to the group level, the observed and randomized SSQratio maps were transformed into standard space by a two-stage process involving first a rigid body transformation of the fMRI data into a high-resolution gradient echo image of the same subject followed by an affine transformation on to a Talairach template (Brammer et al., 1997). By applying the two spatial transformations computed above for each subject to the statistic maps obtained by analysing the observed and wavelet-randomized data, a generic brain activation map could be produced for each experimental condition. The median observed SSQratio over all subjects at each voxel (median values were used to minimize outlier effects) can then be tested at each intracerebral voxel in standard space (Talairach and Tournoux, 1988) against a critical value of the permutation distribution for median SSQratio ascertained from the spatially transformed wavelet-permuted data (Brammer et al., 1997). In order to increase sensitivity and reduce the multiple comparison problem encountered in fMRI, hypothesis testing was carried out at the cluster level using a method shown to give excellent cluster-wise type I error control in fMRI analysis (Bullmore et al., 1999b). When applied to fMRI data, this method estimates the probability of occurrence of clusters under the null hypothesis using the distribution of median SSQratio computed from spatially transformed data obtained from wavelet permutation of the time series at each voxel (see above). Image-wise expectation of the number of false positive clusters under the null hypothesis is set for each analysis at <1. Consequently correction for multiple comparisons was not required, as thresholds were set on an image-wide basis, not a voxelwise basis.
Group differences
Analysis of variance was carried out on the SSQratio maps in standard space by first computing the difference in median SSQratio between groups at each voxel. Subsequent inference of the probability of this difference under the null hypothesis was made by reference to the null distribution obtained by repeated random permutation of group membership and recomputation of the difference in median SSQratios between the two groups obtained from the resampling process. As with the generic brain activation map, cluster-level maps were then obtained with the cluster-wise probability equivalent to less than one false positive cluster per image.
Neurocognitive and behavioural data analysis
Groups were compared on global, new-learning (episodic memory) and attention scores derived from the neurocognitive test battery. Behavioural data from the divided attention paradigm were compared between groups using measures of divided attention-RT, cA-RT, visual stimuli-RT and auditory-RT. Discrimination indices were employed as measures of recognition accuracy and calculated as: hit rate (targets correctly identified/total targets) minus false alarm rate (false alarms/non-targets). Between-group comparisons were determined by analyses of variance (ANOVA) with probability of type 1 error set at P < 0.05. For within-group comparisons of RT and accuracy a one-sample t-test was employed. All statistics were performed using SPSS 10.0 for Windows.
Results
Neurocognitive testing
The AMCI group had lower total CAMCOG, MMSE, new learning and attention scores than the control group (Table 1).
Sociodemographic data, neuropsychological test data, reaction times and recognition accuracy for control and AMCI groups
| Controls | AMCI | Test statistic (F) | P | |||||
|---|---|---|---|---|---|---|---|---|
| Sociodemographic | ||||||||
| Age | 68 (13.5) | 72 (7.7) | 0.696 | ns | ||||
| Years in education | 10.1 (1.4) | 10.3 (1.8) | 0.064 | ns | ||||
| Neuropsychological tests | ||||||||
| CAMCOG (total = 107) | 100 (4.7) | 86 (5.8) | 52.50 | <0.001 | ||||
| MMSE (total = 30) | 28.3 (1.6) | 24.5 (1.5) | 57.06 | <0.001 | ||||
| New learning (total = 17) | 14.2 (0.9) | 7.7 (1.2) | 30.68 | <0.001 | ||||
| Attention (total = 9) | 8.8 (0.4) | 8.0 (0.9) | 5.10 | <0.04 | ||||
| Reaction time (s) | ||||||||
| Divided attention | 0.64 (0.1) | 0.68 (0.1) | 4.473 | <0.05 | ||||
| Comparison attention | 0.40 (0.1) | 0.43 (0.1) | 0.720 | ns | ||||
| Visual target | 0.50 (0.2) | 0.61 (0.2) | 1.340 | ns | ||||
| Auditory target | 0.70 (0.2) | 0.78 (0.2) | 1.118 | ns | ||||
| Recognition accuracy | ||||||||
| All stimuli | 0.95 (0.1) | 0.93 (0.1) | 0.79 | ns | ||||
| Divided attention | 0.92 (0.1) | 0.88 (0.1) | 0.78 | ns | ||||
| Comparison attention | 0.99 (0.0) | 0.98 (0.0) | 0.63 | ns | ||||
Data are mean (SD). CAMCOG = Cambridge Cognitive Examination; MMSE = Mini-Mental State Examination. Statistical test: ANOVA. Recognition accuracy was measured using discrimination indices and calculated as: hit rate – false alarm rate. ns = not significant.
Behavioural measures on divided attention paradigm
Between-group comparisons revealed equivalent recognition accuracy on both attentional tasks (divided attention and cA) and RT to stimuli in both sensory modalities, visual and auditory. The AMCI group had significantly longer divided attention-RT compared with controls but there was no difference in cA-RT between the two groups (Table 1). Within-group comparisons showed both groups having longer RT and decreased recognition accuracy during the divided attention compared with cA tasks.
Functional measures: divided attention task
Both groups had significant activation in similar left prefrontal regions extending through the inferior frontal gyrus [Brodmann area (BA) 44/45], dorsolateral prefrontal cortex (BA46), insula (BA71) and bilateral extrastriate cortex (BA19) (Table 2; Fig. 1). Comparison between the groups (ANOVA) revealed an area of significantly attenuated activation within the left prefrontal region (BA44/45) in patients with AMCI (Table 2). Further investigation using an analysis of covariance procedure (ANCOVA) with divided attention-RT as the covariate revealed that this regional difference remained significant. Thus, it could not be accounted for by the slower performance of the AMCI group. We also performed ANCOVA with age as covariate and the difference in the left prefrontal area remained highly significant but with a reduction in cluster size from 74 voxels to 65.
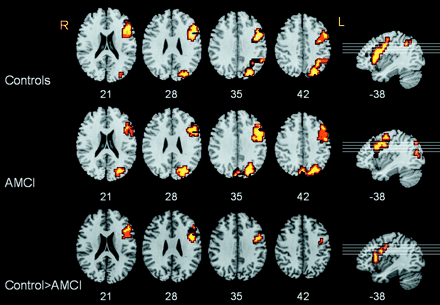
Divided attention task. Group maps depicting areas of significant increase in BOLD signal during the divided attention task for the control group (top) and AMCI group (middle). Both control and AMCI groups activate similar regions in left prefrontal and primary visual cortex. (Bottom) ANOVA (controls > AMCI) indicates a significantly larger activation in the left prefrontal cortex in the control group. The left hemisphere appears to the right of the page. Z-coordinates appear below each axial slice and x-coordinates below each sagittal slice. Lines on sagittal slices correspond to the orientation of the axial slices.
Divided attention
| Cerebral region | L/R | BA | Talairach coordinates (mm) | Cluster size (voxels) | ||||||||
|---|---|---|---|---|---|---|---|---|---|---|---|---|
| x | y | z | ||||||||||
| Controls | ||||||||||||
| Inferior frontal gyrus | L | 44/45 | −39 | 11 | 20 | 212 | ||||||
| Primary visual cortex | L | 19 | −25 | −74 | 26 | 121 | ||||||
| AMCI | ||||||||||||
| Inferior frontal gyrus | L | 44 | −40 | 15 | 31 | 176 | ||||||
| Primary visual cortex | L | 19 | −22 | −74 | 26 | 196 | ||||||
| Controls > AMCI | ||||||||||||
| Inferior frontal gyrus | L | 44 | −40 | 7 | 26 | 74 | ||||||
Location of maximally activated voxel in, and size of, each cluster activated on group maps for control group, AMCI group and ANOVA (Controls > AMCI). Both groups activated similar regions in left prefrontal and primary visual cortex. ANOVA revealed an area of significantly larger activation in the control group, located in the inferior frontal gyrus. The clusterwise probability of type 1 error predicts less than one false positive cluster per map. L = left hemisphere; R = right hemisphere; BA = approximate Brodmann area.
Functional MRI: visual and auditory processing tasks
Both groups had activation within similar regions of the striate (BA17) and extrastriate association cortex (BA18, 19) in response to the visual processing task and there were no significant differences in activation between the groups (Table 3). Likewise, in the auditory processing task both groups activated bilateral temporal gyri including primary (BA41, 42) and secondary auditory cortex (BA21, 22), with no significant between-group differences (Table 3).
Visual and auditory sensory activation
| Task | Cerebral region | L/R | BA | Talairach coordinates (mm) | Cluster size (voxels) | ||||||||
|---|---|---|---|---|---|---|---|---|---|---|---|---|---|
| x | y | z | |||||||||||
| Visual | Primary visual cortex | ||||||||||||
| Controls | R | 18 | 25 | −85 | −2 | 578 | |||||||
| AMCI | R | 18 | 14 | −85 | −13 | 666 | |||||||
| Auditory | Left middle temporal gyrus | ||||||||||||
| Controls | L | 21 | −57 | −18 | −7 | 383 | |||||||
| AMCI | L | 21 | −54 | −19 | −2 | 237 | |||||||
| Right middle temporal gyrus | |||||||||||||
| Controls | R | 21 | 47 | −18 | −7 | 235 | |||||||
| AMCI | R | 21 | 54 | −19 | −7 | 237 | |||||||
Location of maximally activated voxel in, and size of, each cluster activated on group maps for control and AMCI groups. On the visual task both groups activated similar areas in primary visual cortex with no significant differences between groups on ANOVA. Both groups activated similar regions bilaterally in middle temporal gyri on the auditory task, with no significant differences between groups on ANOVA. The clusterwise probability of type 1 error predicts less than one false positive cluster per map. L = left hemisphere; R = right hemisphere; BA = approximate Brodmann area.
Discussion
In this study we confirmed that AMCI patients have a clear deficit in divided attention on cognitive testing. We were able further to show that this deficit correlates with attenuated activation in the left prefrontal region on fMRI.
Neuropsychological testing
The AMCI group was selected on the basis of their episodic memory impairment. However, the AMCI group also scored significantly lower on the attention subscale of the CAMCOG compared with controls. This does suggest that AMCI involves impaired attention as well as memory, although the attention capabilities of both groups were well above the population mean for normal elderly (6.91 on the CAMCOG attention subscale), and all individual scores (AMCI range, 6–9; control range, 8–9) lay within one standard deviation (2.14) of the population mean (Huppert et al., 1995). Therefore none of the AMCI cases assessed individually would be considered as having impaired attention based on their performance on the CAMCOG. Identifying the presence of impairments in non-memory cognitive domains in MCI depends on the sensitivity of the measures used and is important because some measures, including mental speed, executive function, auditory attention span and category fluency, have been shown to be indicators of subsequent conversion to dementia (Nestor et al., 2004). Other investigators have also reported clinically evident impairment in attention in MCI (Bozoki et al., 2001; Perry and Hodges, 2003; Grundman et al., 2004). A recent study compared healthy elderly controls, MCI and AD patients and found impaired sustained attention in MCI that could not be elicited by standard neuropsychological tests (Levinoff et al., 2004). Using the Wechsler Adult Intelligence Scale (WAIS) forward digit span (a test for sustained selective attention and memory) and a 2 SD cut-off, Bozoki and colleagues reported that 29% of AMCI patients who converted to AD over 2 years had impaired attention at initial presentation when analysed retrospectively (Bozoki et al., 2001). Perry and Hodges reported impaired top-down attentional control in a carefully selected group of MCI patients who were only impaired on episodic memory tests (Perry and Hodges, 2003). Attentional impairment appears to be present in a high proportion of patients with MCI and AMCI if tested with appropriately sensitive measures, and it may prove to be the rule rather than the exception.
Behavioural measures: reaction time and recognition accuracy
All subjects found the divided attention task more demanding than the cA task, as evidenced by an increased RT and lower accuracy. A decrement in performance when more than one stimulus has to be attended to is to be expected and this has been observed by others (Klingberg, 1998; Loose et al., 2003). The AMCI group had significantly longer RT on the divided attention task compared with controls. However, the groups did not differ on recognition accuracy during the divided attention or cA tasks, indicating compliance and ability to complete the task. Similarly, the groups were comparable on visual and auditory RT, indicating that the observed difference was not due to slowed processing in a specific sensory modality. Interestingly, both groups took longer to respond to auditory, compared with visual stimuli, during the divided attention paradigm. The likely reason for this is that the visual stimuli have all the information necessary for identification presented instantly, but the auditory stimuli have to be evaluated for a longer duration before they can be identified.
Visual and auditory paradigm
This task was included to control for the possible confounding effects of sensory impairment that occurs increasingly in old age. Because the divided attention paradigm involved both attention to sensory stimuli (visual and auditory) and responding to targets, we wanted to establish whether the groups were equivalent in their ability to generate BOLD signal in sensory processing areas when required to attend to, but not respond to, stimuli. The results suggest no difference between patients and control subjects during passive visual and auditory processing. Therefore, any differences during the divided attention task are independent of any basic sensory processing deficit. In a previous MRI study of memory, a passive sensory task was included to assess potential differences in sensory processing between experimental groups (Machulda et al., 2003). A somatosensory (light touch) task was performed and no significant differences were found between healthy elderly controls, MCI patients and Alzheimer's disease patients. The vis–aud paradigm in our study was tailored to the sensory modalities necessary for our divided attention paradigm. We conclude that any attenuation in activation observed in the AMCI group on the divided attention task is not related to a non-specific disease-related phenomenon; it appears to be specific for the attentional domain.
Divided attention: comparison with studies in normal subjects
Prefrontal activation
Both patients and controls demonstrated significant activation of the left prefrontal cortex during the divided attention task. This is consistent with the result of a similar fMRI divided attention study, employing visual and auditory stimuli, in healthy young subjects (Loose et al., 2003). Their divided attention task was based on successive presentation of identical frequency tones, which may make greater demands on working memory. Other studies requiring older participants to monitor visual and somatosensory modalities (Johannsen et al., 1997) have reported right hemispheric prefrontal and parietal activation. Differences in results between studies may be due to the presentation of stimuli in different sensory modalities, or may be related to methodology. In the latter study, targets were expected but not presented; participants were not required to respond to targets and therefore there was no response inhibition processing and there was no measure of RT and accuracy.
Bilateral prefrontal activation has been reported on more complex dual tasks requiring working memory and semantic processing (Koechlin et al., 1999; Iidaka et al., 2000). The attentional network recruited for each individual task depends both on the sensory modality (Johannsen et al., 1997) and on the specific features of stimuli (Corbetta et al., 1991, 1995; Johannsen et al., 1999).
The left prefrontal cortex has been associated with relevant executive functioning tasks including response inhibition (Jonides et al., 1998a, b; D'Esposito et al., 1999; Leung et al., 2000), cognitive set-shifting (Konishi et al., 1998; Petersen et al., 1999), memory encoding, retrieval and working memory (Tulving et al., 1996; Johnson et al., 2003; Floel et al., 2004) and organization of information (Fletcher et al., 1998a, b). The divided attention paradigm was designed to minimize the contribution of these functions.
Extrastriate visual cortex activation
During the divided attention task both groups showed activation within the extrastriate visual cortex, not evident during the cA task. Functional neuroimaging studies have demonstrated activation in discrete regions of extrastriate cortex during visual processing (Corbetta et al., 1991; Heinze et al., 1994; Mangun et al., 1997). Evidence from functional imaging and behavioural studies in normal subjects indicates the presence of segregated neural substrates for recognizing letters and digits (Polk and Farah, 1998). We propose that the extrastriate activation in the present study is the result of the additional letter processing required during the divided attention task. No between-group differences were evident in this extrastriate area, suggesting equivalent load and processing of visual stimuli.
Divided attention: comparison with studies in Alzheimer's disease
Our findings of attenuated prefrontal activation and increased RT during a divided attention task in AMCI are in line with other neuropsychological studies showing impairments in dual task performance, and are in accordance with functional imaging studies showing attenuated prefrontal activation during divided attention tasks in Alzheimer's disease. Reporting on a PET study comparing Alzheimer's disease patients with healthy elderly on a divided attention task in visual and somatosensory modalities, Johannesen and colleagues found attenuated right prefrontal activation and slower RTs during the dual task condition (Johannsen et al., 1999). Moreover, a PET study of divided attention, which compared healthy elderly people with patients with mild Alzheimer's disease, reported that slowing on RT during the dual-task condition (but not the single-task condition) correlated with reduction in brain metabolism in right prefrontal and parietal areas in the Alzheimer's disease patients but not in the controls (Nestor et al., 1991).
With fMRI studies, group processing speed differences can potentially confound results of activation differences between groups. This stems from the characteristics of the BOLD response, which evolves temporally, and peaks between 5 and 8 s after a stimulus. It is therefore possible for the time point where the BOLD signal is measured on slower trials to fall outside the period of peak activation. To address this potential confounding effect, we covaried for divided attention-RT on ANCOVA, and the difference in activation between the groups remained. Furthermore, an fMRI study that specifically looked at the relationship between processing speed and cortical activation in healthy adults using a verbal memory task found a strong positive correlation between increased RT and activation in bilateral parietal regions, but no correlation with activation in frontal areas or on the control task (Honey et al., 2000). They concluded that subjects who found the task more difficult activated task-specific regions more powerfully. We therefore conclude that the increased RT in the AMCI group is not per se responsible for the attenuated prefrontal activation on the divided attention task.
It is well established that divided attention is impaired in subjects of advanced age and to control for this we included an ANCOVA with age as a covariate. This also revealed a significant difference in the same left prefrontal area between the groups but the size of the differing cluster was reduced by 12%. Therefore, while advancing age makes a small difference to activation, the major contribution to the observed between-group difference is attributable to divided attention processing.
It has been proposed that disruption of two neural systems may underlie the attentional deficits in Alzheimer's disease (Perry and Hodges, 1999). The first is the basal forebrain cholinergic system, which provides the main cholinergic input to the neocortical areas involved in attention, especially the prefrontal and parietal cortex, and to the thalamus (Mesulam and Geula, 1988). This basal forebrain system includes the nucleus basalis of Meynert, which is one of the areas prominently affected by neuropathology in Alzheimer's disease (Arnold et al., 1991). The presence of neurofibrillary tangles and pre-tangle cytopathology in autopsied MCI patients has been documented recently, with pre-mortem measures of cognitive impairment being significantly correlated with the percentage of neurones affected (Mesulam, 2004). The second neural system which may be relevant to the attentional dysfunction is the corticocortical pathways, such as the longitudinal fasciculi, which connect frontal and parietal cortices. It has been shown that neocortical synapse densities in frontal and parietal cortices are highly correlated with dementia severity (Samuel et al., 1994) and that Alzheimer's disease neuropathology is present early in the neocortex in very mild Alzheimer's disease (Morris et al., 1991). Autopsy studies in MCI found early neuropathological changes of Alzheimer's disease (Price and Morris, 1999). A longitudinal study which followed MCI patients (up to 9.5 years) reported that 100% progressed to Alzheimer's disease and 84% had neuropathological changes of Alzheimer's disease at autopsy (Morris et al., 2001). In conclusion, there are grounds for considering that attenuated prefrontal activation and decreased processing speed in AMCI during divided attention may be secondary to underlying Alzheimer's disease pathology, and that prefrontal cortical activation during a divided attention task could be used as an early marker for AMCI and as a means of assessing the effects of symptomatic medication.
Limitations
The cA condition was not a selective attention task and we cannot exclude the possibility that there is also a selective attention deficit which contributes to the observed differences. We selected the control condition to generate maximum contrast with the divided attention condition by matching the components of the dual task as described by Pashler and colleagues (perceptual analysis, response selection and response production/motor stages) (Pashler, 1999). In order to concentrate on the divided attention aspect, the control condition required identical response selection (identifying targets) and identical response production (pressing a button) to the test condition. Both conditions required the same kinds of sensory input. The main difference between the conditions was the requirement of divided attention. However, the use of pseudorandom targets in one modality might have matched the conditions more closely.
Differences in activation between individuals are more marked in elderly patients because of variable atrophy, and more in the way of missed localization can result in failure to detect significant activations at group level (Vandenbroucke et al., 2004). It is therefore encouraging that we were able to observe significant group activations in our study. More sophisticated registration methods may contribute in the future.
We acknowledge an unrestricted research donation from Novartis Pharmaceuticals. S.S.S. was supported by a Wellcome Trust advanced clinical training fellowship and M.S. by a NARSAD Young Investigator Award. We are grateful to the patients and volunteers who participated in this study. We would like to thank Claire Sweetman for her clinical support, Chris Andrews and Fernando Zelaya for their technical support, Professor Mick Brammer and Vincent Giampetro for advice on statistical analysis, Dr Rodney Walker for substantial comments on the manuscript, and the MRI unit staff at the Maudsley Hospital, London, for their assistance.
References
Arnold SE, Hyman BT, Flory J, Damasio AR, Van Hoesen GW. The topographical and neuroanatomical distribution of neurofibrillary tangles and neuritic plaques in the cerebral cortex of patients with Alzheimer's disease.
Bookheimer SY, Strojwas MH, Cohen MS, Saunders AM, Pericak-Vance MA, Mazziotta JC, et al. Patterns of brain activation in people at risk for Alzheimer's disease.
Bozoki A, Giordani B, Heidebrink JL, Berent S, Foster NL. Mild cognitive impairments predict dementia in nondemented elderly patients with memory loss.
Brammer MJ, Bullmore ET, Simmons A, Williams SC, Grasby PM, Howard RJ, et al. Generic brain activation mapping in functional magnetic resonance imaging: a nonparametric approach.
Breakspear M, Brammer M, Robinson P. Construction of multivariate surrogate sets from nonlinear data using the wavelet transform.
Bullmore ET, Brammer MJ, Rabe-Hesketh S, Curtis VA, Morris RG, Williams SC. Methods for diagnosis and treatment of stimulus-correlated motion in generic brain activation studies using fMRI.
Bullmore ET, Suckling J, Overmeyer S, Rabe-Hesketh S, Taylor E, Brammer MJ. Global, voxel, and cluster tests, by theory and permutation, for a difference between two groups of structural MR images of the brain.
Bullmore E, Long C, Suckling J, Fadili MJ, Calvert G, Zelaya F, et al. Colored noise and computational inference in neurophysiological (fMRI) time series analysis: resampling methods in time and wavelet domains.
Corbetta M, Miezin FM, Dobmeyer S, Shulman GL, Petersen SE. Selective and divided attention during visual discriminations of shape, color, and speed: functional anatomy by positron emission tomography.
Corbetta M, Shulman GL, Miezin FM, Petersen SE. Superior parietal cortex activation during spatial attention shifts and visual feature conjunction.
D'Esposito M, Detre JA, Alsop DC, Shin RK, Atlas S, Grossman M. The neural basis of the central executive system of working memory.
D'Esposito M, Postle BR, Jonides J, Smith EE. The neural substrate and temporal dynamics of interference effects in working memory as revealed by event-related functional MRI.
Fletcher PC, Shallice T, Dolan RJ. The functional roles of prefrontal cortex in episodic memory. I. Encoding.
Fletcher PC, Shallice T, Frith CD, Frackowiak RS, Dolan RJ. The functional roles of prefrontal cortex in episodic memory. II. Retrieval.
Floel A, Poeppel D, Buffalo EA, Brann A, Gia CW-M, Seo M-J, et al. Prefrontal cortex asymmetry for memory encoding of words and abstract shapes.
Folstein MF, Folstein SE, McHugh PR. ‘Mini-Mental State’ A practical method for grading the cognitive state of patients for the clinician.
Friman O, Borga M, Lundberg P, Knutsson H. Adaptive analysis of fMRI data.
Goldberg TE, Berman KF, Fleming K, Osterm J, Van Morn JD, Esposito G, et al. Uncoupling cognitive workload and prefrontal cortical physiology: a PET rCBF study.
Grady CL, Haxby JV, Horwitz B, Horwitz L, Meston, H, Schapiro RP, et al. Longitudinal study of the early neuropsychological and cerebral metabolic changes in dementia of the Alzheimer type.
Grundman M, Petersen RC, Ferris SH, Thomas RG, Aisen PS, Bennett DA, et al. Mild cognitive impairment can be distinguished from alzheimer disease and normal aging for clinical trials.
Hachinski VC, Iliff LD, Zilhka E, Du Boulay GH, McAllister V, Marshall J, et al. Cerebral blood flow in dementia.
Heinze HJ, Mangun GR, Burchert W, Hinrichs H, Scholz M, Munte TF, et al. Combined spatial and temporal imaging of brain activity during visual selective attention in humans.
Hodges JR, Patterson K. Is semantic memory consistently impaired early in the course of Alzheimer's disease? Neuroanatomical and diagnostic implications.
Honey GD, Bullmore ET, Sharma T. Prolonged reaction time to a verbal working memory task predicts increased power of posterior parietal cortical activation.
Huppert FA, Brayne C, Gill C, Paykel ES, Beardsall L. CAMCOG—a concise neuropsychological test to assist dementia diagnosis: socio-demographic determinants in an elderly population sample.
Iidaka T, Anderson ND, Kapur S, Cabeza R, Craik FI. The effect of divided attention on encoding and retrieval in episodic memory revealed by positron emission tomography.
Johannsen P, Jakobsen J, Bruhn P, Hansen SB, Gee A, Stodkilde-Jorgensen H, et al. Cortical sites of sustained and divided attention in normal elderly humans.
Johannsen P, Jakobsen J, Bruhn P, Gjedde A. Cortical responses to sustained and divided attention in Alzheimer's disease.
Johnson MK. Source monitoring and memory distortion.
Johnson MK, Raye CL, Mitchell KJ, Greene EJ, Anderson AW. FMRI evidence for an organization of prefrontal cortex by both type of process and type of information.
Jonides J, Schumacher EH, Smith EE, Koeppe RA, Awh E, Reuter-Lorenz PA, et al. The role of parietal cortex in verbal working memory.
Jonides J, Smith EE, Marshuetz C, Koeppe RA, Awh E, Reuter-Lorenz PA. Inhibition in verbal working memory revealed by brain activation.
Klingberg T. Concurrent performance of two working memory tasks: potential mechanisms of interference.
Koechlin E, Basso G, Pietrini P, Panzer S, Grafman J. The role of the anterior prefrontal cortex in human cognition.
Konishi S, Nakajima K, Uchida I, et al. Transient activation of inferior prefrontal cortex during cognitive set shifting.
Leung HC, Skudlarski P, Gatenby JC, Peterson BS, Gore JC. An event-related functional MRI study of the Stroop color word interference task.
Levinoff EJ, Saumier D, and Chertkow H. Focussed attention deficits in patients with Alzheimer's disease and mild cognitive impairment. Brain Cogn
Loose R, Kaufmann C, Auer DP, Lange KW. Human prefrontal and sensory cortical activity during divided attention tasks.
Machulda MM, Ward HA, Borowski B, Gunter JL, Cha RM, O'Brien PC, et al. Comparison of memory fMRI response among normal, MCI, and Alzheimer's patients.
Mangun GR, Hopfinger JB, Kussmaul C, Fletcher E, Heinze HJ. Covariations in ERP and PET measures of spatial selective attention in human extrastriate visual cortex.
McKhann G, Drachman D, Folstein MF, Katzman R, Price D, Standlan EM. Clinical diagnosis of Alzheimer's disease: Report of the NINCDS-ADRDA Work Group under the auspices of the Department of Health and Human Services Task Force on Alzheimer's disease.
Mesulam MM. The cholinergic innervation of the human cerebral cortex.
Mesulam MM, Geula C. Acetylcholinesterase-rich pyramidal neurons in the human neocortex and hippocampus: absence at birth, development during the life span, and dissolution in Alzheimer's disease.
Morris JC. The Clinical Dementia Rating (CDR): current version and scoring rules.
Morris JC, McKeel DW Jr, Storandt M, Rubin EM, Price JL, Grant EA, et al. Very mild Alzheimer's disease: informant-based clinical, psychometric, and pathologic distinction from normal aging.
Morris JC, Storandt M, Miller JP, McKeel DW Jr, Price JL, Rubin EM, et al. Mild cognitive impairment represents early-stage Alzheimer disease.
Nestor PG, Parasuraman R, Haxby JV, Grady CL. Divided attention and metabolic brain dysfunction in mild dementia of the Alzheimer's type.
Nestor PJ, Scheltens P, Hodges JR. Advances in the early detection of Alzheimer's disease.
Perry RJ, Hodges JR. Attention and executive deficits in Alzheimer's disease. A critical review.
Perry RJ, Hodges JR. Dissociation between top-down attentional control and the time course of visual attention as measured by attentional dwell time in patients with mild cognitive impairment.
Petersen RC, Smith GE, Waring SC, Ivnik RJ, Tangalos EG, Kokmen E. Mild cognitive impairment: clinical characterization and outcome.
Petersen RC, Doody R, Kurz A, Mohs R, Morris JC, Rabins PV, et al. Current concepts in mild cognitive impairment.
Polk TA, Farah MJ. The neural development and organization of letter recognition: evidence from functional neuroimaging, computational modeling, and behavioral studies.
Price JL, Morris JC. Tangles and plaques in nondemented aging and ‘preclinical’ Alzheimer's disease.
Roth M, Tym E, Mountjoy CQ, et al. CAMDEX: A standardised instrument for the diagnosis of mental disorders in the elderly with special reference to the early detection of dementia.
Samuel W, Terry RD, DeTeresa R, Butters N, Masliah E. Clinical correlates of cortical and nucleus basalis pathology in Alzheimer dementia.
Sarter M, Turchi J. Age- and dementia-associated impairments in divided attention: psychological constructs, animal models, and underlying neuronal mechanisms.
Schneider W, Shiffrin RM. Controlled and automatic human information processing: I. Detection, search, and attention.
Smith CD, Andersen AH, Kryscio RJ, Schmitt FA, Kindy MS, Blonder LX, et al. Altered brain activation in cognitively intact individuals at high risk for Alzheimer's disease.
Talairach J, Tournoux P. Co-planar stereotaxic atlas of the human brain. Stuttgart: Georg Thieme;
Tulving E, Markowitsch HJ, Craik FE, Habib R, Houle S. Novelty and familiarity activations in PET studies of memory encoding and retrieval.
Author notes
1Institute of Psychiatry, King's College London, 2University College London and Royal Free Hospitals, 3Wellcome Department of Imaging Sciences, Institute of Neurology, University College London, London and 4North Essex Mental Health Partnership NHS Trust, Epping, UK

