


Abstract
Poor vitamin D status is associated with a higher relapse rate and earlier disability in multiple sclerosis. Based on these associations, patients with multiple sclerosis are frequently supplemented with the vitamin D precursor cholecalciferol, although it is unclear whether this regimen is of therapeutic benefit. To model consequences of this common practice, mice were fed for more than 3 months with a low, medium or high dose of cholecalciferol, representative of vitamin D deficiency, modest and disproportionally high supplementation, respectively, in patients with multiple sclerosis. Compared to vitamin D-deprived mice, its moderate supplementation reduced the severity of subsequent experimental autoimmune encephalomyelitis, which was associated with an expansion of regulatory T cells. Direct exposure of murine or human T cells to vitamin D metabolites inhibited their activation. In contrast, mice with 25-(OH) vitamin D levels above 200 nmol/l developed fulminant experimental autoimmune encephalomyelitis with massive CNS infiltration of activated myeloid cells, Th1 and Th17 cells. When dissecting this unexpected outcome, we observed that high, but not medium dose vitamin D had caused mild hypercalcaemia, which rendered T cells more prone to pro-inflammatory activation. Exposing murine or human T cells to equivalent calcium concentrations in vitro enhanced its influx, triggering activation, upregulation of pro-inflammatory gene products and enhanced transmigration across a blood–brain barrier model. These findings suggest that vitamin D at moderate levels may exert a direct regulatory effect, while continuous high dose vitamin D treatment could trigger multiple sclerosis disease activity by raising mean levels of T-cell excitatory calcium.
Introduction
Although the precise cause of multiple sclerosis remains unknown, various factors have been discovered that determine an individual’s risk to develop this chronic demyelinating disease of the CNS. A majority of risk alleles identified by genome-wide association studies relate to immune functions (Baranzini and Oksenberg, 2017), supporting an autoimmune aetiology for the CNS inflammation, demyelination and neurodegeneration that is characteristic of multiple sclerosis. Environmental factors, such as a symptomatic Epstein-Barr virus (EBV) infection at a vulnerable age (Ascherio and Munger, 2010), smoking (Wingerchuk, 2012) as well as lack of sunlight exposure (Bjornevik et al., 2014) and low levels of vitamin D (Munger et al., 2006; Ascherio et al., 2010) may also enhance the risk of developing multiple sclerosis. The latter two factors could be interdependent, as the primary form of vitamin D, cholecalciferol (vitamin D3) is generated in the skin upon ultraviolet (UV) radiation; alternatively, vitamin D can be ingested as part of the diet. While diet is generally considered the minor source of vitamin D (Holick, 2004), it may become essential when UVB exposure is limited (Holick, 1987). Because vitamin D levels can be effectively and rapidly raised by diet, vitamin D supplementation has gained interest over recent years in multiple sclerosis as well as other chronic conditions.
In general, patients with multiple sclerosis have relatively low levels of vitamin D, which may refer to genetic and metabolic alterations associated with multiple sclerosis itself (Nieves et al., 1994; Laursen et al., 2015; Mokry et al., 2015; Bhargava et al., 2017). Lower serum concentrations of vitamin D increase the likelihood of both relapses and early onset of disability progression (Runia et al., 2012), whereas levels above 70 nmol/l are associated with a decreased risk for attacks (Smolders et al., 2008). While these findings clearly highlight low vitamin D levels as a negative predictor in multiple sclerosis, it is currently unclear whether this association is causal and accordingly, whether therapeutically raising the level of vitamin D in patients with multiple sclerosis is of clinical benefit (Stein et al., 2011; Dorr et al., 2012; Bhargava et al., 2014). Primarily based on the perception of its harmlessness it is nevertheless current practice to broadly supplement vitamin D in patients with multiple sclerosis, often at excessively high doses. In light of the current lack of evidence for a clear therapeutic benefit in multiple sclerosis we revisited this concept and investigated the clinical and immunological effect of chronic vitamin D exposure in the preclinical multiple sclerosis model, murine experimental autoimmune encephalomyelitis (EAE).
Materials and methods
Approval of human sampling
Peripheral blood mononuclear cells (PBMCs) were obtained after informed consent. The protocol was approved by the Ethics committee of the University Medicine of Göttingen, approval number 3/4/14.
Mice
Wild-type C57BL/6 mice were purchased from Charles River. MOG p35‐55 TCR transgenic 2D2 mice were kindly provided by Dr Kuchroo (Boston, USA). All animal experiments were carried out in accordance with the guidelines of the Central Department for Animal Experiments, University Medical Center, Göttingen and approved by the Office for Consumer Protection and Food Safety of the State of Lower Saxony (protocol number 33.9‐42502‐04‐13/1201, 33.9‐42502‐04‐15/1804 and 33.9‐42502‐04‐17/2615).
EAE induction and scoring
Female wild-type mice were immunized subcutaneously with 50 µg MOG peptide (p)35‐55 MEVGWYRSPFSRVVHLYRNGK (Auspep) emulsified in complete Freund’s adjuvant (Sigma-Aldrich) containing 250 µg killed Mycobacterium tuberculosis H37 Ra (BD Bioscience) followed by intraperitoneal injections of 200 ng of Bordetella pertussis toxin (Sigma-Aldrich) on the day of immunization and 2 days thereafter. EAE severity was assessed daily and scored on a scale from 0 to 5 as follows: 0 = no clinical signs; 1.0 = tail paralysis; 2.0 = hindlimb paresis; 3.0 = severe hindlimb paresis; 4.0 = paralysis of both hindlimbs; 4.5 = hindlimb paralysis and beginning forelimb paresis; and 5.0 = moribund/death.
Vitamin D supplementation and calcium treatment
Mice were fed with a diet containing either low (<5 IU/kg food), standard (1500 IU/kg food) or high (75 000 IU/kg food) vitamin D3 concentrations (ssniff Spezialdiaeten) for at least 8 weeks. These doses were chosen after a dose titration, as they generated serum vitamin D levels reflective of vitamin D deficiency (<30 nmol/l), physiological vitamin D levels (100 nmol/l) and continuous high-dose supplementation (250 nmol/l) in patients (Vieth, 1999; Burton et al., 2010; Smolders et al., 2010). All three diets contained identical calcium (1%) and phosphate (0.7%) concentrations (Supplementary Fig. 1). Hypercalcaemia in mice was induced by daily intraperitoneal injection of calcium gluconate (2000 mg/kg/day; Sigma-Aldrich) starting 3 days before immunization.
Determination of 25-OH-vitamin D3, calcium, phosphate, sodium and chloride
Blood was collected by vein facialis puncture and serum was isolated by centrifugation using gel columns (Sarstedt). 25-OH-vitamin D3 concentrations in serum were measured with liquid chromatography-tandem mass spectrometry using a MassChrom® 25-OH-vitamin D3/D2 LC-MS/MS kit (Chromsystems) on an AB Sciex API 4000 LC/MS/MS system (AB Sciex). Total calcium in serum and culture medium was determined using the Arsenazo III dye binding method on an ARCHITECT c16000 analyser (Abbott Diagnostics). Ionized calcium in culture medium was measured on a blood gas analyser GEM Premier 4000 (Instrumentation Laboratory). Total inorganic phosphate in serum was quantified based on Molybdenum blue colorimetric method on an ARCHITECT c16000 analyser (Abbott Diagnostics). Total sodium in serum and total chloride in culture medium were measured using ion-selective electrodes on an ARCHITECT c16000 analyser (Abbott Diagnostics).
Isolation of human and murine leucocytes
Human PBMCs from healthy donors were isolated after Ficoll gradient centrifugation (Biochrom). Human T cells were purified from PBMCs by negative magnetic-activated cell sorting (MACS) separation using MojoSort™ human T cell isolation kit (BioLegend). Single cell suspensions of murine lymphoid tissues were generated by gentle dissection and passing through 70 µm cell strainer (Greiner Bio-One). Murine CNS mononuclear cells were isolated by digestion of perfused CNS tissue using collagenase D (Roche) and DNase I (Roche) at 37°C for 45 min. Mononuclear cells were passed through a 70 µm cell strainer (Greiner Bio-One) and lymphocytes were collected by discontinuous density Percoll® gradient (GE Healthcare). Murine blood was collected in PBS containing 1 mM EDTA followed by erythrocytes lysis using BD Pharm Lysing Buffer. Murine splenic CD11b+ cells were purified by negative MACS separation using a mouse lineage panel (BD Bioscience). Murine T cells were isolated by negative MACS separation using a mouse pan T cell isolation kit II (Miltenyi). For separate stimulation of CD4+ and CD8+ T cells, murine T cells were isolated by positive MACS separation using CD4 (L3T4) and CD8a (Ly-2) MicroBeads (Miltenyi), respectively.
Histology and immunohistochemistry
Mice were transcardially perfused with PBS followed by 4% paraformaldehyde (PFA) and tissue was paraffin embedded. One-micrometre thick slices were stained with haematoxylin and eosin and Luxol fast blue/periodic acid shiff (LFB/PAS). T cells, B cells and macrophages were detected by immunohistochemistry with an avidin-biotin technique using antibodies specific for CD3 (SP7; DCS Innovative Diagnostik-Systeme), CD45R/B220 (RA3‐6B2; BD Biosciences) and Mac-3 (M3/84; BD Biosciences). Histological sections were captured using a digital camera (DP71; Olympus Europa) mounted on a light microscope (BX51; Olympus Europa). The percentage of demyelinated white matter was calculated using cellSens Dimension software (Olympus Europa). Inflammatory cells were quantified at ×400 magnification using an ocular counting grid and are shown as cells/mm2. At least eight spinal cord cross sections were taken for each analysis.
Flow cytometry
Composition of murine immune cells was analysed using the following antibodies: CD3 (145‐2C11; BioLegend), CD4 (RM4‐5; BioLegend), CD8 (53‐6.7; BioLegend), CD45R/B220 (RA3‐6B2; BioLegend), CD11b (M1/70; BioLegend), CD11c (N418; BioLegend), F4/80 (BM8; BioLegend) and CD45 (30-F11; BioLegend). Splenic monocyte activation/differentiation was determined using: CD40 (3/23; BD Bioscience), CD80 (16‐10A1; BioLegend), CD86 (GL-1; BioLegend), MHCII (AF6‐120.1; BioLegend), PD-L1 (MIH5; eBioscience) and LAP (TW7‐16B4; BioLegend). T-cell activation was investigated using: CD25 (PC61; BioLegend), CD69 (H1.2F3; BioLegend), CD95 (Jo2; BD Bioscience) and CD44 (IM7; BioLegend). T regulatory cell differentiation was evaluated by intracellular staining for FoxP3 (FJK-16s; eBioscience) after fixation and permeabilization using the fixation/permeabilization kit (eBioscience). To investigate Th1 and Th17 cell differentiation cell suspensions were stimulated with 50 ng/ml phorbol 12-myristate 13-acetate (PMA; Sigma-Aldrich) and 0.5 µg/ml ionomycin (Sigma-Aldrich) in the presence of 1 µl/ml brefeldin A (BD Bioscience) for 6 h. Cytokine production was analysed by intracellular staining for IFN-γ (XMG1.2; BioLegend) and IL-17A (TC11‐18H10; BD Bioscience) after fixation and permeabilization (BD Bioscience). Fc receptors were blocked using monoclonal antibody specific for CD16/CD32 (93; BioLegend). Dead cells were stained with a fixable viability kit (BioLegend). Samples were acquired on a BD LSR Fortessa (BD Bioscience). To investigate the cytokine profile of human T cells in migration assays, cells from lower and upper chamber were stimulated with 20 ng/ml PMA and 1 µg/ml ionomycin in the presence of 1 µl/ml brefeldin A (BD Bioscience). Dead cells were stained with LIVE/DEAD™ Fixable Aqua Dead Cell Stain Kit (Thermo Fisher Scientific). CD3 (OKT3, Biolegend), CD8 (RPA-T8, BD Bioscience) and CD4 (SK3, BD Bioscience) were used for surface staining. To assess cytokine production IL-17 (eBio64CAP17, eBioscience), IFN-γ (B27, BD Bioscience), GM-CSF (BVD2‐21C11, BD Bioscience) and IL-4 (8D4‐8, BD Bioscience) were used. Samples were acquired on a BD™ LSRII cytometer (BD Bioscience). All data evaluation was performed using FlowJo software (FlowJo LLC, Ashland, USA).
ELISA
Production of IFN-γ, IL-17 and GM-CSF was measured using ELISA MAX™ Standard Set kits (BioLegend). Absorbance was measured at 450 nm with subtraction of a 540 nm reference wavelength on iMark™ microplate reader (Bio-Rad).
Phagocytosis assay
Thymocytes were gently dissected from wild-type mice and passed through a 70 µm cell strainer (Greiner Bio-One) and apoptosis was induced by 1 µM dexamethasone (Sigma-Aldrich) incubation overnight. Apoptotic thymocytes were labelled with pHrodo Red, succinimidyl ester (pHrodo Red, SE; Thermo Fisher Scientific) and added to LPS pre-stimulated (50 ng/ml; overnight) splenic CD11b+ cells. After incubation of splenic CD11b+ cells with apoptotic thymocytes at 37°C or on ice for 1 h phagocytosis was assessed by flow cytometry.
Anti-CD3 and anti-CD28 stimulation
For the analysis of T-cell proliferation, T cells were stained with carboxyfluorescein succinimidyl ester (CFSE), for evaluation of differentiation or migration across the blood–brain barrier model, T cells remained unstained. T cells were incubated in anti-CD3 (clone 145‐2C11 for murine T cells; clone OKT3 for human T cells), or anti-CD28 (clone 37.51 for murine T cells; clone CD28.2 for human T cells) (BioLegend) pre-coated wells for 48–72 h (for murine T cells) or 96–120 h (for human T cells). To study the effects of calcium, cholecalciferol, 25-(OH)-vitamin D and 1,25-(OH)2-vitamin D on T-cell proliferation and differentiation, T cells were preincubated with the respective components at 37°C for 1 h. Calcium chloride was dissolved in complete medium, cholecalciferol, 25-(OH)-vitamin D as well as 1,25-(OH)2-vitamin D were dissolved in absolute ethanol and adjusted to contain equal ethanol concentrations after dilution. Monitoring of pH occurred with inoLab® pH Level 1 (WTW).
Calcium flux
T cells were pre-incubated in complete Hanks’ balanced salt solution (HBSS) medium (HBSS medium containing 1.3 mM CaCl2, 0.5 mM MgCl2 and 1% foetal calf serum) with increasing calcium concentrations at 37°C for 1 h followed by staining with 4 mg/ml Fluo-3 AM and 10 mg/ml Fura Red AM (Biomol) in complete HBSS (Thermo Fisher Scientific) containing 0.02% Pluronic F-68 (Life Technologies) at 37°C for 30 min. T cells were kept on ice and directly before flow cytometry acquisition pre-heated to 37°C for 5 min. After a 25-s baseline recording, human or mouse T cells were stimulated using 10 or 20 ng/ml ionomycin (Sigma-Aldrich), respectively.
Quantitative PCR
T cells were preincubated at the indicated calcium concentrations for 1 h at 37°C followed by stimulation in anti-CD3/anti-CD28 pre-coated 6-well plates for 1–6 h (murine T cells) or for 3–20 h (human T cells) at 37°C. Total RNA was isolated using the RNeasy® mini kit (Qiagen) and transcribed into cDNA using the QuantiNova™ Reverse Transcription kit (Qiagen) according to the manufacturer’s instructions. Quantitative (q)PCR was performed using 500 nM per primer and qPCRBIO SyGreen (Nippon Genetics Europe) in a total volume of 10 µl on a QuantStudio™ 7 (Applied Biosystems). Primers specific for IL-2, GM-CSF, IFN-γ and beta-actin were purchased from Bio-Rad (for mouse) and Thermo Fisher Scientific (for human). Quantitative PCR runs were performed at 95°C denaturating and 66°C or 68°C annealing temperature for mouse and human T cells, respectively. Elongation was performed for 30 s and 40 cycles with subsequent melt-curve analysis. Primer specificity was validated by product size analysis using a 2% agarose gel containing GelRed (Biotium) and UV light illumination. Detailed primer information are listed in the supplementary material (Supplementary Table 1). Samples were analysed in duplicate or triplicate and considered valid when Ct < 35 and standard deviation (SD) Ct < 0.5. Analysed cytokine expression was normalized to beta-actin expression loading control (ΔCt) in mice or human T cells, respectively. ΔΔCt values were calculated in comparison to the 1.0 mM Ca2+ condition and relative gene expression was calculated by 2−ddCt.
Blood–brain barrier transmigration assay
Blood–brain barrier-endothelial cells (BBB-ECs) were isolated and cultured from non-epileptic surgical human CNS material as published previously (Ifergan et al., 2006). Written informed consent was obtained from every donor prior to surgery (CHUM research ethics committee; approval number BH07.001 and HD04.046). In vitro transmigration assays were performed using a modified Boyden chamber as published previously (Ifergan et al., 2006; Larochelle et al., 2012, 2015). In brief, human BBB-ECs were grown to confluence on gelatin-coated 3-µm pore size Boyden chambers (Collaborative Biomedical Products) in culture medium supplemented with 40% astrocyte-conditioned medium. For the inflamed condition, TNF/IFN-γ (100 U/ml) was added in the upper chamber 24 h before the assay. Boyden chambers were washed, and fresh medium was used for the transmigration assay. Anti-CD3/anti-CD28-stimulated human T lymphocytes (106), which had been pre-incubated with the respective calcium concentrations were added to the upper chamber. After 16 h, cells that had transmigrated across the BBB-ECs layer to the lower chamber were harvested, counted and analysed by flow cytometry. Migration experiments were performed in triplicates for each donor, in all conditions.
Statistical analysis
Statistics were calculated using the software GraphPad Prism 5.01. All in vivo and ex vivo comparisons were made to the standard vitamin D diet. Serum concentrations of vitamin D3, serum and urine concentrations of calcium, phosphate and sodium as well as body weight, macrophage phagocytosis, ex vivo T-cell proliferation, cytokine concentrations are shown as mean ± standard error of the mean (SEM) and were analysed by the two-tailed t-test. Quantitative PCR results, in vitro T-cell viability, pH/calcium-/chloride concentrations in medium are shown as mean ± SEM and were analysed by one‐way analysis of variance (ANOVA) followed by Bonferroni’s multiple comparison test. Clinical scores are depicted as mean ± SEM, composition of immune cells, white matter demyelination and infiltration, monocyte- and T-cell activation and differentiation are shown as median and were analysed using the Mann-Whitney U-test. Calcium flux results are presented as mean ± SEM and were analysed by Kruskal‐Wallis test followed by Dunn’s test for multiple comparisons. T-cell migration results are shown as mean ± SEM and were analysed by Friedman test followed by Dunn’s test for multiple comparisons. Statistical analysis of the in vitro T-cell proliferation at increasing calcium, vitamin D or one of the vitamin D metabolite concentrations were performed by linear regression on a logarithmic scale. Outlier detection was performed using ROUT analysis. P-values were considered significant at *P < 0.05; other significances are indicated by **P < 0.01 and ***P < 0.001.
Data availability
The data that support the findings of this study are available from the corresponding author, upon reasonable request.
Results
Long-term high-dose oral vitamin D administration is associated with hypercalcaemia
Mice received a diet either containing a low concentration of vitamin D3 (<5 IU vitamin D3/kg), representing vitamin D deficiency, a standard (1500 IU/kg) or a high (75 000 IU/kg) dose of vitamin D3 for 15 weeks. As indicated in Supplementary Fig. 2A, the respective diet did not influence mean body weight. In vivo, vitamin D is hydroxylated in the liver and the kidney to its biologically active form 1,25-dihydroxy (1,25-(OH)2) vitamin D3. The half-life of 1,25-(OH)2 vitamin D is relatively short though, so that the vitamin D status is commonly assessed by measuring 25-(OH) vitamin D (Holick, 2009). As shown in Fig. 1A, mice in the low vitamin D group showed an average serum level below 30 nmol/l, which reflects a commonly accepted definition of vitamin D deficiency in humans (Holick, 2007). The standard group contained serum levels around 100 nmol/l, which is considered an upper normal vitamin D level in humans (Holick, 2007) and facility-housed mice (Bolton et al., 2013). The high vitamin D diet led to serum 25-(OH) vitamin D concentrations of ∼250 nmol/l, a level that is commonly achieved in patients by its continuous supplementation at high doses (Vieth, 1999; Burton et al., 2010; Smolders et al., 2010). Mice that received the high vitamin D diet showed elevated concentrations of both total as well as ionized calcium in their serum. Urine calcium concentrations were also substantially increased, indicating that long-term treatment with high vitamin D doses regularly caused hypercalcaemia in a predictable manner (Fig. 1B–H)
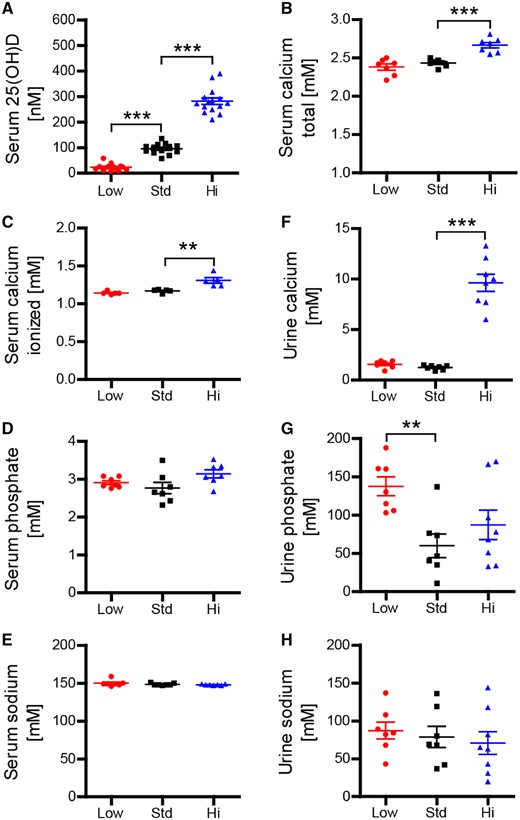
Vitamin D high excess supplementation raises serum 25-OH-vitamin D3 as well as serum and urine calcium concentrations. Mice were fed a diet containing low (<5 IU/kg food), standard (1500 IU/kg food) or high vitamin D concentrations (75 000 IU/kg food). (A) Serum 25-OH D3 concentrations were measured using liquid chromatography-tandem mass spectrometry 15 weeks after diet onset (representative plots of three independent experiments; data given as mean ± SEM; n = 13–15). Total calcium, total phosphate and total sodium in serum (B, D and E) and urine (F–H) were quantified on an ARCHITECT c16000 analyser 10 weeks after vitamin D diet onset (representative plots of two independent experiments; data given as mean ± SEM; n = 7–8). (C) Ionized calcium was measured on a blood gas analyser GEM Premier 4000 10 weeks after vitamin D diet onset (data given as mean ± SEM; n = 5).
High dose vitamin D promotes severe, persistent disability in EAE
Vitamin D exerts immunomodulatory effects on cells within the innate and adaptive immune system, which widely express cell surface vitamin D receptors (VDRs) (Cantorna et al., 2004). Therefore, we examined whether the respective vitamin D diet may have affected the frequency of T cells, B cells and myeloid antigen-presenting cells (APCs) in blood, lymph node and spleen. As indicated in Supplementary Fig. 3, high vitamin D was associated with an increase in frequency of T cells and fewer B cells in the blood. Moreover, in the spleen, these mice contained an elevated frequency of CD11c+ dendritic cells and F4/80+ macrophages.
EAE was induced after chronic vitamin D supplementation. All three treatment groups developed EAE around Day 12 (Fig. 2A). Mice that received the standard dose of vitamin D developed the lowest scores, as expected based on earlier EAE studies showing that short-term oral vitamin D administration ameliorated EAE and impaired activation and CNS migration of monocytes (Nashold et al., 2000) and T cells (Mayne et al., 2011). Surprisingly, mice supplemented with high vitamin D dose manifested a more severe EAE course. Mice were maintained on their respective diet throughout the entire disease course. Recognizing nutrition as a potential confounder, we monitored weights daily. While low and high vitamin D groups had modestly higher mean body weights within days after immunization, there were no significant differences in body weights in any groups throughout the disease course (Supplementary Fig. 2B).
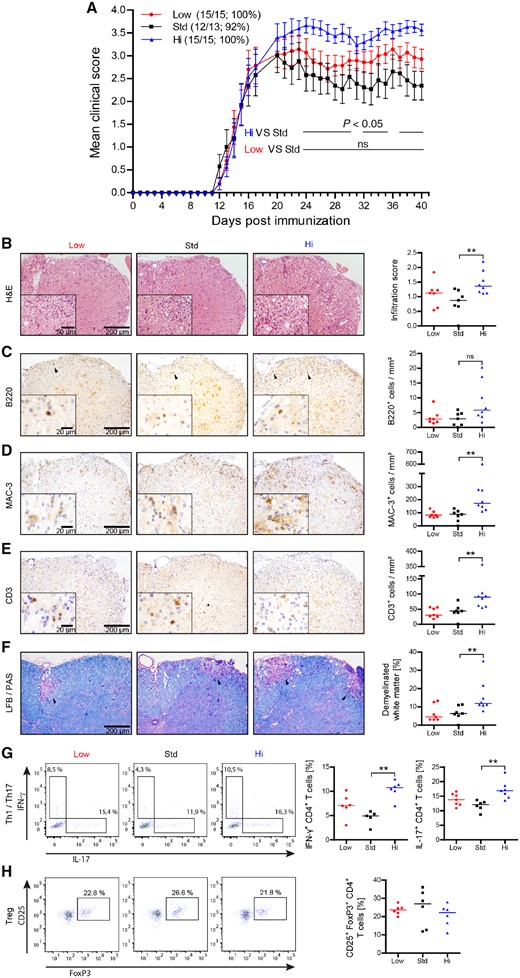
Vitamin D high excess supplementation enhances clinical severity of active EAE and increases CNS cellular infiltration by MAC-3+ cells, encephalitogenic T cells and white matter demyelination. Mice were fed a diet containing low (<5 IU/kg food), standard (1500 IU/kg food) or high vitamin D concentrations (75 000 IU/kg food) for 15 weeks. EAE was induced by MOG peptide 35‐55 immunization 15 weeks after diet onset. Spinal cords were isolated and analysed 40 days post-immunization. (A) Mean group EAE severity is given as mean ± SEM; disease incidence is indicated in brackets; representative plots of two independent experiments; n = 13–15. (B) Overall spinal cord inflammation was evaluated by haematoxylin and eosin staining and assessed on a scale from 0 to 3 as follows: 0 = no infiltration; 1 = minor infiltration; 2 = moderate infiltration; 3 = pronounced infiltration (representative sections; left); (inflammatory scores are depicted as median; n = 7–8; right). (C–E) Cellular CNS infiltration was assessed by immunohistochemical staining for (C) B220, (D) Mac-3 and (E) CD3 (representative sections; black arrowheads indicate individual cells; left); (quantitative comparison of groups given as median; n = 7–8; right). (F) Myelinated and demyelinated white matter areas were assessed by LFB/PAS staining (representative sections; black arrowheads indicate demyelinated white matter; left). The percentage of demyelinated white matter was calculated relative to the whole white matter area (data are shown as median; n = 7–8; right). Frequencies of (G) Th1 (IFN-γ+CD4+), Th17 (IL-17+CD4+) and (H) Treg cells (CD25+FoxP3+CD4+) in the CNS were quantified by fluorescence-activated cell sorting (FACS) analysis. Representative FACS plots of two independent experiments are shown left and frequencies of Th1, Th17 and Treg cells are depicted on the right as median; n = 5–7.
High vitamin D3 diet is associated with increased inflammatory CNS infiltration and demyelination
The unexpected clinical observation of an EAE exacerbation in the group of mice containing high vitamin D serum levels was further corroborated by histological analyses, revealing a significantly increased inflammatory infiltration of the CNS (Fig. 2B). An abundance of activated CNS infiltrating myeloid cells as well as an elevated number of CNS T cells was observed in the high dose vitamin D group (Fig. 2C–E). Enhanced cellular infiltration was associated with an increase in the extent of CNS demyelination (Fig. 2F). CNS T cells were isolated and evaluated for their differentiation. As indicated in Fig. 2G, CNS T cells from mice with high vitamin D levels contained a significantly higher frequency of IFN-γ or IL-17 producing Th1- and Th17 cells, respectively. In contrast, the frequency of FoxP3+ regulatory T cells (Treg) within the CNS was slightly lower in the high vitamin D group (Fig. 2H). Taken together, the high dose vitamin D diet was associated with higher absolute numbers of myeloid cells and T cells and pro-inflammatory differentiation of these cells.
High dose vitamin D3 supplementation enhances activation, differentiation and phagocytic activity of peripheral myeloid APCs
In light of the increased inflammatory CNS infiltration we analysed whether continuously high levels of vitamin D had promoted peripheral immune cell activation and differentiation prior to CNS transmigration. As shown in Fig. 3A, myeloid APC from mice in the vitamin D high group indeed showed an enhanced surface expression of MHC class II and co-stimulatory CD40, CD80 and CD86. In contrast, expression of PD-L1, an inhibitory costimulatory molecule (Salama et al., 2003), or latency-associated peptide (LAP), a surface molecule indicative of a Treg-fostering TGF-beta production (Miyazono et al., 1991), was unaffected by the high vitamin D diet.
![Vitamin D high excess supplementation increases activation of splenic monocytes and enhances phagocytosis by splenic macrophages. (A) Splenocytes were isolated and splenic monocyte activation and differentiation was analysed by FACS 15 weeks after vitamin D diet onset in EAE diseased mice [representative plots of two independent experiments; data are shown as median of mean fluorescence intensity (MFI); n = 6–7]. (B) Splenic macrophages were isolated 9 weeks after vitamin D diet onset from EAE diseased mice and co-cultured with pHrodo Red SE labelled apoptotic thymocytes at 37°C for 1 h. Phagocytosis of apoptotic thymocytes by splenic macrophages (CD11b+F4/80+) was determined by FACS. Representative FACS dot plots are shown left and percentage of phagocytosis by macrophages is depicted on the right as mean ± SEM; n = 6.](https://oup.silverchair-cdn.com/oup/backfile/Content_public/Journal/brain/142/9/10.1093_brain_awz190/2/m_awz190f3.jpeg?Expires=1716324427&Signature=qB88G3TrAfJVfqOYmOhQP8J1gNOq9zF-xfboyH1t5OfxhRpa9kME3LJb1pdor5gcmgYrSnagyPYT-SkguWBPlEAht~pPxFYIUv0InEdnXfCDpLAnDNlcNspNfRXuvpGowb4aV~FrJBr8QMGDut6955b~Z7yGluYmcbGDiymlOuva-G1NrOlROzz9621WKHwiON3T2-8rCPm9oB5zZfGz2Z~Dk1vICyODxyKpz4~MPf6HJLy7nPG~vjo7S6DV7rOsa80a~70L68OgSIibD1-kPuObf6OQTUjxm099M5UB79DO12OZU506V9XTxEJT71ysqf197WgS6xu8Zw8qMDRmDQ__&Key-Pair-Id=APKAIE5G5CRDK6RD3PGA)
Vitamin D high excess supplementation increases activation of splenic monocytes and enhances phagocytosis by splenic macrophages. (A) Splenocytes were isolated and splenic monocyte activation and differentiation was analysed by FACS 15 weeks after vitamin D diet onset in EAE diseased mice [representative plots of two independent experiments; data are shown as median of mean fluorescence intensity (MFI); n = 6–7]. (B) Splenic macrophages were isolated 9 weeks after vitamin D diet onset from EAE diseased mice and co-cultured with pHrodo Red SE labelled apoptotic thymocytes at 37°C for 1 h. Phagocytosis of apoptotic thymocytes by splenic macrophages (CD11b+F4/80+) was determined by FACS. Representative FACS dot plots are shown left and percentage of phagocytosis by macrophages is depicted on the right as mean ± SEM; n = 6.
As a prerequirement for presentation to T cells, larger antigens must first be phagocytosed and processed by the APC. As indicated in Fig. 3B, in vivo vitamin D treatment dose-dependently increased the phagocytic capacity of myeloid macrophages. While this is likely of benefit in clearance of infections (Djukic et al., 2015), enhanced uptake of auto-antigen in contrast enlarges the basis to generate an auto-reactive adaptive immune response (Kinzel et al., 2016). In conjunction with the elevated frequency of CD11c+ dendritic cells and highly differentiated F4/80+ macrophages in vitamin D- treated naïve mice (Supplementary Fig. 3) these data thus suggest that high dose vitamin D supplementation is associated with maturation of myeloid APC, an increased surface expression of the molecular machinery participating in phagocytosis and antigen presentation.
Vitamin D3 high dose diet fosters activation and pro-inflammatory differentiation of peripheral T cells
Standard and high vitamin D3 treatments were associated with a significant increase in expression of the early activation marker CD69 on T cells. There were also dose-dependent increases in the frequencies of activated CD25+ and antigen-experienced CD44hi memory T cells (Baaten et al., 2012) (Fig. 4A). Of interest, standard and high vitamin D supplementation was associated by an increase in Treg (Fig. 4B). When T cells were restimulated in vitro by anti-CD3/anti-CD28, however, in vivo high dose vitamin D-exposed T cells proliferated at a significantly higher rate as assessed by dilution of an intracellular dye (Fig. 4C) and preferentially differentiated into IFN-γ producing Th1 and IL-17 releasing Th17 cells (Fig. 4D and E).
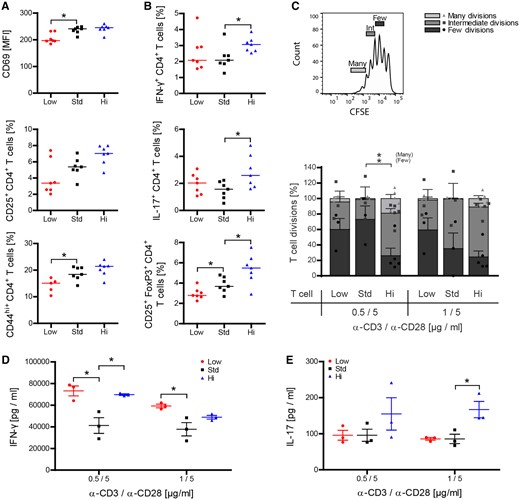
Vitamin D high excess supplementation enhances activation of peripheral T cells and promotes their encephalitogenic differentiation. (A and B) Splenocytes were isolated and T-cell activation and differentiation was analysed by FACS 9 weeks after vitamin D diet onset and 15 days post immunization (representative plots of two independent experiments; data given as median; n = 5–7). (C–E) Splenic T cells were MACS purified from wild-type mice 50 days post-immunization and 17 weeks after vitamin D diet onset. (C) T cells were CFSE labelled and incubated in anti-CD3/anti-CD28 pre-coated wells for 72 h. T-cell proliferation was evaluated by CFSE dilution and stratified by division frequency as follows: few divisions (1–2; dark grey), intermediate divisions (3–4; medium grey) and many divisions (≥5; light grey). T-cell divisions in the three groups are shown according to this setup as mean ± SEM; n = 3–5. (D and E) Differentiation of T cells into Th1- and Th17-secreting T cells was analysed by quantification of IFN-γ and IL-17 in culture supernatants by ELISA (data given as mean ± SEM; n = 3–5).
Development of pathogenic T cells in high dose vitamin D-treated mice is driven by a direct in vivo effect on T cells
The possibility that pro-inflammatory Th1 and Th17 differentiation of high vitamin D was due to a direct effect on T cells, or was a secondary effect resulting from enhanced APC maturation was investigated. Here, we used a co-culture system, in which naïve T cells were activated by myeloid APC. Either cell type was isolated from mice fed with low, standard or high vitamin D doses. Based on the substantial phenotypic alterations of CD11b+ myeloid cells, we first focused on a possible APC-driven effect. As indicated in Fig. 5A, myeloid APC continuously exposed to high vitamin D levels triggered a slightly higher proliferation of myelin-specific T cells. Yet, in vivo exposure of T cells to vitamin D exerted the greater contribution to enhanced T-cell proliferation; T cells isolated from mice treated with low or high vitamin D doses always proliferated at a significantly higher rate independent of whether the activating myeloid APC had been treated with low, standard or high vitamin D (Fig. 5B). Most strikingly, naïve myelin-specific T cells, which had been exposed to high vitamin D levels in vivo consistently differentiated into Th1 and Th17 cells, largely independent of the respective APC origin (Fig. 5C and D); conversely, low, but even more so high vitamin D effectively prevented development of Treg ex vivo (Fig. 5E). Of note, the standard vitamin D diet generated T cells with the greatest propensity to differentiate into Treg cells when activated ex vivo, which is in line with a reported fostering effect of moderate vitamin D levels on the frequency and function Treg in mice (Korf et al., 2012) and humans (Barrat et al., 2002). Next, to confirm that high 25-(OH) vitamin D levels influenced T-cell activation and differentiation directly in an antigen- and APC-independent manner, we stimulated CD4+ or CD8+ T cells purified from naïve mice fed with the low, medium and high vitamin D diet by anti-CD3/anti-CD28 directly. Parallel with our findings in EAE-diseased mice, high-dose vitamin D treatment accelerated proliferation of both CD4+ and CD8+ T cells (Fig. 5F and G). In addition, T cells from high dose vitamin D-treated mice differentiated in a pro-inflammatory manner, when activated ex vivo (Supplementary Fig. 4).
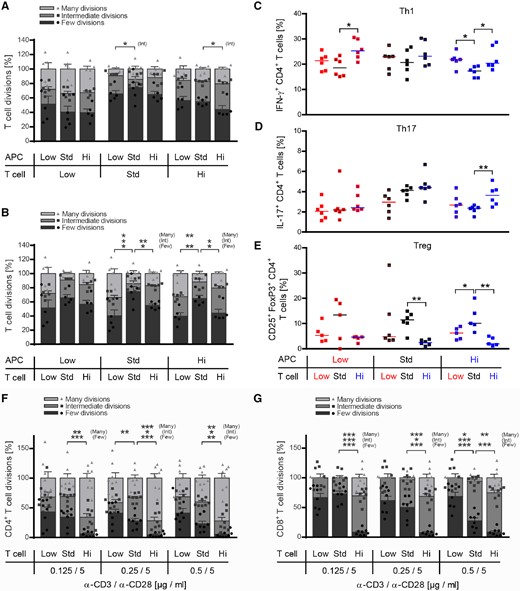
Vitamin D high excess supplementation promotes proliferation and encephalitogenic differentiation of T cells independent of its effect on myeloid APCs. (A–E) CD11b+ cells from donor mice, which were fed with low, standard or high vitamin D diet, were co-cultured in a criss-cross setup with myelin specific T cells originating from low, standard or high vitamin D supplemented 2D2 mice in the presence of MOG peptide 35‐55 for 72 h. Wild-type splenic CD11b+ cells were purified by MACS separation 16 days post-immunization and 10 weeks after vitamin D diet onset. Myelin-specific T cells were isolated from 2D2 mice by MACS separation 10 weeks after vitamin D diet onset. (A and B) Myelin-specific T cells were CFSE labelled prior to co-culture with CD11b+ cells in the presence of MOG peptide 35‐55. T-cell proliferation was evaluated by CFSE dilution and stratified by division frequency as follows: few divisions (1–2; dark grey), intermediate divisions (3–4; medium grey) and many divisions (≥ 5; light grey). T-cell divisions are shown as mean ± SEM; n = 5–6. (C–E) Differentiation of myelin-specific naïve T cells into Th1 (IFN-γ+CD4+), Th17 (IL-17+CD4+) or Treg cells (CD25+FoxP3+CD4+) was analysed by FACS (data given as median; n = 5–6). (F and G) Splenic T cells were isolated from naïve wild-type mice, which were fed with low, standard or high vitamin D diet for 8 weeks. MACS purified CD4+ and CD8+ T cells were labelled with CFSE and separately incubated in anti-CD3/anti-CD28 pre-coated wells for 72 h. Proliferation of (F) CD4+ and (G) CD8+ T cells was evaluated by CFSE dilution and stratified by division frequency (data given as mean ± SEM; n = 8).
Vitamin D and its metabolites inhibit proliferation of human and murine T cells in vitro
Based on these findings, next, we assessed the direct effect of vitamin D and its metabolites on both human and murine T cells in vitro. Purified T cells were pre-incubated with cholecalciferol, 25-(OH)-vitamin D or 1,25-(OH)2-vitamin D at increasing concentrations. Most importantly, these concentrations reflected both the serum ranges measured in our EAE study as well as low, physiological, and supra-physiological levels in humans. None of the vitamin D concentrations affected viability of human or murine T cells in culture (Supplementary Fig. 5A–F). As indicated in Fig. 6A–F, 25-(OH)-vitamin D or 1,25-(OH)2-vitamin D clearly inhibited proliferation of both human and murine CD4+ and CD8+ T cells in a dose-dependent manner, while non-hydroxylated cholecalciferol only exerted this effect on human T cells. These results confirmed a direct regulatory effect of vitamin D itself on T cells (Mayne et al., 2011; Peelen et al., 2011) and thus failed to explain the enhanced proliferation and pro-inflammatory differentiation of T cells observed in high dose vitamin D-treated mice.
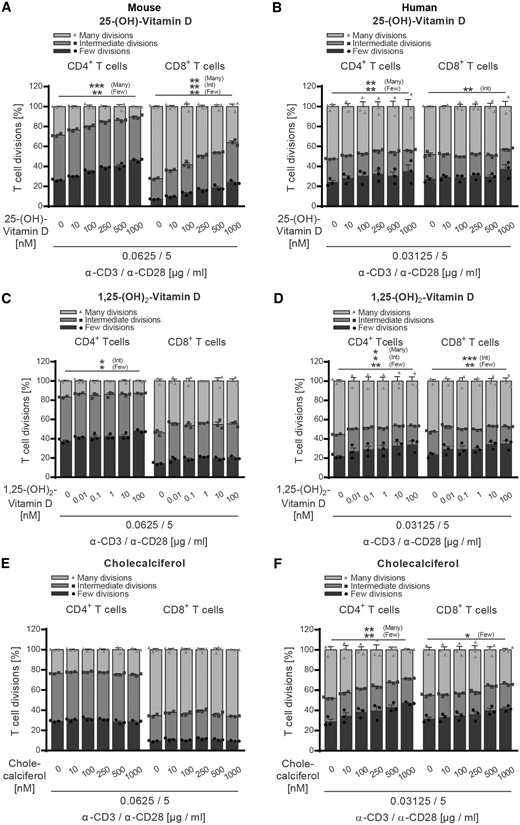
Vitamin D and its metabolites inhibit activation of both human and murine CD4+ and CD8+ T cells. (A, C and E) Splenocytes were isolated from naïve wild-type mice receiving standard vitamin D diet. (B, D and F) Human PBMCs were isolated from healthy donors after Ficoll gradient centrifugation. (A–F) MACS purified murine or human T cells were CFSE labelled and incubated with increasing concentrations of (A and B) 25-(OH)-vitamin D, (C and D) 1,25-(OH)2-vitamin D or (E and F) cholecalciferol at 37°C. After 1 h, T cells were transferred to anti-CD3/anti-CD28 pre-coated wells and incubated for 48–72 h (murine T cells) or 96–120 h (human T cells). (A–F) T-cell proliferation was evaluated by CFSE dilution and stratified by division frequency as follows: few divisions (1–2; dark grey), intermediate divisions (3–4; medium grey) and many divisions (≥5; light grey). T-cell divisions are shown as mean ± SEM; representative plots of two independent experiments; n = 3.
Calcium supplementation increases activation, proliferation and pro-inflammatory differentiation of human and murine T cells
In search of an alternative explanation, we next investigated a possible T-cell excitatory effect of calcium (Quintana et al., 2011; Monaco et al., 2016) in our model. Purified human and murine T cells were exposed to various calcium concentrations ranging from 1 to 3 mM (Fig. 7A–H). Importantly, in these in vitro assays we extended the range to include lower concentrations of calcium, having in mind that in the serum of our vitamin D- treated mice a substantial proportion is bound to protein (Fig. 1B, C and Supplementary Fig. 6A), which may reduce its direct availability for T cells proportionally. As shown in Fig. 7A and B, calcium dose-dependently accelerated proliferation of both human and murine CD4+ and CD8+ T-cells in this setting, while chloride levels, pH and T-cell viability remained unaffected (Supplementary Fig. 6B–E). Further dissecting this observation, we monitored the cellular calcium influx upon T-cell activation (Gwack et al., 2007). To account for a protein-reduced medium in these assays we used a lower range of total calcium concentrations (Supplementary Fig. 6F) and checked again that chloride levels and pH remained unaffected (Supplementary Fig. 6G and H). As indicated in Fig. 7C and D, raising extracellular calcium to concentrations again equivalent to the serum levels of ionized calcium in our vitamin D fed mice caused a significant increase in the mean calcium influx, triggering an upregulation of pro-inflammatory gene products (Fig. 7E and F). Lastly, we corroborated that this direct T-cell stimulating effect of calcium also occurred in vivo. For this purpose, we repetitively and continuously injected mice with calcium gluconate, resulting in a hypercalcaemia equivalent to the levels measured in high dose vitamin D-treated mice (Fig. 8A and B). As indicated in Fig. 8C and D, serum hypercalcaemia by itself substantially increased the expression of activation markers on CD4+ and CD8+ T cells in these mice, confirming that this effect occurs in vivo independent of vitamin D. Taken together, our results indicate that development of encephalitogenic T cells and EAE exacerbation in high dose vitamin D-treated mice indeed reflected a direct increase in T-cell excitatory calcium.
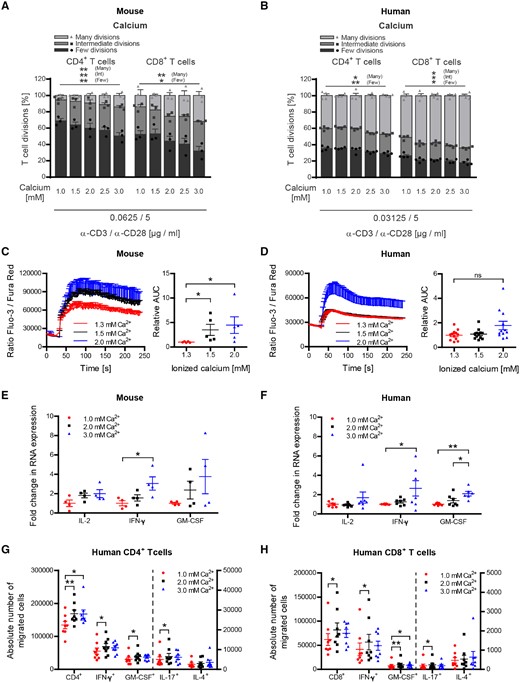
Hypercalcaemia increases proliferation and encephalitogenic differentiation of both human and murine CD4+ and CD8+ T cells. (A, C and E) Splenocytes were isolated from naïve wild-type mice receiving standard vitamin D diet. (B, D, F, G and H) Human PBMCs were isolated from healthy donors after Ficoll gradient centrifugation. (A and B) MACS purified murine or human T cells were CFSE labelled and incubated with increasing calcium concentrations at 37°C. After 1 h, T cells were transferred to anti-CD3/anti-CD28 pre-coated wells and incubated for 48–72 h (murine T cells) or 96–120 h (human T cells). T-cell proliferation was evaluated by CFSE dilution and stratified by division frequency as follows: few divisions (1–2; dark grey), intermediate divisions (3–4; medium grey) and many divisions (≥5; light grey). T-cell divisions are shown as mean ± SEM; representative plots of two independent experiments; n = 3. MACS purified (C) murine or (D) human T cells were incubated with concentrations of ionized (free) calcium equivalent to concentrations measured in serum or culture medium. After 1 h, T cells were stained with Fluo-3 AM and Fura Red AM and calcium flux was evaluated by FACS. Representative calcium flux is shown left and area under the curve is depicted on the right (data given as mean ± SEM; (C) pooled plots from two independent experiments; n = 5; (D) pooled plots from three independent experiments; n = 8). MACS purified (E) murine or (F) human T cells were incubated with increasing calcium concentrations at 37°C. After 1 h, T cells were transferred to anti-CD3/anti-CD28 pre-coated wells and incubated for 1–3 h (murine T cells) or 3–20 h (human T cells). Total RNA was isolated, transcribed into cDNA and analysed by qPCR (data given as mean ± SEM; (E) pooled plots from two independent experiments; n = 4, (F) pooled plots from two independent experiments; n = 6–7). Number of CD4+ (G) and CD8+ (H) T cells in bottom chamber after 16 h migration over inflamed human BBB-ECs (modified Boyden chamber assay; left: total number of cells; right: number of cytokine-producing cells), following activation of T cells in the presence of various calcium concentrations. One million activated human T lymphocytes were seeded (data given as mean ± SEM; n = 6 different T-cell donors, two different BBB-EC preparations).
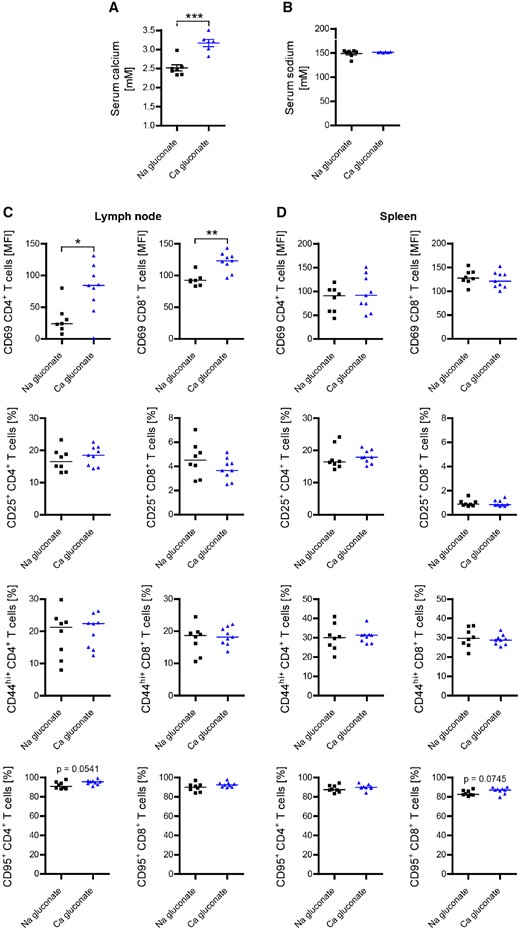
Calcium administration in vivo enhances activation of peripheral T cells. Hypercalcaemia in mice was induced by daily intraperitoneal injection of calcium gluconate (2000 mg/kg/day) starting 3 days before immunization. Total calcium (A) and total sodium (B) in serum were quantified on an ARCHITECT c16000 analyser 22 days post-immunization (representative plots of two independent experiments; data given as mean ± SEM; n = 6–7). Inguinal lymph node cells (C) and splenocytes (D) were isolated and analysed for T-cell activation by FACS 22 days post-immunization (representative plots of two independent experiments; data given as median; n = 7–9).
Calcium supplementation increases human T-cell transmigration across a blood–brain barrier model
To evaluate the impact of calcium on the capacity of T cells to cross the blood–brain barrier, we used an in vitro model in which activated human T cells migrate across a monolayer of inflamed human BBB-ECs. T cells exposed to higher calcium concentrations (2 and 3 mM) showed a significantly greater migration capacity when compared to the lower concentration (1 mM). High level calcium exposure of T cells furthermore resulted in an increased number of CD4+ and CD8+ T cells producing pro-inflammatory cytokines, such as IFN-γ, GM-CSF and IL-17 beyond the BBB-EC monolayer (Fig. 7G and H). In context with the enhanced cellular CNS infiltration in EAE, these data suggest that secondary hypercalcaemia occurring upon high-dose vitamin D treatment could enhance migration of pro-inflammatory effector T cells into the affected CNS.
Discussion
Geographical latitude correlates with multiple sclerosis incidence (Acheson et al., 1960) which highlights the influence of environmental factors in multiple sclerosis (Ascherio and Munger, 2007). Lack of exposure to sunlight, UV radiation and hereby relatively low levels of vitamin D in the context of its emerging immunoregulatory properties provides one attractive explanation for this correlation (Nielsen et al., 2017); the central question remaining though is whether lack of vitamin D is causal in triggering multiple sclerosis activity or an epiphenomenon of insufficient sun light exposure as the true risk factor (Schwarz et al., 2012). A direct effect of vitamin D on multiple sclerosis activity is yet the conceptual requirement for all current efforts to therapeutically raise its level in affected patients. Empiric vitamin D supplementation studies thus far have provided conflicting results (Stein et al., 2011; Loken-Amsrud et al., 2012). For example, adding vitamin D3 to interferon treatment reduced MRI activity in a small trial with relapsing-remitting multiple sclerosis patients (Soilu-Hanninen et al., 2012), which was recently confirmed by a larger phase II study (Hupperts et al., 2017). Unfortunately, the conclusions from these studies are limited as both interferon-beta (IFNβ) and vitamin D interact in modulating multiple sclerosis disease activity, and data indicate that sufficient vitamin D is a prerequisite for the benefit of IFNβ (Stewart et al., 2012). While available data indicate that moderate vitamin D supplementation is safe in multiple sclerosis (Sotirchos et al., 2016), results of ongoing larger placebo-controlled trials are needed to clarify whether therapeutic vitamin D supplementation is beneficial in multiple sclerosis independent of concomitant disease modifying therapy.
Our results suggest that modest vitamin D supplementation may have a beneficial effect in EAE, while those data were not significant. We report here, to our knowledge for the first time, that continuous supplementation with high doses of vitamin D yet exerted a highly significant paradoxical effect, promoting exacerbation of clinical and histological EAE. This outcome was underpinned by an accentuated phenotype and function of myeloid APC as well as an unleashed development of pro-inflammatory T cells upon high dose vitamin D treatment. Further, high-dose vitamin D similarly accelerated activation and differentiation of both myeloid APC and T cells in unimmunized healthy mice (Fig. 5F, G and Supplementary Fig. 7), indicating that the high vitamin D dose exerted a broad immune cell activating effect independent of an inflammatory context. At first glance, these findings appear to conflict with several other experimental studies, which mainly reported a clinical benefit of vitamin D treatment in EAE, also at higher doses (Lemire and Archer, 1991; Cantorna et al., 1996; Nashold et al., 2000); however, all of these studies evaluated short-term vitamin D supplementation. In most of these studies, hydroxylated forms of vitamin D were investigated in a brief intervention regimen. Most likely as a result, none of these studies reported development of hypercalcaemia. Elevated serum calcium was, however, observed in another study continuously exposing mice to high doses of vitamin D (Spach and Hayes, 2005), again suggesting that it may develop only after an extended period of exposure. The strength of our study is that we supplemented vitamin D for several months before assessing EAE susceptibility, and that we fed cholecalciferol, the metabolite supplemented in humans. As a result, we measured serum levels of 25-(OH) vitamin D, again the molecule most commonly assessed in humans, reflective of patients with multiple sclerosis considered vitamin D-deficient, with physiological or high vitamin D levels (Burton et al., 2010; Smolders et al., 2010), suggesting that our experimental setup including the doses chosen most suitably reflects vitamin D supplementation in humans.
Binding of vitamin D to immune cells and subsequent VDR signalling regulates pro-inflammatory immune functions (Peelen et al., 2011) and is likely of benefit in suppression of CNS autoimmune disease (Meehan and DeLuca, 2002; Xie et al., 2017). In line with these studies, our in vitro results confirm a direct beneficial effect of vitamin D and its metabolites on T cells (Peelen et al., 2011), inhibiting their activation and pro-inflammatory differentiation. Of note, the extent of this effect was consistently greater on CD8+ than on CD4+ T cells, following the relative expression levels of the VDR on these cells (Veldman et al., 2000). Interestingly, B cells can only react to vitamin D after initial activation and subsequent upregulation of the VDR, as their constitutive expression is relatively low (Provvedini et al., 1983, 1986). Nevertheless, 1,25(OH)2D3 has been shown to reduce B-cell proliferation, plasma and memory cell differentiation and induced apoptosis in proliferating B cells (Chen et al., 2007).
These findings suggest that the direct effect of vitamin D on both human and murine lymphocytes is indeed of anti-inflammatory nature and most likely beneficial in an auto-immune setting.
Our results indicate that in contrast, a rise in the serum calcium exerts the opposite effect on T cells, which can apparently override any clinical benefit of vitamin D in EAE. This is in line with the earlier finding that adding the calcium-lowering hormone calcitonin additively augmented the therapeutic benefit of a vitamin D in EAE (Becklund et al., 2009). Calcium acts as a second messenger promoting cell cycle progression in many cell types, including lymphocytes (Feske, 2007). T-cell receptor signalling raises intracellular calcium at first by its release from the endoplasmatic reticulum, and to the greater extent by subsequent extracellular calcium influx through plasma membrane calcium channels (Kuno and Gardner, 1987; Lewis, 2001). Only the latter is capable of raising intracellular and nuclear calcium levels over an extended period of time, which is required to promote activation, proliferation and differentiation of immune cells (Dolmetsch et al., 1998; Vig and Kinet, 2009), including clonal expansion of T cells (Vaeth et al., 2017). This is precisely the scenario and the sequence of events which we identified to underlie deterioration of EAE severity in our study. Modelling hypercalcaemia at the levels observed upon continuous high dose vitamin D treatment in vivo activated T cells independent of vitamin D. Mechanistically, an elevated level of calcium triggered its increased influx into T cells upon activation, which led to an upregulation of pro-inflammatory gene products. These initial events were followed by an unleashed proliferation and encephalitogenic differentiation of both human and murine T cells, corroborating a causal sequence of high dose vitamin D treatment, secondary hypercalcaemia and a promoted development of disease-driving encephalitogenic T cells. While there is currently no molecule to selectively interfere with the calcium influx into immune cells in vivo, genetically determined inability of these calcium channels to function in T cells completely blocked EAE by preventing development of myelin-reactive Th1 and Th17 cells (Ma et al., 2010). Along the same lines, therapeutic blockade of calcium channels by nimodipine was recently reported to suppress EAE (Schampel et al., 2017). This clinical benefit was primarily attributed to restored remyelination, but furthermore, may relate to attenuated T-cell activation. In conjunction, these findings indicate that worsening of EAE in our high vitamin D group indeed occurred as a consequence of raising the mean calcium level. In greater context, these data implicate that the clinically desirable effect of modest vitamin supplementation may be reflective of immune-regulatory VDR signalling, while exacerbation of T cell-mediated CNS autoimmunity at excessive vitamin D doses is primarily attributed to raising the mean calcium level.
Hypercalcaemia in its extent comparable to the levels associated with deterioration of EAE commonly occurs in humans supplemented with high doses of vitamin D (Malihi et al., 2016), especially when combined with calcium intake (Jansen et al., 1997; Wingerchuk et al., 2005; Avenell et al., 2014; Bjelakovic et al., 2014). High dose vitamin D was also reported to cause hypercalcaemia in treatment of multiple sclerosis (Marcus et al., 2012), which was associated with development of severely disabling relapses as well as increased MRI activity (Fragoso et al., 2014). Along the same lines, recent clinical trials revealed enhanced immune cell activation in patients with multiple sclerosis supplemented with 50 000 IU of vitamin D3 every 5 days (Naghavi Gargari et al., 2015), whereas the functionally opposite outcome occurred at moderate vitamin D levels (Muris et al., 2016; Sotirchos et al., 2016). In conjunction with these observations, our novel findings highlight excessive vitamin D supplementation and resulting hypercalcaemia as novel risk factors promoting worsening of CNS demyelinating disease. Our data caution that in light of the currently limited information on a direct beneficial effect of vitamin D in multiple sclerosis, patients with multiple sclerosis may be at danger of experiencing untoward immunological and/or clinical effects when vitamin D is supplemented excessively.
Abbreviations
- APCs
antigen-presenting cells
- BBB-ECs
blood–brain barrier-endothelial cells
- EAE
experimental autoimmune encephalomyelitis
- FACS
fluorescence-activated cell sorting
- MACS
magnetic-activated cell sorting
- PBMCs
peripheral blood mononuclear cells
- Treg
regulatory T cell
Acknowledgements
We thank Katja Grondey, Julian Koch and Audrey Daigneault for excellent technical support. Further, we thank Hana Janova for providing the protocol on testing phagocytosis in vitro.
Funding
D.H. is supported by the Startprogramm of the Universitätsmedizin Göttingen. M.S.W. receives research support from the National Multiple Sclerosis Society (NMSS; PP 1660), the Deutsche Forschungsgemeinschaft (DFG; WE 3547/5‐1), from Novartis, TEVA, Biogen-Idec, Roche, Merck and the ProFutura Programm of the Universitätsmedizin Göttingen. S.S.Z. is supported by grants from the National Institutes of Health (1 RO1 NS092835-01; 1 R01 AI131624-01A1; 1 R21 NS108159-01), the NMSS (1 RG1701-26628) and the Maisin Foundation.
Competing interests
M.S.W. is serving as an editor for PLoS One.
References
Author notes
Darius Häusler and Sebastian Torke authors contributed equally to this work.

