


Abstract
In the present study, we have characterized several human thyroid cancer cell lines of different histotypes for their responsiveness to contact inhibition. We found that cells derived from differentiated carcinoma (TPC-1, WRO) arrest in G 1 phase at confluence, whereas cells derived from anaplastic carcinoma (ARO, FRO and FB1) continue to grow after reaching confluence. Furthermore, we provide experimental evidence that the axis, E-cadherin/β-catenin/p27 Kip1 , represents an integral part of the regulatory mechanism that controls proliferation at a high cell density, whose disruption may play a key role in determining the clinical behaviour of thyroid cancer. This conclusion derives from the finding that: (i) the expression of p27 Kip1 is enhanced at high cell density only in cells responsive to contact inhibition (TPC-1, WRO), but not in contact-inhibition resistant cells (ARO, FRO or FB1 cells); (ii) the increase in p27 Kip1 also resulted in increased levels of p27 Kip1 bound to cyclin E–Cdk2 complex, a reduction in cyclin E–Cdk2 activity and dephosphorylation of the retinoblastoma protein; (iii) antisense inhibition of p27 Kip1 upregulation at high cell density in confluent-sensitive cells completely prevents the confluence-induced growth arrest; (iv) proper expression and/or membrane localization of E-cadherin is observed only in cells responsive to contact inhibition (TPC-1, NPA, WRO) but not in unresponsive cells (ARO, FRO or FB1); (v) disruption of E-cadherin-mediated cell–cell contacts at high cell density induced by an anti-E-cadherin neutralizing antibody, inhibits the induction of p27 kip1 and restores proliferation in contact-inhibited cells; (vi) re-expression of E-cadherin into cells unresponsive to contact inhibition (ARO, FB1) induces a p27 kip1 expression and growth arrest. In summary, our data indicate that the altered response to contact inhibition exhibited by thyroid anaplastic cancer cells is due to the failure to upregulate p27 Kip1 in response to cell–cell interactions.
Introduction
Contact inhibition is a regulatory mechanism through which cells enter a stage of reversible G 1 arrest, that ensues when cells establish contacts at high cell density ( 1 ). This mechanism prevents uncontrolled cell proliferation and ensures the harmonious development of various parts of the body ( 1 ). In adult tissues, contact inhibition is continuously active, and cells arrest in G 1 phase; embryonic cells as well as cells in continuously renewing tissues are instead less subject to contact inhibition, though the degree of responsiveness to contact inhibition exhibited by embryonic and developing tissues is apparently highly regulated ( 1 , 2 ). In contrast to most non-transformed adherent cells whose growth usually decreases as cell density increases ( 2 – 7 ), loss of contact inhibition is usually associated with abnormal growth and the appearance of multilayered foci in culture commonly associated with malignant transformation ( 1 , 2 , 6 ).
Contact inhibition is apparently initiated by cell–cell interaction, although the details of the cell surface molecules involved, and the following signalling pathways that lead to the inhibition of proliferation remain poorly defined ( 1 , 8 , 9 ). Intercellular adhesion molecules have been shown to be necessary for non-transformed cells growing in a monolayer tissue culture to become quiescent when they reach confluence ( 10 – 12 ). In particular, a major role in determining growth arrest at high cell density is played by cadherins, the principal constituents of intercellular junctions. Cadherins are a family of glycoproteins that mediate cell adhesion through Ca ++ -dependent homophilic interaction of their extracellular domain. E-cadherin is expressed in epithelial tissues where it regulates cell–cell adhesion, cell migration and polarity. Following cell-to-cell adhesion, the intracellular domain of E-cadherin binds to β-catenin or γ-catenin, which in turn, mediates binding to α-catenin and to the actin cytoskeleton ( 13 , 14 ). This complex is known as zonula adherens. Absence of any of the molecules involved in this complex impairs cell–cell adhesion and promotes cancer invasion and metastasis.
Several studies have shown that cadherin-mediated signalling is involved in the contact-dependent inhibition of growth. Modulation of cadherin-mediated interactions by lowering Ca ++ concentration in the culture medium or by inhibitory antibodies can stimulate cell proliferation ( 12 ), whereas coating of the substratum with the extracellular domains of recombinant VE-cadherin or with N-cadherin ligands apparently leads to a growth arrest at the G 1 phase of the cell cycle ( 15 , 16 ) or overexpression of VE-cadherin, N-cadherin or E-cadherin can inhibit cell growth ( 15 – 17 ).
The establishment of contacts between cells elicits a series of signals that are transduced intracellularly and ultimately lead to changes in the expression and/or the activity of genes involved in the regulation of the G 1 /S transition of the cell cycle. The G 1 /S transition is regulated by the concerted action of cyclins D, cyclin-dependent kinases (Cdks) 2, 4 and 6, and Cdk inhibitors ( 18 ). The cyclins and Cdks form several active kinase complexes, such as cyclin D–Cdk4/6 and cyclin E–Cdk2, and promote cell cycle progression while Cdk inhibitors act as stoichiometric inhibitors of cyclin–Cdk complexes and cause cell cycle arrest ( 19 ). Among them, the Cdk inhibitor p27 Kip1 has been implicated in the negative regulation of G 1 progression in response to a number of antiproliferative signals ( 19 ), including serum starvation, differentiative signals and cell–cell contact ( 15 , 17 , 20 , 21 ). Contact-induced proliferative arrest mediated by p27 Kip1 is initiated by the activation of cadherin signalling induced by the establishment of cell–cell contacts ( 15 , 17 ).
Thyroid tumours represent ∼1% of all neoplasms ( 22 , 23 ). Differentiated thyroid tumours (DTC) account for 80–85% of all thyroid tumours and may be distinct in papillary or follicular histotypes. Most cases of differentiated thyroid tumour have a favourable outcome ( 22 ). Anaplastic thyroid carcinoma (ATC) accounts for 5–15% of primary malignant thyroid neoplasms. In contrast to papillary and follicular thyroid carcinoma, ATC is one of the most aggressive neoplasms in humans, being rapidly fatal with a mean survival of 6 months after diagnosis ( 23 ).
In the present study, we have investigated the role played by the E-cadherin/p27 kip1 signalling cascade in the loss of contact inhibition in human thyroid cancer. We report that cells derived from DTC (both papillary and follicular histotypes) retain the ability to respond to high cell density with p27 kip1 -dependent growth arrest; conversely, highly malignant cells derived from ATC have lost the ability to arrest proliferation in response to confluence, apparently owing to an inherent inability to upregulate p27 kip1 . The responsiveness to contact inhibition shown by the different types of thyroid cancer cells is apparently dependent on the proper expression and/or membrane localization of the E-cadherin/β-catenin complex, whose disruption in confluent monolayer cells impairs p27 kip1 upregulation and stimulates proliferation.
Materials and methods
Cell culture
Human thyroid cancer cell lines (TPC-1, NPA, WRO, ARO, FRO and FB1) have already been described [( 24 ) and references therein]. The NPA and TPC-1 cell lines were derived from papillary carcinomas (PTC) and WRO from follicular carcinoma (FTC), whereas ARO, FRO and FB1 cell lines were derived from ATC. Cells were grown at 37°C in Dulbecco's modified Eagle's medium (DMEM) supplemented with 10% fetal calf serum, and the medium was changed every other day.
Cell cycle analysis
Cells were harvested in phosphate-buffered saline (PBS) containing 2 mM EDTA, washed once with PBS, and treated for 30 min in cold ethanol (70%). Cells were washed once in PBS and permeabilized with 0.2% Tween 20 and 1 mg/ml RNase A for 30 min, and washed and stained with 50 µg/ml propidium iodide. Stained cells were analysed with a fluorescence-activated cell sorter (FACS) Calibur (Becton-Dickinson), and the data were analyzed using a Mod-Fit cell cycle analysis program.
BrdU incorporation and indirect immunofluorescence
The 5-bromo-2′deoxyuridine-5′-monophosphate (BrdU) incorporation assay was performed wherein cells were grown to subconfluence on coverslips, incubated with 10 µM BrdU for 2 h, fixed in 3% paraformaldehyde and permeabilized with 0.2% Triton X-100. We used Texas-Red-conjugated secondary antibodies to reveal BrdU-positive cells. Cell nuclei were identified by Hoechst staining. Fluorescence was visualized with Zeiss 140 epifluorescent microscope equipped with filters that discriminated between Texas Red and fluorescein. All assays were performed three times in duplicate.
Indirect immunofluorescence
Cells were grown to subconfluence on coverslips, fixed in 3% paraformaldehyde and permeabilized with 0.2% Triton X-100. p27 kip1 -positive cells were identified using Texas-Red-conjugated secondary antibodies. Cell nuclei were identified by Hoechst staining. Fluorescence was visualized with a Zeiss 140 epifluorescent microscope equipped with filters, allowing a discrimination between Texas-Red and fluorescein.
Protein extraction, western blotting and antibodies
Cells were scraped in ice-cold PBS and subsequently lysed in ice-cold NP40 lysis buffer [0.5% NP40, 50 mM HEPES (pH 7), 250 mM NaCl, 5 mM EDTA, 50 mM NaF, 0.5 mM Na 3 VO 4 , 0.5 mM phenylmethylsulfonyl fluoride, 5 µg/ml aprotinin and 5 µg/ml leupeptin]. Proteins were analysed on polyacrylamide gel, transferred onto nitrocellulose membranes (Hybond-C; Amersham Biosciences), incubated with specific primary antibodies, and visualized by using enhanced chemiluminescence (Amersham Biosciences). The antibodies used in this work were obtained from Santa Cruz Biotechnology (anti-p27 kip1 , C-19), PharMingen (anti-cyclin E, HE12; anti-pRB, G3-245; anti-cyclin A, BF638; anti-Cdk2) and Transduction Laboratories (anti-p27 kip1 ). Mouse monoclonal IgG2A directed against amino acids 735–883 of human E-cadherin was obtained from Transduction Laboratories; intercellular adhesion of E-cadherin positive human cells lines was prevented by treatment with 2 µg/ml of SHE78-7 anti E-cadherin antibody (Zymed Labs, Inc., South San Francisco, CA) at the time of cell plating. Anti-pan-cadherin antibody was purchased from Sigma (catalogue no. C1821) and anti-β-catenin antibody was from Transduction Laboratories (catalogue no. 610153). Fluorescein-conjugated secondary antibodies were obtained from Jackson Laboratories.
Immunoprecipitation and kinase assay
Cells were lysed in NP40 lysis buffer. Proteins (400 µg) were immunoprecipitated with 1–2 µg of the indicated antibodies for 2 h at 4°C and collected on protein A/G-Sepharose (Santa Cruz Biotechnology). Nine-tenths of the immunoprecipitated proteins were resolved on SDS-polyacrylamide gels, transferred to nitrocellulose filters and incubated with primary antibodies as described above. One-tenth of the immunoprecipitates was resuspended in kinase buffer (20 mM 4-morpholinepropanesulfonic acid, pH 7.2, 25 mM β-glycerol phosphate, 5 mM EGTA, 1 mM sodium orthovanadate, 1 mM DTT, 7.5 mM MgCl 2 , 50 mM ATP, 1 µCi of [γ- 32 P]ATP) and 5 µg of histone H1 for cyclin E- or CDK2-associated kinase activity (Santa Cruz Biotechnology Inc.) and incubated for 15 min at 30°C. Incorporation of radioactive phosphate was determined by using a phosphorImager (GS-525 Bio-Rad) interfaced with a Hewlett Packard computer after SDS–PAGE.
Northern blot analysis
Northern blot analysis was performed according to a standard procedure ( 25 ). In brief, equal amounts of total RNA (20 µg/lane) were denatured and resolved electrophoretically through formaldehyde–agarose gels. RNA was transferred onto a nylon membrane and cross-linked by UV irradiation. Human p27 kip1 cDNA was labelled with [ 32 P]dCTP using a random primer labelling kit (Amersham Biosciences), and hybridization was performed at 42°C in the presence of 50% formamide.
Transfection with p27 kip1 expression vector and antisense oligonucleotides
Cells (10 6 cells/10 cm dish) were cotransfected with 5 µg of pEGFP and 10 µg of pcDNA3 vector expressing wild-type p27 kip1 -hemagglutinin (HA) using Fugene 6 (Roche Applied Science). Forty-eight hours after the transfection, cells were harvested, fixed with paraformaldehyde, permeabilized with 70% ethanol and counterstained with propidium iodide. Cells yielding a fluorescence profile equivalent to those obtained with pEGFP-negative cells (not transfected) and those expressing the highest level of green fluorescence (EGFP-transfected) were separately gated and analysed to determine the DNA content using a FACS Caliber (Becton–Dickinson). The origin of plasmids was as follows: pEGFP was purchased by Clontech; HA-p27 kip1 was described in ( 24 ); E-cadherin was a kind gift from Fiona Parkinson and Ian Hart (London, UK).
Phosphorotioate antisense oligodeoxynucleotides are as follows: p27-AS: 5′-TGTCTCTCGCACGTTTGACAT-3′, p27-MS: 5′-GGTCTTCCTAGTGTACTCATC-3′. Oligonucleotides were used at a concentration of 200 nM and were delivered by the Oligofectamine reagent (Invitrogen).
In vitro degradation of p27 kip1 protein
In vitro degradation of p27 kip1 protein was carried out essentially as described previously ( 6 ). Briefly, Subconfluent or confluent TPC-1, NPA, ARO and FB1 cells were grown, collected, and frozen immediately at 80°C. Protein extracts were prepared as described previously ( 26 ) and incubated (100 µg) with 1 µg of recombinant His-tagged p27 kip1 protein. After the indicated times, reactions were stopped by adding 1 vol of Laemmli buffer and loaded onto 12.5% polyacrylamide gel. The p27 kip1 protein was visualized by using an anti-p27 kip1 monoclonal antibody. The level of p27 kip1 was quantified by subsequent scanning of films.
Results
Inhibition of thyroid cancer cell growth by cell–cell contact
We have analysed the proliferative response of human thyroid cancer cell lines to contact inhibition by determining cell cycle profile of non-confluent and confluent cells. Two papillary (TPC-1, NPA), one follicular (WRO) and three anaplastic (FRO, ARO, FB1) thyroid cancer cell lines were selected for analysis. Cells were plated at different densities as described in the legend to Figure 1 and allowed to grow for an additional 2 days before being subjected to flow cytometry analysis. Cells are depicted in Figure 1A and the results from flow cytometry are reported underneath as percentages of cells in G 0 /G 1 , S and G 2 /M compartments, respectively. The response of the different thyroid carcinoma cells to confluence was of two types: cells were either highly sensitive to contact inhibition (TPC-1 and WRO), or refractory to growth arrest upon reaching confluence (ARO, FRO and FB1). NPA cells showed an intermediate response. In Figure 1B , the response of thyroid carcinoma cells to contact inhibition was quantified by assessing a parameter, the inhibition index, calculated as the percentage of cells in S phase at high confluence divided by the percentage of cells in S phase at low confluence. As shown, the inhibitory index was very high (∼80%) in the case of TPC-1 and WRO cells derived from low aggressive DTC, intermediate for NPA cells derived from a poorly differentiated papillary carcinoma (25–30%) and low for the remaining cells lines (ARO, FRO and FB1) (<25%) derived from highly malignant ATC.
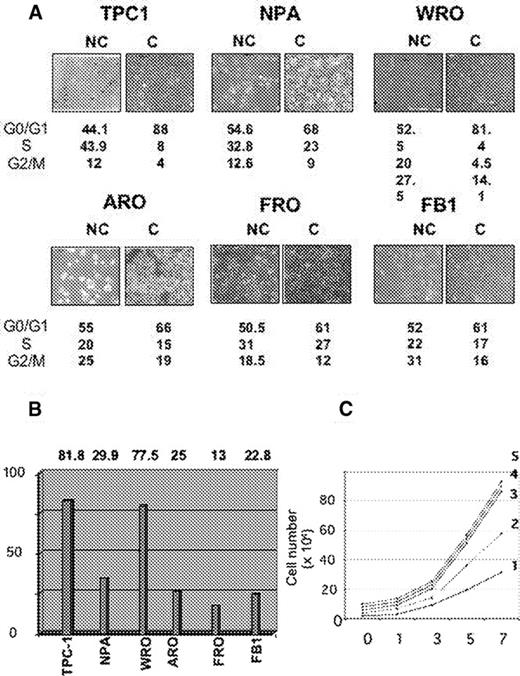
Cell cycle analysis in contact-inhibition in human thyroid carcinoma cells. ( A ) Two papillary (NPA, TPC-1), one follicular (WRO) and three anaplastic (ARO, FRO, FB1) thyroid carcinoma cell lines were plated at low (panels NC) or high (panels C) density and allowed to grow. Low cell density was achieved by plating 0.5 × 10 6 cells for TPC-1, NPA, WRO, FRO and FB-1, and 1 × 10 6 cells for ARO cells (density of <25% of confluence), whereas high cell density was achieved by plating 1.5 × 10 6 cells for TPC-1, NPA, WRO, FRO and FB-1, and of 3 × 10 6 cells for ARO cells (density of >80% confluence). Cell cycle profile was determined by flow cytometry analysis of propidium iodide stained cells; labelled cells were analysed with FACScan using CELL-FIT program. NC, non confluent cells; C, confluent cells. The fraction of cells in each phase of the cell cycle was expressed as a percentage of total number of cells and indicated underneath as G 0 /1, S and G 2 /M. Data are the means of two experiments. ( B ) Inhibitory index plot. The responsivity of human thyroid cancer cell lines to contact inhibition was assessed by measuring the inhibitory index, calculated as the ratio between the percentage of confluent cells in S phase and the ratio of subconfluent cells in S phase. ( C ) Growth rates of DTC (TPC-1, NPA, WRO) and ATC (ARO, FB-1) cells. Cells (5 × 10 4 ) were plated and grown in DMEM medium supplemented with 10% foetal calf serum and counted every 2 days for 7 days. Curves: 1, WRO; 2, FB1; 3, NPA; 4, ARO; 5, TPC-1. See online Supplementary material for a colour version of this figure.
Moreover, we observed that the proliferation rate shown by DTC cells was similar to the proliferation rate exhibited by ATC cells. As shown in Figure 1C , NPA, TPC-1, WRO, ARO and FB1 cells were seeded at low density and grown for 7 days. Fresh medium was provided every 48 h. Cells were harvested every 2 days and counted with a haemocytometer. The average population doubling time calculated for NPA and TPC-1 was similar to that calculated for ARO (curves 3, 5 and 4, respectively) and, conversely, the average population doubling time calculated for WRO cells was similar to that calculated for FB1 cells (curves 1 and 2, respectively). These results suggest that the difference between DTC and ATC is apparently not in the rate at which these cells proliferate, but it is the different responsiveness to the growth-inhibitory signals that make the difference between them.
Changes in the expression of p27 kip1 in growth-arrested thyroid cancer cells
To gain some insight into the mechanism underlying the distinct growth patterns of thyroid cancer cell lines, we examined by western blot the changes induced in the expression of cyclins, Cdks and Cdk inhibitors by confluence in thyroid cancer cells. As shown in Figure 2A , expression of cyclin D1, cyclin D2 and cyclin D3 was slightly reduced by confluence, whereas expression of cyclin E, A and of Cdk2, Cdk4, Cdk6 remained essentially unchanged.
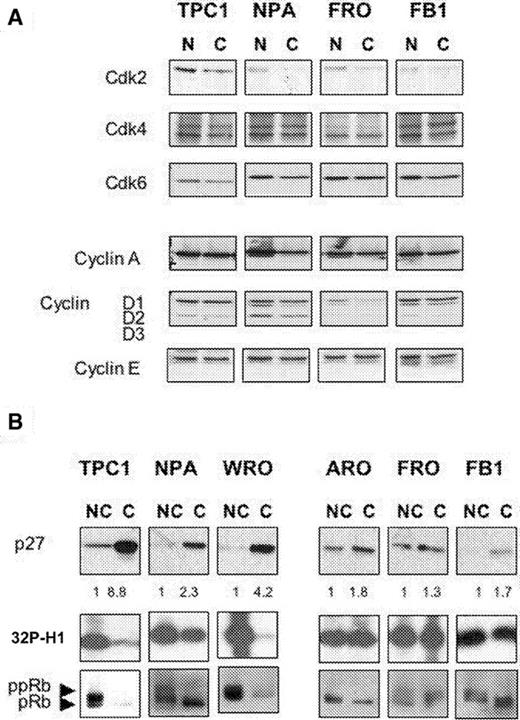
Induction of p27 kip1 expression, decrease of Cdk2 activity and reduction of pRb phosphorylation by contact inhibition correlates with sensitivity to contact-inhibition in thyroid cancer cells. ( A ) Western blot analysis of the effects of confluence on the expression of cyclins and Cdks in DTC (TPC-1, NPA) and ATC (FRO, FB1) cells. ( B ) Western blot analysis of p27 kip1 expression in DTC (TPC-1, NPA, WRO) and ATC (ARO, FRO, FB1) cells. Same lysates were immunoprecipitated with anti-Cdk2 antibodies (Cdk2 panels), and then assayed for kinase activity using recombinant histone H1 as substrate. pRB phosphorylation is maximal in subconfluent cells (lanes NC) and decreases completely in confluent TPC-1 and WRO cells or partially in NPA cells (lanes C). pRB and ppRB are indicated. NC, non-confluent; C, confluent. Red Ponceau staining of the filters was performed in every experiment to ensure uniform protein loading and integrity.
The cyclin-dependent kinase inhibitor p27 Kip1 showed the greater difference. The amount of p27 Kip1 protein was markedly increased in TPC-1 and WRO cells at high cell density (8.8- and 4.2-fold, respectively), whereas it was not observed in ARO, FRO and FB1 cells (1.8-, 1.3- and 1.7-fold increase, respectively) ( Figure 2B ). NPA cells showed an intermediate level of p27 Kip1 induction (3.3). Thus, the ability to respond to contact inhibition displayed by the different thyroid cancer cells apparently correlated with the ability to upregulate p27 kip1 at confluence. The increased amount of p27 kip1 observed in contact-inhibited cells was reflected in the change of activity of the more relevant p27 kip1 target, the Cdk2 kinase, as measured in extracts prepared from non-confluent and confluent cultures of thyroid cancer cells. Immunoprecipitates of Cdk2 prepared from non-confluent cell cultures exhibited high levels of histone H1 kinase activity ( Figure 2B , [ 32 P]H1 panel: lanes NC), whereas immunoprecipitates prepared from confluent cultures displayed low levels of kinase activity in TPC-1 and WRO cells, intermediate levels in NPA and high levels in ARO, FRO and FB1 cells ( Figure 2B , [ 32 P]H1 panel: lanes C). This demonstrates that Cdk2 activity correlated both with the proliferative rates displayed by thyroid cancer cell cultures under the different growth conditions, and with the levels of p27 Kip1 protein.
Among the known substrates of Cdks, the retinoblastoma gene product (pRB) plays an important role in mediating cell cycle arrest ( 19 ). pRB is underphosphorylated in G o /early G 1 phase and is progressively phosphorylated during late G 1 thereby suppressing the ability of pRB to block entrance into S phase. Accordingly, we found that, in parallel with the upregulation of p27 kip1 and with the decrease in Cdk2 activity, confluence induced the accumulation of the hypophosphorylated form of p110 in TPC-1 and WRO cells, but less evidently in ARO, FRO and FB1 cells ( Figure 2 , pRB panels).
Subcellular localization of p27 kip1 in thyroid cancer cells
Since the function of p27 kip1 in thyrocytes is regulated by subcellular localization ( 24 ), we evaluated by immunofluorescence whether the increase in the levels of p27 kip1 protein induced by confluence in thyroid cancer cells led to an accumulation of p27 kip1 into the nuclear compartment ( Figure 3 ). Immunofluorescence analysis demonstrated that TPC-1 and WRO (and less evidently, NPA) cells displayed strong nuclear staining, whereas ARO, FRO and FB1 cells showed a rather weak cytoplasmic p27 kip1 staining.
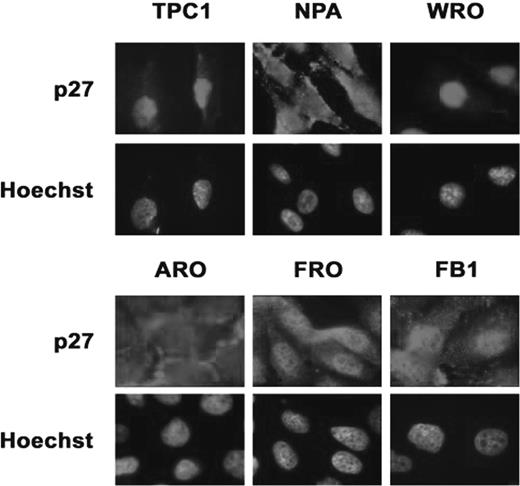
Immunofluorescence analysis of p27 kip1 localization in thyroid carcinoma cell lines. TPC-1, NPA, WRO, ARO, FRO and FB1 cells were grown to confluence on coverslips, fixed in 3% paraformaldehyde and permeabilized with 0.2% Triton X100. p27 kip1 -positive cells were identified using Texas-Red-conjugated secondary antibodies. Cell nuclei were identified by Hoechst staining. Fluorescence was visualized with a Zeiss 140 epifluorescent microscope. Magnification, ×100. The exposition time for TPC-1 and WRO was 5-fold shorter than the exposition time used for the remaining cells. See online Supplementary material for a colour version of this figure.
Analysis of p27 kip1 –Cdk complexes in contact-inhibited thyroid cancer cells
We selected TPC-1 and ARO cells as model systems to study cells with different sensitivity to contact-dependent growth inhibition cells. Extracts from subconfluent or confluent TPC-1 and ARO cells were immunoprecipitated with antibodies to Cdk2 or Cyclin E ( Figure 4A and B , respectively) and the level of associated p27 kip1 was determined by immunoblot. We found that significantly higher levels of p27 kip1 (6-fold) associated with Cdk2 in confluent TPC-1 cells compared with the subconfluent cells; conversely, although the amount of p27 kip1 detected in Cdk2 immunocomplexes in ARO cells also increased after reaching confluence, this increase was relatively small (2-fold).
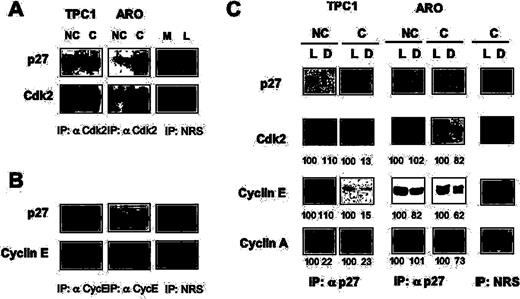
Analysis of cyclin/Cdk complexes in contact-inhibited thyroid cancer cells. Eight hundred micrograms of total protein extracts were immunoprecipitated with antibodies to Cdk2 ( A ), cyclin E ( B ) or with normal rabbit serum (NRS), as indicated, and analysed by immunoblot to determine the amount of associated p27 kip1 . All immunoprecipitates were normalized against the levels of the immunoprecipitated proteins. L, lysate. M, mock. ( C ) Lysates from non-confluent (NC) or confluent (C) TPC-1 and ARO cells were depleted with anti-p27 kip1 antibody or with a rabbit anti-mouse antibody for mock depletion (Mock). Following three sequential rounds of immunoprecipitation, we probed the lysates (L) or the supernatants (D) with antibodies specific to p27 kip1 , Cdk2, cyclin E and cyclin A, as indicated. Lysates and supernatants are indicated at the top of the figure. Bands were quantified and the values of the different proteins found in the supernatants were expressed as a percentage of the control value set at 100% in the lysates before p27 kip1 immunodepletion.
We also performed an analysis of cyclin E-containing immunocomplexes in proliferating and contact-inhibited thyroid carcinoma cells. Immunocomplex analysis showed that confluence induced a marked increase (∼5-fold) in the levels of p27 kip1 associated with cyclin E in TPC-1 cells ( Figure 4B ), whereas a smaller change (2.2-fold) in the amount of p27 kip1 associated with cyclin E was observed in ARO cells. These findings provided direct evidence that confluence induced a marked increase in the association of p27 kip1 with cyclin E/CDK2 complexes in confluence-responsive TPC-1 cells but not in confluence-resistant cells.
The majority of p27 kip1 is associated with cyclin E, cyclin A and Cdk2 at confluence
To quantify the amount of the different cyclins that was bound to p27 kip1 in asynchronously growing or confluence-arrested cells, cell extracts were sequentially immunodepleted (three times) with nomal rabbit serum (mock) or antiserum against p27 kip1 , and the amount of immunoprecipitated p27 kip1 was visualized by immunoblot of lysates (L) and depleted (D) extracts in non-confluent (NC) or confluent cells (C) ( Figure 4C , p27 panels). In TPC-1 and ARO cells, p27 kip1 was immunoprecipitated by anti-p27 kip1 antiserum (TPC-1 and ARO cells; lane L, lysate and lane D, depleted) but not by normal rabbit serum (mock, lane L and lane D, respectively). There was essentially no p27 kip1 left in the extract depleted with anti-p27 kip1 in comparison with the extracts depleted with normal serum.
The amount of Cdk2 or cyclins A and E bound to p27 kip1 in non-confluent or confluent cells was determined by comparing the amount of these proteins in whole and depleted lysates: we found that Cdk2 co-immunoprecipitated with p27 kip1 at confluence but not in growing cells; interestingly, ∼85% of Cdk2 was bound to p27 kip1 cells in confluent TPC-1, whereas the amount of Cdk2 that was bound to p27 kip1 in ARO cells at confluence was much lower (∼20%) (see Figure 4C , Cdk2 panels). Similarly, a greater amount of cyclins E and A co-immunoprecipitated with p27 kip1 (85 and 77%, respectively) in confluence-arrested TPC-1 cells, in comparison with ARO cells that are resistant to contact-dependent growth inhibition (38 and 27%, respectively).
Changes in the level of Kip1 mRNA and protein degradation rate during contact-induced growth arrest of thyroid cancer cells
Subsequently, we investigated the molecular mechanism whereby the expression of p27 kip1 is regulated in contact-inhibited cells. Regulation of intracellular levels of p27 kip1 is complex ( 27 , 28 ). During G 1 progression of normal cells, p27 kip1 mRNA levels are constant while the levels of p27 kip1 protein are regulated by translational control ( 29 ) and/or by ubiquitin-mediated proteolysis ( 30 ). We determined whether the observed increase in the level of p27 kip1 protein in thyroid cancer cells at confluence was owing to an increased p27 kip1 mRNA expression or decreased degradation of the protein itself or both. Levels of p27 kip1 mRNA at low or at high cell density were assessed by northern blot. As shown in Figure 5A , p27 kip1 mRNA was markedly increased by contact inhibition in TPC-1 and WRO cells, moderately increased in ARO and NPA cells and unchanged in FRO and FB1 cells, indicating that the increased levels of p27 kip1 protein in contact-inhibited TPC-1 and WRO cells were due, at least in part, to an increased expression of Kip1 mRNA.
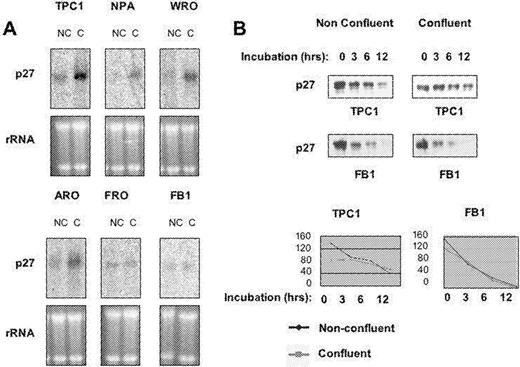
Changes in the expression of Kip1 mRNA and in the degradation rate of p27 kip1 protein occurs during contact-induced growth arrest in human thyroid cancer cells. ( A ) Total cellular RNA was prepared from thyroid cancer cell lines. RNAs (20 µg each) were separated on a formaldehyde–agarose gel, and the levels of p27 kip1 mRNA were determined by northern blotting analysis using 32 P-labelled cDNA probe. ( B ) Rate of p27 kip1 degradation in extracts from subconfluent or confluent TPC-1 and FB1 cells. One microgram of recombinant p27 kip1 was incubated at 37°C with 100 µg of proteasome extracts supplemented with 1 mM ATP, 25 mM phosphocreatine and 10 µg/ml creatine kinase at 30°C for 0, 6 or 12 h, respectively, and the subsequent immunoblot analysis revealed the amount of intact p27 kip1 protein in the different conditions. Films from the above experiments were scanned and quantified by PhosphorImager, and the values were expressed as arbitrary units and plotted against the time to calculate p27 kip1 half-life in the different conditions. NC, non-confluent cells; C, confluent cells. See online Supplementary material for a colour version of this figure.
Subsequently, we evaluated the ability of extracts from cells responsive to contact-dependent growth inhibition (TPC-1, NPA) to degrade recombinant p27 kip1in vitro . As controls, we used ARO and FB1 cells that do not upregulate p27 kip1 in response to confluence ( Figure 5 ; data not shown). Proteasome extracts prepared from non-confluent or confluent cells were incubated for 0, 3, 6 and 12 h with 1 µg of recombinant p27 kip1 at 37°C, followed by western blot for p27 kip1 ( Figure 5B ). Films were scanned and the intensities of the p27 kip1 signals were quantified and used to determine the rate at which confluent and subconfluent thyroid cancer cells degraded p27 kip1 ( Figure 5B ). Proteasome extracts derived from non-confluent TPC-1 ( Figure 5B ) and NPA (not shown) cells rapidly degraded p27 kip1 (half-life: 8 and 12 h, respectively), whereas in confluent NPA and TPC-1 cells the half-life of p27 kip1 became longer than 12 and 24 h, respectively. Conversely, FB1 ( Figure 5B ) and ARO (not shown) cells degraded p27 kip1 with a similar half-life in non-confluent or confluent cells (4.30 and 4 h, respectively).
Collectively, these experiments indicated that the up regulation of p27 kip1 protein observed in contact-inhibited TPC-1, WRO and NPA cells occurs, in part, at the transcriptional level and partly by decreasing the degradation rate of the protein itself. The failure to increase the expression of Kip1 mRNA and decrease the rate of p27 kip1 protein degradation observed in anaplastic carcinoma cells apparently accounts for the inability of these cells to accumulate p27 kip1 protein at confluence and thus, to induce growth arrest in response to contact inhibition. A partial exception is represented by ARO cells, whose Kip1 mRNA levels apparently increases at confluence. However, since the degradation rate of p27 kip1 protein at confluence remains unchanged in these cells, the observed increase in the steady-state level of mRNA does not result in a substantial increase of the level of p27 kip1 protein.
Upregulation of p27 kip1 is necessary to induce growth arrest in contact-inhibited thyroid carcinoma cells
To obtain direct evidence that p27 kip1 upregulation is necessary for the establishment of contact inhibition in thyroid cancer cells, we investigated the effects of contact inhibition exerted by high cell density in TPC-1, NPA and FB1 cells in the presence of antisense oligonucleotides, which blocked the synthesis of p27 kip1 . Using antisense oligonucleotides against the 5′ region of p27 kip1 (p27 kip1 -AS) (see Materials and methods), we were able to drastically reduce confluence-induced p27 kip1 upregulation in TPC-1 and NPA cells ( Figure 6A ), whereas the same dose of a control sequence-scrambled oligonucleotide, with similar base composition but random sequence, had no effect on the cellular levels of p27 kip1 . TPC-1, NPA and FB-1 cells were plated onto glass coverslips at 85% of confluence, transfected with p27 kip1 antisense or control oligonucleotides (200 nM), incubated with BrdU and then processed for indirect immunofluorescence. Transfection of control oligonucleotides with scrambled sequence into contact-inhibited cells had no effect on the fraction of cells that incorporated BrdU ( Figure 6B ). However, when p27 kip1 antisense oligonucleotides were added to contact-inhibited cells, TPC-1 and NPA cells resumed the capacity to incorporate BrdU at confluence. In contrast, p27 kip1 antisense oligonucleotides displayed no effect in FB1 cells, in which confluence failed to induce p27 kip1 upregulation. The results deriving from antisense experiments point to a prominent role of p27 kip1 in the regulation of contact inhibition in thyroid cancer cells.
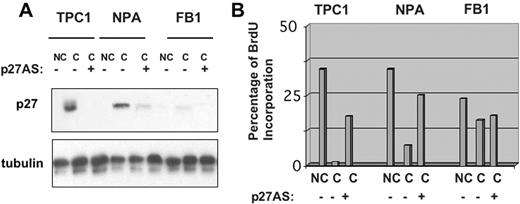
p27 kip1 is required for contact inhibition in thyroid carcinoma cells. To suppress the expression of p27 kip1 at confluence, TPC-1, NPA and FB1 cells were plated onto glass coverslips, in complete medium for 36 h, and then transfected with p27 kip1 antisense or control oligonucleotides (200 nM) with Oligofectamine. After additional 36 h, cells were incubated with 10 µM BrdU for 2 h and processed for indirect immunofluorescence or western blot. ( A ) Western blot analysis of p27 kip1 levels in the presence of control or anti-p27 kip1 antisense oligonucleotides. ( B ) The graphs indicate the percentage of BrdU positive cells. NC, non-confluent cells; C, confluent cells. See online Supplementary material for a colour version of this figure.
Expression of p27 kip1 is able to induce growth arrest in proliferating thyroid carcinoma cells
To establish whether an overexpression of p27 kip1 is sufficient to cause growth inhibition in thyroid cancer cells, we transfected a cDNA encoding HA-p27 kip1 into cells that were sensitive or resistant to confluence-dependent growth inhibition. TPC-1, NPA, ARO and FB1 cells were transfected with a control empty pcDNA3 vector or pcDNA3HA-p27, in the presence of farnesylated EGFP (pfEGFP), to track transfected from untransfected cells. After transfection, cells were harvested and processed for flow cytometry. The expression of transfected plasmids was determined by western blotting using anti-HA or anti-p27 kip1 antibodies ( Figure 7A ). Green fluorescence was used to sort transfected from non-transfected cells. As shown in Figure 7B , overexpression of HA-p27 kip1 resulted in a significant reduction of cells in the S phase compartment, with consequent accumulation of NPA and FB1 cells in the G 1 phase of the cell cycle and TPC-1 and ARO cells in both the G 1 or G 2 phases of the cell cycle. Taken together, these results suggest that the signalling pathways downstream of p27 kip1 work efficiently, both in cells sensitive to confluence-dependent growth inhibition (TPC-1 and NPA) or resistant to confluence-dependent growth inhibition (FB1, ARO), and that, for this reason, the inability to induce p27 kip1 at confluence represents the most critical defect that accounts for the loss of contact inhibition in thyroid carcinoma cells.
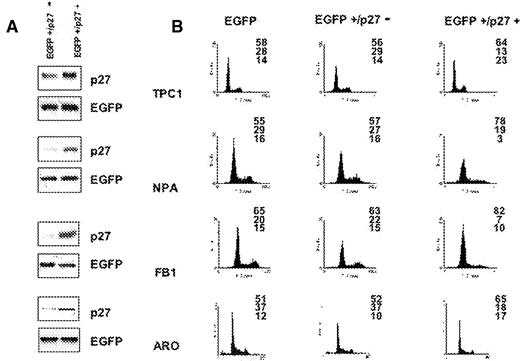
Expression of p27 kip1 is able to induce growth arrest in proliferating thyroid cancer cells. ( A ) Expression of HA-p27 kip1 in TPC-1, NPA, FB1 and ARO cells. Cells (1–3 × 10 6 cells/10 cm dish) were cotransfected with 5 µg of pfEGFP and 10 µg of pcDNA3 vectors expressing wild-type HA-p27 kip1 . Forty-eight hours after the transfection, cells were lysed in extraction buffer and the expressed HA- p27 kip1 proteins were detected by immunoblotting using anti-p27 kip1 . Controls represent mock transfections using pcDNA3 vector in place of HA-p27 kip1 . ( B ) Flow cytometry analysis. Left column: cells transfected with pfEGFP and control pcDNA3 vector. Middle column: cells transfected with pfEGFP and HA-p27 kip1 ; cell cycle profile is relative to cells sorted for being negative for fEGFP (and HA-p27 kip1 ). Right column: cells transfected with fEGFP and p27 kip1 ; cell cycle profile is relative to cells sorted for being positive for fEGFP (and HA-p27 kip1 ).
The expression of E-cadherin and/or β-catenin dictates responsiveness to contact inhibition in thyroid cancer cells
As indicated in the Introduction, the proliferative arrest induced by p27 Kip1 in response to confluence is initiated by the activation of cadherin signalling induced by the establishment of cell–cell contacts ( 15 , 17 ). To investigate the role of E-cadherin/β-catenin complex in the loss of contact inhibition observed in anaplastic thyroid cancer cell lines, we determined the expression of E-cadherin and β-catenin in the thyroid cancer cell lines that had been characterized for their responsiveness to contact inhibition. Immunoblot analysis demonstrated that TPC-1, NPA and WRO cells express high levels of both E-cadherin; conversely, ARO cells lack a complete expression of E-cadherin and FRO and FB1 cells displayed consistently reduced levels of E-cadherin ( Figure 8A ). Importantly, the observed difference in the expression of E-cadherin observed in ATC cells was translated into an abnormal pattern of E-cadherin localization at the sites of cell–cell contacts. In fact, TPC-1, NPA and WRO cells showed a normal pattern of cadherin staining whereas ARO, FRO and FB1 cells showed an almost complete absence of membrane staining and diffuse cytoplasmic staining. As shown in the Figure 8B , intense immunofluorescence (green) with anti-cadherin antibody was notable in the membrane of TPC-1, NPA and WRO cells, with a characteristic thickening at the sites of intercellular contacts. Conversely, the immunofluorescence for anti-cadherin was weak and localized in the cytoplasm in ARO, FRO and FB-1 cells. As a control, cultured cells were prepared with omission of the primary antibodies from the staining procedures: green fluorescence was completely absent from cultured cells (not shown).
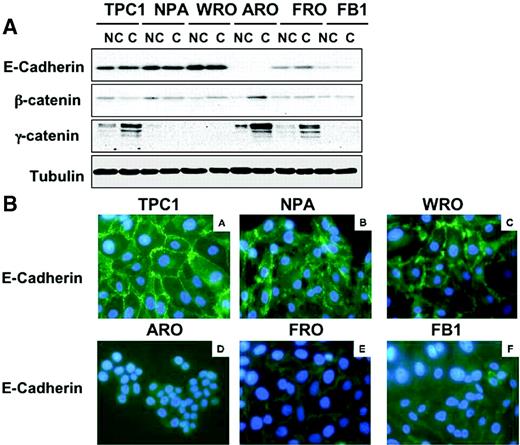
Expression of E-cadherin and β-catenin in thyroid cancer cells. ( A ) Western blot analysis of E-cadherin, β-catenin and γ-catenin in non-confluent (NC) or confluent (C) thyroid carcinoma cells. β-Tubulin served for normalization of protein loaded. ( B ) Analysis of E-cadherin subcellular distribution in thyroid cancer cells by immunofluorescence. A strong membrane signal is observed in TPC-1, NPA and WRO cells. A weak membrane expression of E-cadherin is observed in ARO, FRO and FB-1 cells; altered distribution of cadherin/catenin molecules characterized by irregular staining of regions of cell–cell contacts is observed in FRO cells.
The expression of β-catenin and γ-catenin was also determined in DTC and ATC cells. β-catenin was expressed in all thyroid cancer cell lines analysed and its pattern of expression did not show any significant difference between DTC and ATC cells. Conversely, γ-catenin expression was more heterogeneous as it was increased at confluence in TPC-1, ARO and FRO cells ( Figure 8A ).
These results suggest that resistance to contact inhibition was associated with improper expression and/or membrane localization of the E-cadherin.
E-cadherin regulates p27 kip1 -mediated growth suppression in thyroid cancer cells
To determine the role of E-cadherin in p27 kip1 -mediated contact-dependent growth inhibition, we analysed the effects exerted by SHE78-7, an anti-human E-cadherin-neutralizing antibody ( 31 ), on human thyroid E-cadherin positive thyroid carcinoma cells (TPC-1 and WRO). The E-cadherin negative ARO cell line was used as a negative control. SHE78-7, used at a concentration of 2 µg/ml, was effective at disrupting E-cadherin-mediated staining at the cell membrane in TPC-1 and WRO cells ( Figure 9A ). In fact, the intense immunofluorescence with the characteristic thickening at the sites of intercellular contacts observed in WRO and TPC-1 cells was disrupted by SHE78-7 antibody. Next, we determined whether the block of E-cadherin function in thyroid cancer cells could stimulate the proliferation at confluence. As shown in Figure 9B , the addition of SHE78-7 to the culture medium caused a marked increase in BrdU uptake in TPC-1 and WRO cells, but not in ARO cells. Finally, when E-cadherin-mediated adhesion was abrogated by the use of SHE78-7, the increase in p27 kip1 levels observed in confluent cells was reduced in WRO cells and TPC-1 cells ( Figure 9C ), strongly suggesting that the effects on the proliferation of TPC-1 and WRO cells exerted by the antibody could be mediated through the control of p27 kip1 expression. Importantly, E-cadherin negative ARO cells were unaffected by the use of the anti-E-cadherin antibody ( Figure 9B and C , respectively).
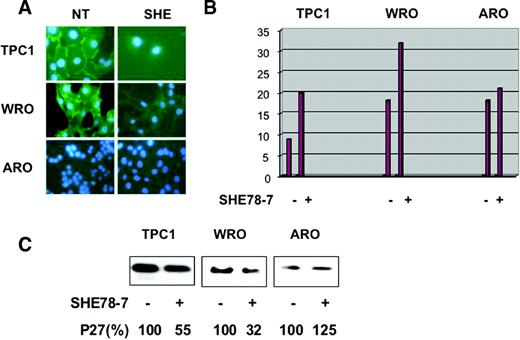
Disruption of E-cadherin-mediated cell–cell contacts overcomes confluence-induced growth arrest and decreases p27 kip1 expression. To disrupt E-cadherin-mediated cell–cell contacts at confluence, TPC-1, WRO and ARO cells were plated onto glass coverslips, in complete medium, in the presence of 2 µg/ml of SHE78-7 anti E-cadherin antibody for 48 h, and then the cells were incubated with 10 µM BrdU for 2 h and processed for indirect immunofluorescence or western blot. ( A ) Treatment of TPC-1, NPA cells with SHE78-7 anti-E-cadherin antibody abrogates the strong membrane signal of E-cadherin. ( B ) The graphs indicate the percentage of BrdU positive cells. ( C ) Western blot analysis of p27 kip1 levels in the presence or absence of SHE78-7 anti-E-cadherin antibody. Reduction of p27 kip1 expression induced by SHE78-7 antibody is expressed as a percentage and indicated under the blots.
Finally, we determined whether re-expression of E-cadherin into thyroid cancer cells that had reduced (FB1 cells) or lost (ARO cells) its expression increased p27 kip1 levels and/or caused growth inhibition. To determine the effects exerted by E-cadherin on p27 kip1 expression, ARO and FB1 cells were transfected with p27 kip1 in the presence of control empty pIRES vector or pIRES-E-cadherin, and after 24 h cells were lysed and the expression of transfected plasmids was determined by western blotting ( Figure 10A ). Transfection of E-cadherin increased the steady-state levels of transfected p27 kip1 .
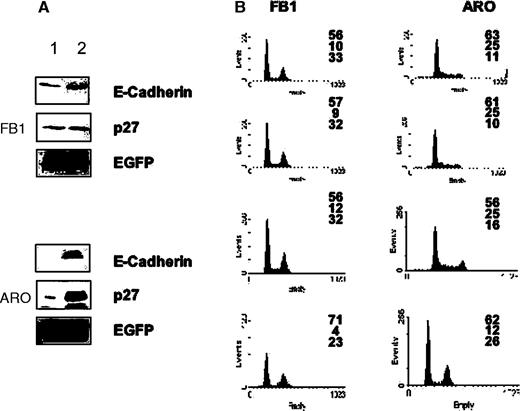
Expression of E-cadherin induces growth arrest and increases p27 kip1 expression in thyroid carcinoma cells. ( A ) Expression of and p27 kip1 in E-cadherin-transfected FB1, ARO cells. Cells (1–3 × 10 6 cells/10 cm dish) were cotransfected with 3 µg of p27 kip1 and 6 µg of pIRES-E-cadherin (lane 2). Twenty-four hours after the transfection, cells were lysed in extraction buffer and the expressed E-cadherin or p27 kip1 were detected by immunoblotting. Controls represent mock transfections using pIRES vector (lane 1). ( B ) Cells (1–3 × 10 6 cells/10 cm dish) were cotransfected with 5 µg of pfEGFP and 10 µg of pIRES vectors expressing E-cadherin. Twenty-four hours after the transfection, cells were harvested and processed for flow cytometry analysis. Left column: cells transfected with pfEGFP and control pIRES vector. Middle column: cells transfected with pfEGFP and pIRES-E-cadherin; cell cycle profile is relative to cells sorted for being negative for fEGFP (and E-cadherin). Right column: cells transfected with fEGFP and E-cadherin; cell cycle profile is relative to cells sorted for being positive for fEGFP (and E-cadherin).
To determine the effects of E-cadherin into ATC cells, ARO and FB1 cells were transfected with control empty pIRES vector or pIRES-E-cadherin, in the presence of farnesylated EGFP (pfEGFP), to track transfected from untransfected cells. After 24 h, cells were harvested and processed for flow cytometry. As shown in Figure 10B , re-expression of E-cadherin resulted in a significant reduction of cells in the S phase compartment, with a consequent accumulation in the G 1 (FB1) or G 1 and G 2 /M (ARO) compartments of the cell cycle ( Figure 10B ). Taken together, these results suggest that the re-expression of E-cadherin into thyroid carcinoma cells that exhibit reduced (FB1) or lack (ARO) of E-cadherin expression induces growth arrest by upregulating p27 kip1 .
Discussion
The present study demonstrates that cell lines derived from ATC have lost the growth inhibitory mechanism denoted as contact inhibition, whereas cell lines derived from DTC still maintain a certain degree of contact-dependent growth suppression. Although loss of contact inhibition is one of the classical hallmarks of transformation, many tumour cell lines apparently maintain a variable degree of such inhibitory mechanisms during the transformation process, which, in the case of thyroid cancer, may have profound implications since DTC and ATC differ in their biological and clinical characteristics.
The results presented here indicate that high cell density induces growth arrest in cell lines derived from DTC (TPC-1, WRO) through upregulation of nuclear p27 Kip1 expression. Conversely, ATC cells (ARO, FRO, FB1) can proliferate at both low and high cell density, in part, because they are unable to sufficiently upregulate the p27 Kip1 expression in response to confluence, and hence cause a consistent decrease in the activity of cyclin E–Cdk2 complex. The inability to induce p27 Kip1 mRNA and/or protein expression at high cell density shown by ATC cells correlated with a loss or reduced expression of E-cadherin in ATC. Thus, we propose that the acquired inability to induce p27 Kip1 mRNA and/or protein at high cell density, owing to a reduced expression of E-cadherin, can account for the aggressive proliferation characteristic of ATC and explain why decreased levels of p27 Kip1 protein in primary thyroid carcinomas represent an important determinant of the overall survival of patients with thyroid cancer ( 32 ). Accordingly, the proliferation rate of thyroid carcinomas, as measured by in situ Ki67 labelling, inversely correlates with tumour differentiation, being low in DTC and high in ATC ( 32 ).
p27 Kip1 mediates contact-dependent growth inhibition in thyroid cancer cells
Two complementary sets of experiments shown in this study provide solid support to the conclusion that the induction of p27 Kip1 in differentiated thyroid carcinoma cells, both PTC and FTC, represents a critical determinant of growth regulation at high cell density. First, the ability to respond to contact inhibition displayed by the various cell lines correlated with the ability to upregulate p27 kip1 at confluence. High cell density induced a marked p27 Kip1 accumulation in TPC-1 and WRO cells but not in ARO, FRO or FB1 cells. In parallel with the upregulation of p27 kip1 , confluence induced an increase in the levels of p27 kip1 bound to cyclinE–Cdk2 complex, a decrease in the activity of cyclinE–Cdk2 and the accumulation of the hypophosphorylated form of the retinoblastoma protein in DTC but not in ATC cells. Confluence-induced increase in p27 kip1 was sufficient to saturate almost all cellular cyclin E–Cdk2 and cyclin A–Cdk2. In fact, very little cyclin E, cyclin A or Cdk2 was detectable after immunodepletion of p27 Kip1 from confluent TPC-1 cells (but not from ARO cells).
Second, antisense inhibition of p27 Kip1 upregulation at confluence in thyroid cancer cells sensitive to contact inhibition prevents growth arrest induced by confluence, whereas it has little effect in cells resistant to contact-dependent growth arrest. An important observation derived from our data is that the majority of p27 Kip1 protein accumulates in the nuclear compartment of confluent-sensitive thyroid cancer cells (TPC-1 and WRO), whereas its localization is predominantly cytoplasmic in confluent-resistant cells (ARO, FRO and FB1), in agreement with the observation that p27 Kip1 is able to suppress Cdk2 activity only in TPC-1 and WRO, but not in ARO, FRO and FB1 cells. Accordingly, increased nuclear expression of p27 Kip1 has also been shown in glioma cell lines that retain the growth inhibitory mechanism of contact inhibition but not in glioma cell lines that are resistant to confluence-induced growth suppression ( 33 ).
Collectively, these data point to a central role for p27 Kip1 in the mechanism of contact inhibition in thyroid cancer cells, in agreement with the fact that p27 Kip1 was identified as an inhibitor of cyclin E–Cdk2 that mediates contact inhibition in Mv1Lu mink epithelial cells ( 6 , 34 ). However, the observation that antisense oligonucleotides to p27 Kip1 are not able to restore proliferation completely, indicate that p27 Kip1 may not be the unique mediator of contact inhibition in thyroid cancer cells. In fact, other cell cycle regulators, such as cyclin D1 or A, have been implicated in the establishment of contact inhibition ( 5 ), although this may be cell type-dependent ( 17 ). In vivo , p27 Kip1 apparently plays a critical role in growth arrest owing to cell–cell contact, at least in some tissues, since some organs of p27 Kip1 −/− mice display an increase in cell number ( 35 – 37 ). Our results further extend this notion since they demonstrate that p27 Kip1 is required for a confluence-dependent growth arrest of thyroid cancer cells, and that the failure to upregulate its expression at confluence causes the loss of contact inhibition shown by ATC cells.
With respect to the mechanism whereby p27 Kip1 is regulated by confluence, we report that the observed changes in p27 Kip1 protein in contact-inhibited thyroid carcinoma cells are associated with concomitant changes in both Kip1 mRNA levels and in the rate of p27 Kip1 degradation. This is consistent with what has been observed in endothelial cells, in which the increased level of p27 Kip1 protein observed in confluent cells was suggested to be achieved by a decreased degradation of p27 Kip1 protein and Kip1 mRNA, and increased transcription of Kip1 gene ( 38 ).
p27 Kip1 -mediated contact-dependent growth inhibition in thyroid cancer cells is dictated by E-cadherin/β-catenin
Since the ectopic expression of p27 Kip1 is able to induce a growth arrest (both in G 1 or G 1 and G 2 /M) not only in confluence-sensitive cells (TPC-1, NPA) but also in cells resistant to contact-dependent growth inhibition (ARO, FB1), it appears that the differential response to confluence of ATC cells, compared with differentiated carcinoma cells, is not owing to an inherent inability of these cells to respond to high p27 Kip1 levels; instead, it is the inability to increase p27 Kip1 in response to confluence that dictates whether thyroid cancer cells respond to confluence or not.
Inhibition of proliferation, induced by high cell density, depends on cell adhesion molecules, such as cadherins and catenins ( 1 , 2 , 13 , 14 ). In particular, it was shown that p27 Kip1 mediated contact inhibition in mammary carcinoma cells transfected with E-cadherin ( 17 ) and in Chinese hamster ovary cells transfected with N-cadherin ( 15 ). E-cadherin forms complexes with α-, β- and γ-catenins, which, in turn, connect E-cadherin to actin filaments and establish cell–cell adhesion. The E-cadherin/β-catenin complex is known to promote cell–cell adhesion and establish epithelial cell polarity ( 8 , 9 ). The E-cadherin cell adhesion system in cancer cells is inactivated by various mechanisms ( 9 ). Expression of E-cadherin has been shown to be frequently downregulated in human neoplasia ( 39 , 40 ), particularly through hypermethylation-dependent silencing of the promoter region ( 41 , 42 ). Alternatively, the E-cadherin/catenin system can be inactivated by mutations of the E-cadherin ( 43 – 45 ), α-catenin ( 46 ) or β-catenin genes ( 47 ), or tyrosine phosphorylation of β-catenin ( 48 ), or through the expression of a newly identified cancer-associated membrane glycoprotein that downregulates E-cadherin expression, dysadherin ( 49 – 51 ).
In the thyroid system, E-cadherin is expressed at high levels in benign thyroid disorders and in DTC, whereas its expression is low or absent in ATC ( 52 – 54 ). Importantly, the loss of E-cadherin has been attributed to a pathogenetic role in thyroid tumour invasion and in regional lymph node metastasis ( 55 ), and univariate analysis of survival showed that the lack of E-cadherin expression represents an adverse prognostic factor for thyroid carcinomas ( 56 ). Moreover, cell membrane expression of β-catenin was reported to be reduced preferentially in ATC ( 57 ). In this framework, we have found that E-cadherin is causally involved in the regulatory mechanism that induces growth arrest at high cell density, and that the dysfunction of this system is involved in the loss of contact inhibition observed in ATC cells. In fact, the ATC cell lines characterized in this study have either lost (ARO) or markedly decreased E-cadherin expression (FRO and FB1), and possibly for this reason, the capability to express p27 Kip1 in response to confluence.
Dysfunction of E-cadherin or catenins alters cellular morphology, decreases intercellular adhesion and enhances motility ( 8 ). However, in addition to regulating morphology, adhesion and invasion, our results suggest that an important tumour-suppressive task in thyroid cells of E-cadherin is to regulate p27 Kip1 expression and cell proliferation. The loss of contact inhibition that is preferentially observed in ATC may account for the increased proliferation shown by ATC when compared with DTC ( 32 ). Moreover, our data also suggest that the maintainance of a functional E-cadherin/β-catenin complex at the cell membrane is apparently necessary for the proper upregulation of p27 Kip1 and the accomplishment of contact-dependent growth arrest. This was shown using an E-cadherin-neutralizing antibody that simultaneously disrupted adhesion and rescued the growth arrest induced by confluence in E-cadherin positive thyroid carcinoma cells grown in a monolayer. Conversely, transfection of E-cadherin into thyroid carcinoma cells upregulated p27 Kip1 and induced growth arrest, which is in agreement with previous works showing that E-cadherin dependent cell–cell contacts regulate cell proliferation in breast, colon and lung carcinoma cell lines ( 17 ). However, while the growth inhibition by E-cadherin appears to induce an increase in p27 Kip1 levels, the direct mechanism responsible for this increase is not yet clear.
In conclusion, we propose that cell–cell contacts mediated by E-cadherin can activate the Kip1 gene promoter and/or increase the stability of p27 Kip1 protein, thereby upregulating p27 Kip1 expression and hence dictating a responsiveness to confluence. Most importantly, DTC cells, which express E-cadherin, respond to confluence whereas ATC cells, which show reduced or absent E-cadherin expression, are resistant to contact inhibition.
Supplementary material
Supplementary material can be found at: http://www.carcin.oupjournals.org .
We thank Dr Fiona Parkinson and Dr Ian Hart (Department of Tumour Biology, Bart's and The London, Queen Mary's School of Medicine & Dentistry, John Vane Science Centre London, UK) for providing the E-cadherin plasmid. This work was supported by grants from the Associazione Italiana Ricerca sul Cancro (AIRC), from MIUR (FIRB 2003) and from the Italian Ministry of Health (FSN 2002).
References
Fagotto,F. and Gumbiner,B.M. (
Deleu,L., Fuks,F., Spitkovsky,D., Horlein,R., Faisst,S. and Rommelaere,J. (
Dietrich,C., Wallenfang,K., Oesch,F. and Wieser,R. (
Kato,A., Takahashi,H., Takahashi,Y. and Matsushime,H. (
Polyak,K., Kato,J.Y., Solomon,M.J., Sherr,C.J., Massague,J, Roberts,J.M. and Koff,A. (
Holley,R.W. (
Tsukita,S., Itoh,M., Nagafuchi,A., Yonemura,S. and Tsukita,S. (
Hirohashi,S. and Kanai,Y. (
Aoki,J., Umeda,M., Takio,K., Titani,K., Utsumi,H., Sasaki,M. and Inoue,K. (
Takahashi,K. and Suzuki,K. (
Kandikonda,S., Oda,D., Niederman,R. and Sorkin,B.C. (
Yap,A.S., Brieher,W.M. and Gumbiner,B.M. (
Gumbiner,B.M. (
Levenberg,S., Yarden,A., Kam,Z. and Geiger,B. (
Caveda,L., Martin-Padura,I., Navarro,P., Breviario,F., Corada,M., Gulino,D., Lampugnani,M.G. and Dejana,E. (
St Croix,B., Sheehan,C., Rak,J.W., Florenes,V.A., Slingerland,J.M. and Kerbel,R.S. (
Vermeulen,K., Van Bockstaele,D.R. and Berneman,Z.N. (
Sherr,C.J. and Roberts,J.M. (
Rivard,N., L'Allemain,G., Bartek,J. and Pouyssegur,J. (
Coats,S., Flanagan,W.M., Nourse,J. and Roberts,J.M. (
De Groot,L.J., Kaplan,E.L., McCormick,M. and Strauss,F.H. (
Giuffrida,D. and Gharib,H. (
Baldassarre,G., Belletti,B., Bruni,P., Boccia,A., Trapasso,F., Pentimalli,F., Barone,M.V., Chiappetta,G., Vento,M.T., Spiezia,S., Fusco,A. and Viglietto,G. (
Sambrook,J., Fritsch,E.F. and Maniatis,T. (
Esposito,V., Baldi,A., De Luca,A., Groger,A.M., Loda,M., Giordano,G.G., Caputi,M., Baldi,F., Pagano,M. and Giordano,A. (
Slingerland,J. and Pagano,M. (
Viglietto,G., Motti,M.L. and Fusco,A. (
Hengst,L. and Reed,S.I. (
Pagano,M., Tam,S.W., Theodoras, A.M., Beer-Romero,P., Del Sal,G., Chau,V., Yew,P.R., Draetta,G.F. and Rolfe,M. (
Watabe,M., Nagafuchi,A., Tsukita,S. and Takeichi,M. (
Tallini,G., Garcia-Rostan,G., Herrero,A., Zelterman,D., Viale,G., Bosari,S. and Carcangiu,M.L. (
Fuse,T., Tanikawa,M., Nakanishi,M., Ikeda,K., Tada,T., Inagaki,H., Asai,K., Kato,T. and Yamada,K. (
Slingerland,J.M., Hengst,L., Pan,C.H., Alexander,D., Stampfer,M.R. and Reed,S.I. (
Fero,M.L., Rivkin,M., Tasch,M., Porter,P., Carow,C.E., Firpo,E., Polyak,K., Tsai,L.H., Broudy,V., Perlmutter,R.M., Kaushansky,K. and Roberts,J.M. (
Kiyokawa,H., Kineman,R.D., Manova-Todorova,K.O., Soares,V.C., Hoffman,E.S., Ono,M., Khanam,D., Hayday,A.C., Frohman,L.A. and Koff,A. (
Nakayama,K., Ishida,N., Shirane,M., Inomata,A., Inoue,T., Shishido,N., Horii,I., Loh,D.Y. and Nakayama,K. (
Hirano,M., Hirano,K., Nishimura,J. and Kanaide,H. (
Bringuier,P.P., Umbas,R., Schaafsma,H.E., Karthaus,H.F., Debruyne,F.M. and Schalken,J.A. (
Shimoyama,Y., Hirohashi,S., Hirano,S., Noguchi,M., Shimosato,Y., Takeichi,M. and Abe,O. (
Yoshiura,K., Kanai,Y., Ochiai,A., Shimoyama,Y., Sugimura,T. and Hirohashi,S. (
Kanai,Y., Ushijima,S., Hui,A.M., Ochiai,A., Tsuda,H., Sakamoto,M. and Hirohashi,S. (
Hirohashi,S. (
Becker,K.F., Atkinson,M.J., Reich,U., Becker,I., Nekarda,H., Siewert,J.R. and Hofler,H. (
Berx,G., Cleton-Jansen,A.M., Strumane,K., de Leeuw,W.J., Nollet,F., van Roy,F. and Cornelisse,C. (
Oda,T., Kanai,Y., Shimoyama,Y., Nagafuchi,A., Tsukita,S. and Hirohashi,S. (
Oyama,T., Kanai,Y., Ochiai,A., Akimoto,S., Oda,T., Yanagihara,K., Nagafuchi,A., Tsukita,S., Shibamoto,S., Ito,F., Takeichi,M., Matsuda,H. and Hirohashi,S.A. (
Matsuyoshi,N., Hamaguchi,M., Taniguchi,S., Nagafuchi,A., Tsukita,S. and Takeichi,M. (
Ino,Y., Gotoh,M., Sakamoto,M., Tsukagoshi,K. and Hirohashi,S. (
Aoki,S., Shimamura,T., Shibata,T., Nakanishi,Y., Moriya,Y., Sato,Y., Kitajima,M., Sakamoto,M. and Hirohashi,S. (
Vleminckx,K., Vakaet,L.Jr, Mareel,M., Fiers,W. and van Roy,F. (
Brabant,G., Hoang-Vu,C., Cetin,Y., Dralle,H., Scheumann,G., Molne,J., Hansson,G., Jansson,S., Ericson,L.E. and Nilsson,M. (
Soares,P., Berx,G., van Roy,F. and Sobrinho-Simoes,M. (
Husmark,J., Heldin,N.E. and Nilsson,M. (
Naito,A., Iwase,H., Kuzushima,T., Nakamura,T. and Kobayashi,S. (
von Wasielewski,R., Rhein,A., Werner,M., Scheumann,G.F., Dralle,H., Potter,E., Brabant,G. and Georgii,A. (
Author notes
1Dipartimento di Biologia e Patologia Cellulare e Molecolare “L.Califano” Facoltà di Medicina e Chirurgia, Università Federico II, via S. Pansini 5, 80131, Napoli, Italy, 2Istituto Nazionale Tumori, via M. Semmola, 80131, Napoli, Italy, 3Divisione di Oncologia Sperimentale 2, CRO National Cancer Institute, Via Pedemontana Occidentale 28, 33081 Aviano, Italy, 4Istituto di Endocrinologia ed Oncologia Sperimentale del CNR c/o Dipartimento di Biologia e Patologia Cellulare e Molecolare “L.Califano” Facoltà di Medicina e Chirurgia, Università Federico II, via S. Pansini 5, 80131, Napoli, Italy and 5Laboratorio Oncologia Molecolare III, Dipartimento di Medicina Sperimentale e Clinica, Facoltà di Medicina e Chirurgia, Università “Magna Graecia”, Campus Universitario Germaneto, Viale Europa, 88100 Catanzaro, Italy
6Present address: Dipartimento di Shidi delle Instituzioni e dei Sistemi Territoriali, Università “Parthenope”, Via Acton 39, 80100, Napoli, Italy
