


Abstract
Long-term exposure of humans to air pollution enhances the risk of cardiovascular and respiratory diseases. A novel Global Exposure Mortality Model (GEMM) has been derived from many cohort studies, providing much-improved coverage of the exposure to fine particulate matter (PM2.5). We applied the GEMM to assess excess mortality attributable to ambient air pollution on a global scale and compare to other risk factors.
We used a data-informed atmospheric model to calculate worldwide exposure to PM2.5 and ozone pollution, which was combined with the GEMM to estimate disease-specific excess mortality and loss of life expectancy (LLE) in 2015. Using this model, we investigated the effects of different pollution sources, distinguishing between natural (wildfires, aeolian dust) and anthropogenic emissions, including fossil fuel use. Global excess mortality from all ambient air pollution is estimated at 8.8 (7.11–10.41) million/year, with an LLE of 2.9 (2.3–3.5) years, being a factor of two higher than earlier estimates, and exceeding that of tobacco smoking. The global mean mortality rate of about 120 per 100 000 people/year is much exceeded in East Asia (196 per 100 000/year) and Europe (133 per 100 000/year). Without fossil fuel emissions, the global mean life expectancy would increase by 1.1 (0.9–1.2) years and 1.7 (1.4–2.0) years by removing all potentially controllable anthropogenic emissions. Because aeolian dust and wildfire emission control is impracticable, significant LLE is unavoidable.
Ambient air pollution is one of the main global health risks, causing significant excess mortality and LLE, especially through cardiovascular diseases. It causes an LLE that rivals that of tobacco smoking. The global mean LLE from air pollution strongly exceeds that by violence (all forms together), i.e. by an order of magnitude (LLE being 2.9 and 0.3 years, respectively).
Time for primary review: 9 days
1. Introduction
Global Burden of Disease (GBD) studies have assessed major health impacts and excess mortality rates from ambient (outdoor) air pollution, building on a growing database from epidemiological cohort studies.1–3 The World Health Organization (WHO) indicates that more than 70% of global mortality rates are due to non-communicable diseases (NCD).4 We investigated to what degree the long-term exposure to air pollution contributes to mortality by NCD, including cardiovascular and respiratory disease, lung cancer (LC), and lower respiratory tract infections (LRI). Main health risk factors include tobacco smoking, unhealthy diets and being overweight, hypertension, diabetes, high cholesterol, and air pollution.2,5 The mortality attributable to air pollution can be estimated with disease-specific hazard models, linked to information about exposure to ambient concentrations.3,6 We used a global atmospheric chemistry model to estimate exposure to ozone (O3) and fine particulate matter (PM2.5, particles with a diameter of less than 2.5 µm),7,8 combined with the new Global Exposure Mortality Model (GEMM) of Burnett et al.6
Compared with foregoing GBD assessments, the GEMM provides hazard functions based on a larger dataset derived from 41 cohort studies in 16 countries.6 The expanded data volume and geographical coverage reduce uncertainty, especially for high PM2.5 concentrations, which were previously not explicitly related to observed atmospheric conditions but adopted from studies of second-hand smoking.9 We used the GEMM for the following disease categories: LRI, chronic obstructive pulmonary disease (COPD), LC, ischaemic heart disease (IHD), cerebrovascular disease (CEV) leading to stroke, i.e. similarly addressed in GBD assessments, and a new one referred to as ‘other NCD’.10 The GBD has categorized global exposure risks and attributable mortality rates,2,3 but such comparisons can be ambiguous as the loss of life years differs among health risk factors and between various regions. Here, we derive global, regional, and national attributable mortality rates, along with the years of life lost (YLL) and the loss of life expectancy (LLE). By comparing the LLE from different causes, we assess the health burden from air pollution relative to other risk factors.
2. Methods
The global exposure to the air pollutants PM2.5 and O3 for the year 2015 has been computed through data-informed modelling. We used the EMAC atmospheric chemistry—general circulation model, which was built from a climate model11 extended with multi-phase atmospheric chemistry submodels to account for the atmospheric processing of pollution emissions.7,12,13 We distinguish fossil fuel-related, all anthropogenic and natural emissions, the latter mostly aeolian dust.14 While we applied the same model calculations of air pollution exposure, as well as baseline mortality and population data of the WHO for the year 2015 that we used previously,4,7,8 we revised the results by using the GEMM for the effects of PM2.5.6,10,15 This model yields age-dependent excess mortality rates and YLL from five disease categories (LRI, COPD, IHD, CEV, and LC), also distinguished by the GBD,2,3 plus one that describes NCD + LRI, from which we derive the ‘other NCD’ by subtraction.10 The burden of disease from O3 has been calculated with the hazard function of Jerrett et al.16 Uncertainty ranges are expressed as the 95% confidence intervals (95% CIs), adopted from Burnett et al.6 Since the contribution by ‘other NCD’ has been derived from the difference between the total and the known NCD, the 95% CI is relatively large (globally about ±55%) by propagating uncertainties for the five defined disease categories, for which the 95% CI is about 20–40%. The overall uncertainty estimate, including hazard ratio functions (GEMM) and atmospheric model calculations of annual average exposure, is about ±50% of the calculated mean values.8,10,17 For more information about the methods used, including data sources and country-level results, we refer to the Supplementary material online. Uncertainties and limitations are discussed in greater detail in Section 4.
3. Results
3.1 Mortality estimates
Table 1 and Figure 1 present our estimates of excess mortality rates, YLL and LLE attributable to air pollution for different regions and disease categories. The global mortality rate of 8.8 (95% CI 7.11–10.41) million/year is in good agreement with Burnett et al.6 who reported 8.9 (95% CI 7.5–10.3) million per year, and it is about a factor of two higher than in previous studies using relative risk or hazard ratio values based on less comprehensive epidemiological data.3,8,9 For comparison, the WHO estimates the global mortality from tobacco smoking (active and passive) at about 7.2 million per year.4 Geographically, the mortality from air pollution is dominated by East Asia (35%) and South Asia (32%), followed by Africa (11%) and Europe (9%). The corresponding fractions for the YLL are 29%, 36%, 17%, and 6%, respectively. The global mean mortality rate of 120 (97–142) per 100 000 people/year is exceeded in East Asia [196 (160–229) per 100 000/year] and Europe [133 (108–157) per 100 000/year]. The LLE is 3.9 (3.2–4.6) years in East Asia, associated with the large population fraction that is exposed to poor air quality. Compared with Europe, the attributable mortality rate in South Asia is 12% lower but the LLE is 50% higher [3.3 (2.6–3.9) years], which is related to less advanced health care and child mortality. Lowest mortality rates and LLE are found in Australia, associated with the strictest air quality standards worldwide.18
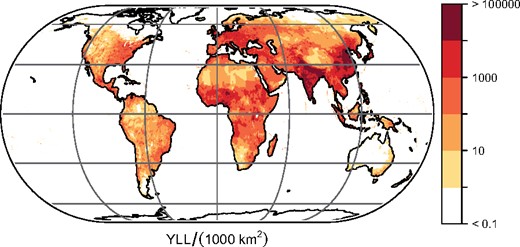
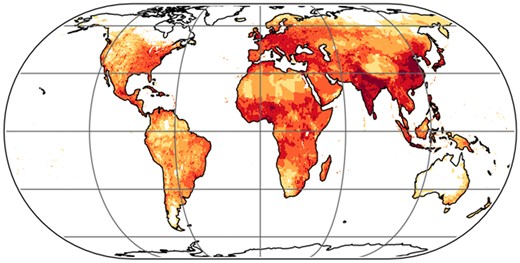
Annual years of life lost from air pollution (units per 1000 km2). The global total is 233 (221–250) million per year.
Excess mortality attributable to ambient air pollutiona
| Mortality (×103/year) | Deaths per 100 000 (year−1) | YLL (×106/year) | LLE (years) | Avoidable LLE (years) | Avoidable mortality (×103/year) | Mortality for disease categories (×103/year) | ||||||
|---|---|---|---|---|---|---|---|---|---|---|---|---|
| LRI | COPD | LC | CEV | IHD | Other NCD | |||||||
| Africa | 957 | 81 | 40.0 | 3.1 | 0.7 | 230 | 378 | 36 | 7 | 113 | 224 | 199 |
| East Asia | 3112 | 196 | 67.4 | 3.9 | 3.0 | 2403 | 204 | 511 | 300 | 738 | 779 | 580 |
| South Asia | 2809 | 119 | 83.6 | 3.3 | 1.9 | 1660 | 478 | 509 | 61 | 383 | 981 | 397 |
| West Asia | 544 | 94 | 14.6 | 2.3 | 1.0 | 241 | 50 | 27 | 19 | 76 | 292 | 80 |
| Europe | 790 | 133 | 14.3 | 2.2 | 1.7 | 608 | 54 | 49 | 54 | 64 | 313 | 256 |
| Australia | 14 | 47 | 0.3 | 0.8 | 0.2 | 3 | 0.6 | 0.8 | 0.9 | 0.6 | 4 | 7 |
| North America | 360 | 74 | 7.5 | 1.4 | 1.1 | 294 | 24 | 40 | 24 | 14 | 112 | 146 |
| South America | 207 | 42 | 5.3 | 1.0 | 0.5 | 115 | 30 | 14 | 6 | 14 | 63 | 80 |
| World | 8793 | 120 | 233 | 2.9 | 1.7 | 5554 | 1218 | 1187 | 472 | 1403 | 2768 | 1745 |
Avoidable LLE and mortality were calculated by removing anthropogenic emissions in the model. Australia also includes other islands of Oceania. Data for all countries, including 95% uncertainty intervals, are given in the Supplementary material online, Tables (overall uncertainty about ±50%).
CEV, cerebrovascular disease; COPD, chronic obstructive pulmonary disease; IHD, ischaemic heart disease; LC, lung cancer; LLE, loss of life expectancy; LRI, lower respiratory infections; NCD, non-communicable diseases; YLL, years of life lost.
Excess mortality expresses the number of deaths over a given period that would not occur in the absence of exposure.
3.2 Age dependency
Figure 2 illustrates the age dependency of excess mortality, i.e. the relative distribution in 5-year intervals (and accumulated over a longer period of above 80 years). The proportion of excess deaths generally increases with age, but child mortality (<5 years) can be high in low-income countries, mostly in Africa and South Asia, and related to LRI. Figure 3 presents the relative contributions of disease categories to LLE. It demonstrates that cardiovascular diseases (CVDs) (CEV + IHD) plus the other NCD dominate excess mortality. While LRI contribute 13.8% to excess mortality globally, they make up 21.4% of LLE, influenced by childhood mortality. The relatively high incidence of CVD outcomes is consistent with recent analyses and partly related to previously unaccounted, indirect cardiovascular risks.19–22 For example, PM2.5-induced inflammation, oxidative stress, and vascular (endothelial) dysfunction probably contribute to the development of hypertension, diabetes, and atherosclerosis.23 It is likely that a large percentage of the other NCD contribute to CVD mortality, typically at an advanced age. Globally, NCD are the major cause of death, associated with hypertension, tobacco smoking, diabetes, and high cholesterol—and air pollution is likewise a leading risk factor.3,5
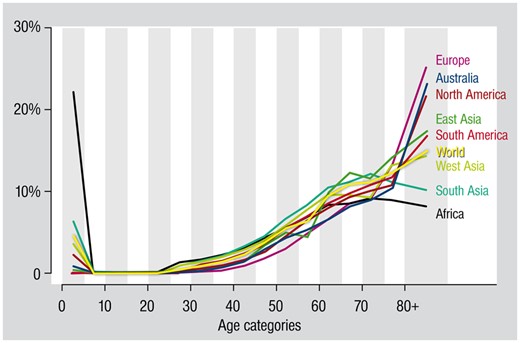
Age distribution of excess mortality from ambient air pollution. Globally, about 25% of the attributable mortality occurs at an age of <60 years: in Europe about 11% and in Africa about 55%.
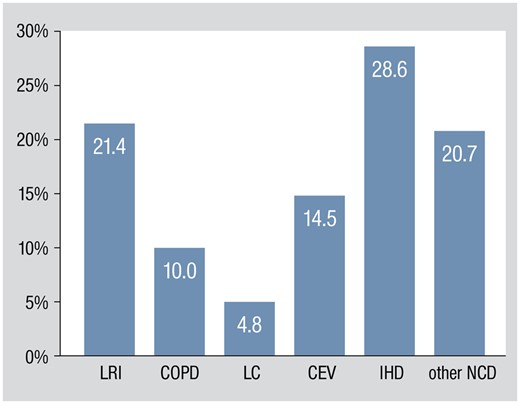
Percentage of global life expectancy loss from air pollution by different disease categories. CEV, cerebrovascular disease; COPD, chronic obstructive pulmonary disease; IHD, ischaemic heart disease; LC, lung cancer; LRI, lower respiratory infections; NCD, non-communicable diseases.
3.3 Comparing health risks
Figure 4 compares the LLE from different risk factors. Humans typically fear violence most, but rational evaluation shows that, only in exceptional cases (Syria, Afghanistan, Honduras, Colombia, and Venezuela), the associated mean LLE exceeds that from ambient air pollution. The leading air pollution source sector is fossil fuel use, which includes emissions from power generation, industry, traffic, and residential energy use. The residential source additionally involves biofuel use, which relatedly causes household air pollution (Figure 4). In India, for example, residential biofuel use is a main factor in both ambient and household air pollution.24 In China, on the other hand, a large part of the residential air pollution is from small-scale coal (hence fossil fuel) combustion.25,26 Since residential ambient and household pollution are not independent, the associated mortality is not additive.5,27 Relatively high red colour intensities in the upper left panel of Figure 4, compared to the other panels, shows in which areas the LLE from ambient air pollution exceeds that from tobacco smoking, mostly in low- and middle-income countries. While the prevalence of smoking decreased in the past decades, the total number of smokers increased due to population growth.28 In the same period, exposure to air pollution grew due to increasing population and emissions in low- and middle-income countries,29 as well as ageing and changes in non-communicable disease rates. The geographic distribution of risk factors is quite diverse, while many come together in Africa (Figure 4). The global mean life expectancy increased from 52 years in 1960 to 72 years in 2015 (and 80 years in high-income countries), but in many low-income countries, including sub-Saharan Africa, it is still below 60 years, which is unsurprising in view of the multiple health risks.30,31 We note that our LLE estimates for low-income regions are possibly lower limits, because air pollution-induced infant mortality may be higher than assumed.32
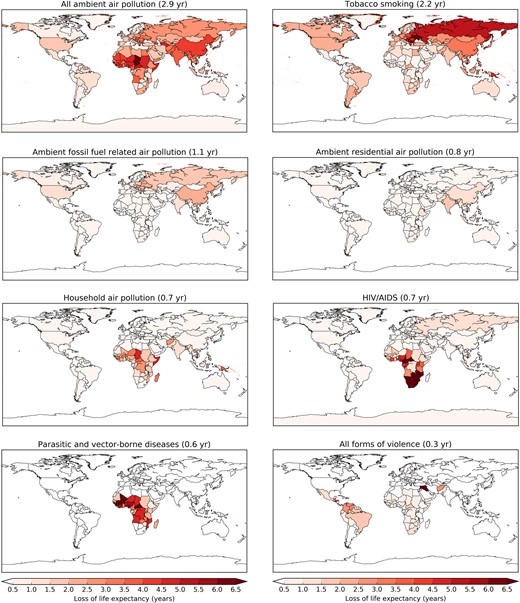
Mean global and country-level loss of life expectancy from different causes of death referring to the year 2015. Household air pollution is from the indoor use of solid biofuels. Ambient residential air pollution is mostly from household sources and can include fossil and biofuel use. Parasitic and vector-borne diseases include malaria, leishmaniasis, rabies, dengue, yellow fever, and others. Violence includes interpersonal, collective conflict, and armed intervention.
3.4 Avoidable mortality
Finally, we calculated to what extent LLE from ambient air pollution could be reduced by removing the avoidable anthropogenic emissions in our atmospheric model. We find that the global LLE of 2.9 (2.3–3.5) years (Table 1) could be reduced by 1.7 (1.4–2.0) years through the removal of all potentially preventable anthropogenic emissions and by 1.1 (0.9–1.2) years through the removal of fossil fuel-related emissions alone. This corroborates that fossil fuel-generated air pollution qualifies as a major global health risk factor by itself. We reiterate that non-preventable pollution sources should be distinguished in view of policy making, mostly aeolian dust and natural wildfires, the latter being about 10% of global biomass burning. Because of the large geographic diversity in emissions, our results indicate major regional differences. In East Asia, 3.0 (2.5–3.5) of the 3.9 (3.2–4.6) years LLE could potentially be prevented, whereas in Africa, where population growth is rapid and aeolian dust predominates, it is merely 0.7 (0.5–0.9) of 3.1 (2.3–3.8) years. Contrasts can thus be very large. In the USA and China, up to 80–85% of the LLE is preventable through the control of anthropogenic emissions, whereas in Nigeria and Egypt, it is 16–17%. It should be emphasized that additional LLE can be avoided, both generally and specifically from air pollution, by improving health care.
4. Discussion
4.1 Major health risk
While in some parts of the world air quality remains to be poor, notably in low- and middle-income countries, in other regions, such as North America, Europe, and most recently China, pollution emissions have decreased. Then, why do attributable mortality rates continue to be so high, and why has air pollution advanced into one of the major public health risk factors worldwide? The answer is fourfold. First, the GEMM accounts for other NCD that were not considered in previous analyses, in line with growing evidence that air pollution aggravates NCD risks such as diabetes and hypertension. Second, there is increasing support for larger than previously assumed health impacts at very low and very high PM2.5 concentrations, which are better represented by the GEMM than hazard functions of former GBD assessments.6,33 Third, in many low- and middle-income countries, population numbers and industrial and traffic-related pollution levels continue to grow. Fourth, NCD, in particular CVD, have become a major cause of death, accompanying the overall increasing life expectancy. Air pollution particularly aggravates chronic health risks, and the extended exposure takes its toll later in life. However, while the rate of attributable NCD mortality increases, the associated LLE typically changes less due to improvements in health care. Therefore, mortality estimates should be interpreted with caution and complemented by YLL and LLE estimates.
4.2 Mortality metrics
The GEMM can be used to estimate how many deaths could be avoided per year if the population were exposed to a lower counterfactual level than current, ambient concentrations of air pollution. Since separate risk functions are derived for age categories, the GEMM additionally incorporates the age structure of the population. When mortality is attributed to a risk factor such as air pollution, the relationship is statistical but not distinctive (unlike car accidents where excess mortality relates to persons who can be identified). To do justice to these differences, we provide several complementary metrics, i.e. excess mortality, YLL, and LLE. While excess mortality (sometimes indicated as premature mortality) is often used as a comparative measure to quantify health risks, the regional diversity among total and per capita mortality, LLE and YLL (Table 1), influenced by the prevalence of other risk factors and health care, shows that there is no single best metric. One could argue, for example that, for smoking the excess mortality (individual exposure) and for air pollution, the LLE (population exposure) is more suitable.
4.3 Limitations and uncertainties
We emphasize that the methodology used with the GEMM is the same as for the health effects of active smoking, obesity, and so on. Hence, whatever limitations are relevant for outdoor air pollution, they also apply to other risk factors like smoking. Although clinical and public health research has uncovered unambiguous associations between air pollution, disease, and mortality, even at very low levels of exposure,5,33 continued studies are needed to disentangle the physiological mechanisms, causes, and effects. For example, the harmfulness of different types of particles, individually and in mixtures, is not well understood.34,35 The GEMM assumes that PM2.5 toxicity does not significantly depend on the sources and chemical composition, which is a simplification that requires further investigation. While previous studies of exposure–response formulations assumed counterfactual (i.e. potential outcome) uncertainty distributions, in the GEMM, this dependency has diminished by directly deriving the shape of the exposure–mortality association from very low to high levels of air pollution, being accounted for in several of the 41 cohort studies analysed by Burnett et al.6
Our calculations of mortality from air pollution include 95% CI estimates, which represent uncertainty related to the data used in the calculations. The Supplementary material online, Excel Tables present excess mortality, YLL, and LLE for all countries, for different disease categories, and their 95% CI’s are given by the mean, minimum, and maximum values. We reiterate that the 95% CI refers to uncertainty in the parameters used in the attribution calculations. There can be additional uncertainty from incomplete knowledge, i.e. epistemic uncertainty. This includes model assumptions for counterfactuals, unaccounted confounding factors, misclassification of health, and other data, or limited representativeness of hazard functions as they rely on data from a relatively small number of countries (16 countries). Confounder uncertainty can be associated with over- as well as underestimates, either by over-attributing air pollution deaths to disease categories, as well as neglect of air pollution impacts on diseases that are not, but should be accounted for. For example, it is conceivable that air pollution worsens smoking-related health effects. It should be noted that the excess mortality estimated for the disease category ‘other NCD’ (Table 1, Figure 3) is associated with larger uncertainty than LRI, COPD, LC, CEV, and IHD, as the number of deaths is not necessarily additive due to competing health risks. The NCD + LRI group represents the total impact of PM2.5 on mortality and LLE. Specific causes of death are reported separately to indicate their contributions to the total. Ideally, an additional GEMM should be developed with a competing R(z) mode.
4.4 Differential toxicity of particles
Generally, the exposure calculations contribute relatively little to uncertainty, being dominated by the attribution calculations. However, this may not hold if PM2.5 toxicity significantly depends on source categories and chemical composition, implying that exposure would be less well characterized than assumed. While epidemiological studies have not identified source categories that distinctively affect the health impacts of fine particulates,3,5 toxicological investigations have reported that exhaust particles from diesel engines are relatively more toxic than from gasoline engines, followed by biomass burning, coal combustion, and road dust particles, all being significantly more hazardous than ammonium sulphate and nitrate—and also suggesting that different PM2.5 mixtures influence different diseases.36 For example, we have estimated that globally about 5% of mortality is attributable to biomass burning,7 which amounts to about 440 000 excess deaths per year. However, it is conceivable that organic particles are significantly more toxic than inorganic ones7; if this was true, the global excess mortality from biomass burning smoke may add up to about 630 000 per year. Although it is unclear to what extent the toxicological studies are representative for morbidity and mortality in human populations, especially for long-term exposure,36 it cannot be excluded that various particle sources have different impacts. Furthermore, there is discussion about harmfulness related to particle size. Fine particulates, PM2.5, are believed to be a more important health concern than course particles up to 10 µm in diameter (PM10), as the smaller ones penetrate more deeply into the lungs with a low probability to be exhaled.
Experimental studies have corroborated that PM2.5 provides a good approximation for the extended exposure of the human respiratory tract to particulate pollution.37 However, there remains concern that ultrafine particles with a diameter of smaller than 0.1 µm (PM0.1) could be particularly harmful, as they can directly pass into the bloodstream and affect other organs.38 It has been observed that specifically the smallest fraction of PM0.1, with a diameter of below about 30 nm, can directly translocate into the circulatory system and accumulate at sites of vascular inflammation.39 Nevertheless, two meta-studies on the health effects of ultrafine particles concluded that the available evidence does not indicate that PM0.1 is relatively more hazardous, or at least that there is no conclusive support for it but do emphasize the need for continued studies, in particular of the long-term health effects.37,40 In view of this, especially regarding differential toxicity in terms of particle composition and size, it seems probable that the overall uncertainty of our mortality and life expectancy calculations is larger than the 95% CI; we estimate it at approximately ±50%.8,10
5. Conclusion
Our comparison of different global risk factors shows that ambient air pollution is a leading cause of excess mortality and LLE, in particular through CVDs. Globally, the LLE from air pollution surpasses that of HIV/AIDS, parasitic, vector-borne, and other infectious diseases by a large margin. It exceeds the LLE due to all forms of violence by an order of magnitude and that of smoking by a third. Nonetheless, one could argue that tobacco smoking can be entirely avoided. The removal of anthropogenic air pollution emissions can merely avoid about 25–80% of LLE, i.e. within a large range, depending on the local role of natural emissions (e.g. aeolian dust), but with substantial potential for mortality reduction through the improvement of health care, especially in low-income counties. The fraction of avoidable LLE from anthropogenic air pollution that can be attributed to fossil fuel use is nearly two-thirds globally, and up to about 80% in high-income countries.
Acknowledgements
We thank the Mainz Heart Foundation for continuous support. T.M. is the principal investigator of the DZHK (German Center for Cardiovascular Research), Partner Site Rhine-Main, Mainz, Germany. We also thank the International Scientific Partnership Program of the King Saud University for supporting the research.
Conflict of interest: none declared.
References
GBD 2015 Risk Factors Collaborators.
World Health Organization. Global Health Observatory. http://www.who.int/gho/en/ (9 January
United Nations. World Humanitarian Data and Trends 2018, UN, New York,
World Bank. Life Expectancy at Birth. https://data.worldbank.org/indicator/sp.dyn.le00.in (9 January
HEI Review Panel on Ultrafine Particles.
