


Abstract
Autophagy is a highly conserved recycling mechanism essential for maintaining cellular homeostasis. The pathophysiological role of autophagy has been explored since its discovery 50 years ago, but interest in autophagy has grown exponentially over the last years. Many researchers around the globe have found that autophagy is a critical pathway involved in the pathogenesis of cardiac diseases. Several groups have created novel and powerful tools for gaining deeper insights into the role of autophagy in the aetiology and development of pathologies affecting the heart. Here, we discuss how established and emerging methods to study autophagy can be used to unravel the precise function of this central recycling mechanism in the cardiac system.
1. Introduction
Autophagy is an evolutionarily conserved mechanism driven by autophagy-related (ATG) proteins devoted to the intracellular recycling of almost every cytoplasmic element, such as senescent organelles and unfolded proteins.1–5 Three major types of autophagy exist: macroautophagy, microautophagy, and chaperone-mediated autophagy (CMA). Macroautophagy refers to the formation of double-membrane vesicles called autophagosomes that engulf damaged, dysfunctional and redundant proteins, and organelles. Sequestered cargo is then delivered to lysosomes for its degradation. Depending on the cargo that is degraded, macroautophagy can be classified into several subtypes, including mitophagy for mitochondria, lipophagy for lipid droplets (LDs), or ERphagy for endoplasmic reticulum (ER).2–6 Microautophagy involves the direct engulfment of cytoplasmic cargo by lysosomes or vacuoles (in yeast and plants).7,8 Although generally considered to be a non-selective process, microautophagy is also cargo-specific. Several types of selective microautophagy have been identified: micropexophagy (for peroxisomes),9 micromitophagy (for mitochondria),10 microlipophagy (for LDs),11 and piecemeal microautophagy (for nucleus portions).12 The third pathway is CMA, which entails the recognition of soluble proteins bearing a KFERQ-like amino acid sequence by the chaperone heat shock cognate 70 (HSC70). The targeted protein is translocated across the lysosomal membrane for degradation with the assistance of the CMA receptor, lysosome-associated membrane protein type 2A (LAMP-2A).13 Autophagy contributes to the maintenance of cellular functions and survival in both lower organisms, plants, and mammals under basal conditions. Furthermore, this recycling mechanism ensures quality control and regulates the synthesis of new cellular components by providing amino acids, fatty acids, and sugars obtained from the turnover of superfluous cellular constituents. Recent evidence indicates that autophagy may also regulate cellular secretion and intracellular trafficking of specific cellular molecules.2–6 In addition, all autophagic pathways can be modulated under stress conditions. It has been demonstrated that a plethora of different stress stimuli (e.g. nutritional, metabolic, chemical, physical, etc.) can affect macroautophagy, microautophagy, and CMA regulation.8,14–16
Amongst the different subtypes of macroautophagy, mitophagy is the best characterized form of selective macroautophagy, and is responsible for the degradation of redundant or damaged mitochondria via their sequestration into autophagosomes.17–19 By maintaining the mitochondrial quality control, mitophagy helps to preserve cellular energy production and overall cell function and viability. Mitophagy is typically activated following hallmarks of mitochondrial damage: membrane potential (ΔΨm) collapse, reactive oxygen species (ROS) production, and low ATP levels. Changes in mitochondrial dynamics represent the first step in response to mitochondrial damage, and it is thought that mitochondrial fragmentation is a prerequisite for mitophagy to occur.17–19 Mitochondrial fusion and fission processes are mediated by different protein subsets. For instance, dynamin-related protein 1 (DRP1) and its adaptor proteins human fission protein (hFIS), mitochondrial dynamics proteins (MID49 and MID51), and mitochondrial fission factor (MFF) regulate mitochondrial division, while mitofusins 1 and 2 (MFN1, MFN2), and optic atrophy protein-1 (OPA1) control mitochondrial fusion.20–27 Thus, proteins that regulate mitochondrial dynamics also play essential roles in autophagy, and both in vitro and in vivo models have confirmed that mitochondrial dynamics and mitophagy are indeed highly integrated processes.18,24,28,29 Regarding the molecular effectors driving mitophagy, defective or senescent mitochondria are selectively targeted for degradation either through pathways that can be dependent or independent on PTEN-induced putative kinase1 (PINK1)-Parkin. PINK1/Parkin-independent mitophagy may constitute an adaptation to chronic Parkin loss and is mediated, in part, by mitochondrial BCL2 Interacting Protein 3 Like L (NIX/BNIP3L) that can directly bind to microtubule-associated protein 1A/1B-light chain 3 (MAP1LC3; best known as LC3) to form the mitophagosome.2,6,30 Studies suggest that the PINK1/Parkin-dependent pathway primarily functions as an inducible stress-response mechanism in the adult heart.31 Indeed, loss of ΔΨm results in the stabilization and accumulation of PINK1 at the mitochondria. PINK1 then phosphorylates the outer mitochondrial membrane (OMM) fusion protein MFN2 and promotes its ubiquitination by recruiting the E3 ubiquitin ligase Parkin onto the OMM, thereby initiating mitophagic clearance.24,32
Lipid autophagy (lipophagy), another subtype of macroautophagy, is involved in the catabolism of LDs, including neutral lipids (i.e. triglycerides, cholesterol).33 Lipophagy is characterized by the engulfment of small LDs or portions of large LDs by autophagosomes, which in turn deliver the lipid cargo to lysosomes, where it is degraded. Degradation products, such as non-esterified free fatty acids (FFAs), are then released into the cytoplasm and reused for other cellular purposes. Lipophagy plays a pivotal role in the regulation of lipid accumulation as well as in lipid homeostasis control.34 Although lipophagy was first described in the liver, it is now clear that it occurs in many other types of tissues and cells including neurons. This process is induced during fasting and is deregulated in numerous human pathologies, such as liver and neurodegenerative diseases and cancer.35–37 For example, previous work showed that the absence of Toll-interacting protein (Tollip), an innate immune molecule involved in the formation of autolysosomes, deregulates lipophagy and intensifies liver steatosis and atherosclerosis in mice.38 Several studies also revealed that lipophagy is involved in lipid synthesis, LD biogenesis, and adipogenesis. Uchiyama and colleagues demonstrated that the Atg conjugation system is critical for lipid synthesis and LD development in liver cells and cardiac myocytes. Moreover, in mice with liver ATG7 deficiency, a defective LC3 conjugation inhibited LD formation.39,40 Besides, mice with (global) ATG5- and adipose-specific ATG7-deficiency presented a reduction of adipose mass; depletion of Atg5 or Atg7 significantly inhibited adipocyte differentiation in 3T3-L1 cells and mouse embryo fibroblasts.41–43 These results suggest that lipophagy regulates lipid accumulation in adipose tissue and controls adipocyte differentiation. Altogether, these data indicate that lipophagy prevents excess lipid accumulation and modulates lipid metabolism; for these reasons, we could assume that lipophagy should be a promising target for the treatment of cardiometabolic diseases such as atherosclerosis.36
Given these findings, one might expect that compromised autophagy and specific forms of macroautophagy are associated with the development of human diseases. In fact, defects in autophagy contribute to the development of cancer, neurodegenerative disorders, excessive lipid accumulation and metabolic defects, or inflammatory disorders. Moreover, autophagy is progressively altered in old age, obesity, and metabolic syndrome, which likely contributes to the abnormalities typically associated with these conditions.2–6
Along similar lines, alterations in the CMA pathway have extensively been tied to human diseases. In this regard, it is well known that CMA is required for the maintenance of cellular energetic balance via the finely tuned regulated degradation of enzymes involved in major metabolic routes and through the timely removal of structural proteins from the surface of LDs.44 Thus, it is not surprising that selective blockage of CMA alters cellular ATP levels and results in aberrant lipid accumulation and metabolic dysregulation.45 As CMA declines with age, this may contribute to increased susceptibility to stress in aging individuals and worsen age-related disorders.46,47 Furthermore, it has been shown that deficient CMA activity due to aging negatively affects the adaptive immune system.48 Reduced CMA activity has also been reported after high-fat/high-cholesterol diets49 and in several metabolic disorders, such as diabetes mellitus.50 The rising expansion of the western diets and the fact that our societies tend to have an increasing number of elderly leads to a growing interest in understanding the role of CMA in cardiac disease (CD).
The purpose of this review is to discuss the evidence on the role of different forms of autophagy in the regulation of heart function and to describe the state-of-the-art approaches to study autophagy in cardiac pathophysiology. In particular, we will comprehensively discuss new tools and genetically modified animal models available for the investigation of the activity and function of autophagy/mitophagy and CMA during cardiac stress.
2. The role of autophagy in the heart
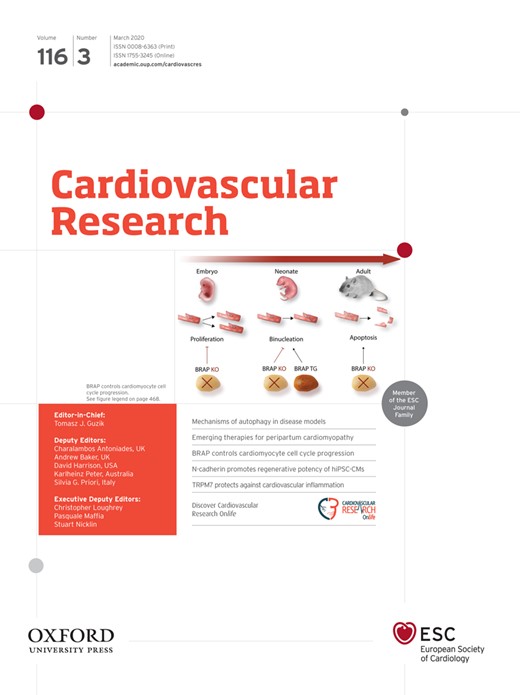
Autophagy plays unique, tissue-specific roles in maintaining homeostasis. In the recent years, a number of studies have demonstrated that autophagy is a major factor in the regulation of cardiac homeostasis under basal conditions and during cardiac adaptation to stress (Figure 1).20 An overview of the role of autophagy in different cardiac conditions is outlined below.
Autophagy and CD. Different stressors such as ischaemia, hypoxia, oxidative stress, and metabolic dysregulation are known to affect non-selective general autophagy, mitophagy, chaperone-mediated autophagy and autosis, which in turn will adversely impact cardiac function to cause CD. Model depicts a converging paradigm wherein loss or exacerbation of distinct forms of autophagy results in the development of CD.
2.1 Autophagy: baseline vs. aging
Growing lines of evidence suggest that autophagy plays a pivotal role in preserving cardiac structure and function. Mice with inducible cardiomyocyte-specific Atg5 gene deletion display contractile dysfunction and left ventricular dilation, along with early mortality. At the cellular level, Atg5-deleted cardiomyocytes exhibit protein aggregation and mitochondrial dysfunction51 that likely contribute to heart failure. Autophagy is also required for delaying cardiac aging. Indeed, age-associated progressive loss in autophagic activity contributes to the development of cardiac senescence, hypertrophy, and diastolic dysfunction.22 Conversely, systemic overexpression of Atg5 and expression of a gain-of-function mutation of Beclin 1 increase levels of autophagy and extend lifespan in mice while reducing age-related cardiac fibrosis.23,52 In accordance with these data, it was also recently demonstrated that administration of spermidine, a natural polyamine, significantly reduces cardiac aging and extends lifespan through autophagy activation. In fact, when administered to cardiac-specific Atg7 knockout mice, spermidine failed to confer cardioprotection, indicating that this benefit is mediated via autophagy.24 Spermidine induces autophagy by inhibiting the activity of the acetyltransferase adenovirus early region 1A (E1A)-binding protein p300 (EP300),53,54 a major repressor of autophagy.55 Autophagic clearance of mitochondria also appears to be reduced during aging. A reduction of p53-induced Parkin translocation to mitochondria represents one of the mechanisms underlying this mitophagy defect.24 Consistent with this idea, overexpression of Parkin has been shown to reduce age-associated cardiac abnormalities.25
2.2 Autophagy in myocardial ischaemia and reperfusion
Cardiac tissue is exquisitely sensitive to ischaemia resulting from atherosclerotic blockage and/or thrombotic occlusion in one or more coronary arteries, a major cause of mortality worldwide. Autophagy and mitophagy each play pivotal roles in cellular homeostasis and adaptation to injury in the heart.20 Studies of CDs in animal models have shown that activation of autophagy in myocardium limits cardiac senescence, ischaemic injury, chronic cardiac remodelling, genetic cardiomyopathy, and heart failure.52,56–58 Similar beneficial effects are elicited when mitophagy is stimulated.59 During an ischaemic episode, activation of autophagy promotes quality control by degrading dysfunctional mitochondria and lowering ROS levels. Induction of autophagy also provides substrates for ATP production and thereby sustains cellular energy levels.2–6 Evidence for this notion comes from studies showing that cardiac-specific overexpression of a dominant-negative form of 5' AMP-activated protein kinase (AMPK) or forced activation of mechanistic target of rapamycin complex 1 (mTORC1), through the overexpression of Ras homologue enriched in brain (RHEB), each inhibited autophagy and significantly exacerbated myocardial injury following prolonged ischaemia without reperfusion.26,27 Similarly, cardiac-specific deletion of Nox4, a nicotinamide adenine dinucleotide phosphate (NADPH) oxidase isoform, showed impaired autophagy activation during ischaemia and increased ischaemic injury.28
While much is known about autophagy during ischaemia, the role of autophagy activation during reperfusion is largely unclear. When compared to ischaemic injury, reperfusion injury is mediated by distinct pathophysiological mechanisms. Generally, during reperfusion, a marked accumulation of ROS is observed, contributing to the progression of myocardial injury. It has been shown that autophagy is stimulated during reperfusion through Beclin 1-dependent mechanisms.26 Accordingly, mice with systemic heterozygous Beclin 1 gene deletion displayed a significant reduction in ischaemic injury suggesting that Beclin 1-dependent upregulation of autophagy is deleterious during reperfusion.26 Consistent with this hypothesis, partial glycogen synthase kinase-3β (GSK3β) inhibition reduced ischaemia/reperfusion injury via mTOR-dependent suppression of autophagy.29 In contrast, pharmacological inhibition of histone deacetylases decreased ischaemia/reperfusion injury through autophagy stimulation.30 Nevertheless, Ma et al.31 reported that autophagosomes accumulate in the heart in response to reperfusion injury as a result of the concomitant impairment in autophagic flux and increased autophagosome formation due to Beclin 1 induction. The authors showed that, beyond its primordial function in the initiation of the autophagic cascade, Beclin 1 expression can also be associated with a decrease in total LAMP-2 levels resulting in reduced autophagosome-lysosome fusion. Surprisingly, heterozygous Beclin 1 gene deletion normalized autophagosome levels, likely by supporting the efficient clearance of autophagosomes, and reduced reperfusion injury. All in all, the precise role of autophagy in ischaemia/reperfusion injury remains under debate.
As previously discussed, the physiological level of autophagy activation in basal conditions or following an acute pathologic insult is generally considered cardioprotective. However, excessive or uncontrolled levels of autophagy activation possibly trigger cardiac cell death in some circumstances, thus contributing to myocardial injury.20 The so-called ‘autophagy-dependent cell death’ is a type of regulated cell death that relies on the autophagic machinery (or components thereof) as defined in the latest nomenclature for cell death guidelines.60 For instance, cardiac cell death is attenuated by autophagy inhibition in some stress conditions including ischaemia/reperfusion,26 pressure overload,21 and doxorubicin-induced cardiomyopathy,61 implicating a detrimental role of autophagy in the heart. Doxorubicin, a member of anthracyclines molecule class, has been used for a long time as an anti-neoplastic drug because of its ability to intercalate with DNA and inhibit topoisomerase II. Unfortunately, the therapeutic efficacy of doxorubicin is limited by its severe side effects, particularly on the myocardium, resulting in arrhythmias, ventricular dysfunction, and heart failure. Doxorubicin-induced cardiotoxicity is mostly caused by oxidative and ER stress, lipid peroxidation, calcium deregulation, and inhibition of the autophagic flux that leads to accumulation of autophagosomes/autolysosomes and undegraded material.62–64 However, whether autophagy really contributes to cardiomyocyte death is still controversial. Equally elusive are the morphological or biochemical features of cell death induced by autophagy. Recently, Dr Levine’s group provided evidence that excessive autophagy induces a unique type of autophagic cell death with characteristic morphological and biochemical features. This form of cell death, specifically relying on the Na+/K+-ATPase, was termed autosis.65 Consistent with the physiological relevance of this process, administration of Na+/K+-ATPase inhibitors, such as cardiac glycosides, confers neuroprotection in a rat model of neonatal hypoxia–ischaemia.65
There is consensus that mitochondrial clearance limits ischaemia/reperfusion injury in the heart. Mice with cardiac-specific heterozygous deletion of DRP1, a mitochondrial fission protein, showed an increase in ischaemia/reperfusion injury that correlated with mitochondrial dysfunction and inhibition of mitophagy.32 Similarly, mice knocked-out for the mitochondrial protein phosphoglycerate mutase family member 5 (PGAM5), accelerated necroptosis in the heart following ischaemia/reperfusion injury. This effect occurred through the inhibition of mitophagy that caused mitochondrial abnormalities and oxidative stress.66
In accordance with its role as a stress-response mechanism, CMA has been shown to be activated during hypoxia/ischaemia and oxidative stress thus contributing to cell survival during these conditions.67,68 Consequently, it is plausible that changes in CMA (e.g. its decline associated with aging) may impact cardiac function in response to ischaemic and/or oxidative insults.
2.3 Autophagy during CD
Numerous studies have demonstrated that autophagy is necessary for the ability of the heart to respond to mechanical stress. Mice with cardiac-specific Atg5 gene deletion displayed cardiac hypertrophy, left ventricular dilation, and contractile dysfunction when subjected to transverse aortic constriction.51 This functional decline was paralleled by increased protein ubiquitination, disorganized sarcomere, and accumulation of dysfunctional mitochondria in the heart.51 Indeed, partial activation of autophagy during severe mechanical stress is beneficial. In fact, Zhu et al.21 demonstrated that cardiac overexpression of Beclin 1 accentuates pathologic remodelling whereas heterozygous deletion of Beclin 1 gene blunts this process in mice subjected to severe pressure overload. It is now largely accepted that, during chronic ischaemic remodelling, autophagy activation exerts protective effects. Consistent with this notion, activation of autophagy by deleting mammalian STE20-like kinase 1 (Mst1) gene reduced infarct size, cardiac dysfunction, and dilation in response to chronic myocardial infarction.69 Trehalose, a natural disaccharide synthesized by simpler organisms and previously described as an autophagy inducer, is able to reduce chronic cardiac remodelling induced by myocardial infarction. These effects are autophagy-dependent since the beneficial effects of trehalose were in part attenuated in Beclin 1+/− mice.58 Aspirin is also an important drug for the secondary prevention of CD, reducing both the risk of CD and mortality.70,71 Interestingly, it was recently reported that aspirin and its active metabolite salicylate trigger autophagy via the inhibition of the EP300 activity, suggesting a novel molecular mechanism underlying the pro-health effects of these compounds.72
As one might expect, the benefits of autophagy in preventing chronic cardiac stress are mediated in part through mitophagy. In agreement with this idea, mice with cardiac-specific Drp1 gene knockout display impaired mitophagy in response to pressure overload and develop mitochondrial dysfunction, cardiac hypertrophy, and heart failure.73 Mitophagy is also involved in cardiac hypertrophy after myocardial infarction. Indeed, Kubli et al.74 demonstrated the presence of cardiac hypertrophy and larger infarct sizes in Parkin-deficient mice after myocardial infarction. Accordingly, wild-type animals were characterized by increased Parkin expression and stimulation of mitophagy in areas bordering the myocardial infarct. Interestingly, autophagy-mediated mitochondrial turnover/quality control is important to reduce the amount of mitochondrial DNA released from the injured tissue, which is thought to drive myocardial inflammation and heart failure during mechanical stress.75
2.4 Autophagy and metabolic cardiomyopathy
Several studies have investigated the impact of diabetes on autophagy in the heart. The majority of these studies have demonstrated that metabolic alterations impact cardiac autophagy at multiple steps.76 Under pathological conditions, cardiac autophagy and mitophagy are both inhibited in models of diabetes and metabolic syndrome, likely with deleterious consequences.27,77 Decreased myocardial autophagy was reported at basal levels and in response to ischaemia in mice fed with high-fat diet (HFD). A reduction of cardiac autophagy was also detected in the heart of hypercholesterolaemic pigs.78,79 Reactivation of autophagy via rapamycin administration partially rescued the deleterious effect of HFD on ischaemic injury.27 Levine and Mentzer labs each observed a significant reduction in autophagosome formation in mice with HFD-induced obesity.80–82 Other studies corroborated these findings by demonstrating that HFD inhibits autophagosome formation in the heart, which can be reversed by a number of interventions including macrophage migration inhibitory factor (Mif) gene disruption,83 overexpression of catalase,84 and ablation of the toll-like receptor 4 (Tlr4) gene.85 Consistent with this notion, cardiac autophagic flux is impaired in hearts of mice with type II diabetes. Indeed, autophagosome clearance is significantly suppressed in hearts of mice fed with HFD.86 Similarly, autophagosome maturation was found to be impaired in obese mice due to AKT2-dependent mTOR activation,87 a well-established inhibitor of autophagy. Both type I and type II diabetes are associated with reduced cardiac autophagy. However, the functional consequence of such impairment remains under-explored.
Since AMPK activity leads to induction of autophagy, numerous studies have explored the effect of AMPK on cardiac function and found that AMPK activation improves cardiac function by reactivating autophagy in the heart.77,88 The mechanisms through which this occurs remain unclear, but it may involve improved fuel utilization and fuel-type switch in the face of acute myocardial injury. There are contrasting studies suggesting that decreasing levels of a subset of autophagy proteins protects against diabetic cardiomyopathy. For example, overexpression of Beclin 1 exacerbates diabetic cardiomyopathy, while inhibiting Atg16 gene attenuates cardiac derangements in mice with type I diabetes. Surprisingly, inhibition of Atg16 gene expression restores mitophagy (likely in an ATG16-independent manner) in diabetic mice through the upregulation of PINK1 and Parkin, suggesting that stimulation of mitophagy could be a potential therapeutic approach against diabetic cardiomyopathy.89
CMA selectively degrades not only enzymes involved in carbohydrate and lipid metabolism but also proteins important for mitochondrial homeostasis.90 Indeed, CMA activity is compromised in mice with HFD-induced obesity.49 The decline in CMA activity in these lipogenic stress conditions is due to changes in the lipids at the lysosomal membrane, resulting in decreased stability of the CMA receptor LAMP-2A. Interestingly, these HFD-triggered changes of the lysosomal membrane composition resemble those observed in aging.49 Given the metabolic relevance of this autophagic pathway, the role of CMA in cardiomyocytes is currently the focus of investigation.
2.5 Mutations in human ATG genes associated with CD
Several mutations in genes linked to or required for autophagy and lysosomal function are associated with the development of CDs. Among them, the mutation in the LAMP-2 gene that causes Danon’s cardiomyopathy is perhaps the best characterized one.91,92 In this regard, the pathological hallmark of the disease is the accumulation of intracytoplasmic vacuoles containing autophagic material and glycogen in skeletal and cardiac muscle cells. Recessive mutations in Ectopic P-Granules autophagy protein 5 homologue (EPG5), a key factor implicated in the autophagolysosomal fusion and maturation of autolysosomes, play a causative role in Vici syndrome.93,94 This is a recessively inherited multisystem disorder characterized by callosal agenesis, cataracts, hypopigmentation, cardiomyopathy, psychomotor retardation, and immunodeficiency with cleft lip and palate. Mutations in GBA1, gene encoding the lysosomal enzyme glucocerebrosidase, result in defects in autophagic-lysosomal function. GBA1 loss of function is responsible for the Gaucher’s disease, in which glucocerebroside accumulates in cells and organs. Gaucher’s disease type 3C is also defined as the cardiovascular form; cardiovascular abnormalities consist of calcification of the ascending aorta and of the aortic and mitral valves, leading to reduced lifespan.95 From a cardiometabolic point of view, a recent study identified single-nucleotide polymorphisms in several autophagy genes, such as ATG7, MAP1LC3A, ATG3, ULK1, or different ATG4s, associated with alterations in systolic and diastolic blood pressure and coronary artery disease.96 Moreover, exclusive DNA sequence variants of ATG7 gene promoter have been recently found in acute myocardial infarction patients.97
3. Methods for the assay of different forms of autophagy
In the following sections, several techniques useful for the adequate and precise study of the different forms of autophagy are described (Table 1).
Methods for the assay of different forms of autophagy
| Form of autophagy assayed | Method | Sensor/marker | Features observed | Limitations |
|---|---|---|---|---|
| Non-selective general autophagy | Electron microscopy | – |
| Subject to artefacts, large number of replicates required |
| Fluorescence microscopy | GFP-LC3 | GFP-LC3 puncta indicative of autophagosome levels | Aggregates formation, GFP fluorescence quenched at low pH (no information on autophagy flux) | |
| mRFP-GFP-LC3 | Green and red fluorescent puncta indicate autophagosomes, red-only puncta indicate autolysosomes | – | ||
| GFP-LC3-RFP-LC3ΔG | GFP/RFP ratio indicates autophagic flux | Poor time resolution | ||
| DAPGreen/DALGreen | Enhanced fluorescence under lipophilic (DAPGreen) or acidic (DALGreen) conditions | |||
| Western Blot | LC3-II | LC3-II levels and turnover directly correlate with the autophagic flux/activity | Assess in the presence and absence of lysosomal inhibitors | |
| p62 | p62 levels inversely correlate with the autophagic flux/activity | p62 levels are also transcriptionally regulated; p62 can be degraded by the proteasome | ||
| Mitophagy | Electron microscopy | – | Individual mitochondria engulfed by autophagosomes or autolysosomes | Non-quantitative due to limited number of sections, large sample variability |
| Fluorescence microscopy | Mito-Keima | Ratio between green (mitochondria) and red fluorescence (lysosomes) | Fixation disrupts the lysosomal pH, excitation spectra partially overlap | |
| Mito-Timer | Shift from green to red fluorescence over time | – | ||
| Mito-QC | Predominant red fluorescence upon mitophagy induction | – | ||
| Co-labeling for GFP-LC3 or lysosomes and mitochondrial proteins | Colocalization of mitochondria with autophagosomes and/or lysosomes | Mitochondrial degradation confirmed upon addition of lysosomal inhibitors, GFP-LC3 aggregation | ||
| Assessment of mitochondrial mass by western blot and real time PCR | Levels of mitochondrial proteins, mitochondrial-to-nuclear DNA ratio | Altered levels of mitochondrial proteins and mtDNA | Some mitochondrial proteins are degraded through proteasome or CMA; mtDNA levels may change due to alterations in mitochondrial biogenesis | |
| Chaperone-mediated autophagy | Fluorescence microscopy | KFERQ-Dendra2 | Fluorescent puncta indicative of CMA activity | Indicates only the binding step in the CMA pathway |
| Co-staining for HSC70 and LAMP-2A | Indicates the number of CMA active lysosomes | |||
| Western blot | LAMP-2A | Lysosomal LAMP-2A levels are proportional to CMA activity | CMA activation may occur without de novo synthesis of LAMP-2A | |
| Lysosomal uptake of CMA substrates | The amount of translocated substrate is proportional to CMA activity | |||
| Metabolic labeling | Radio-labelled proteins | Accumulation of radio-labelled proteins with inhibitors of lysosomal proteases or macroautophagy | CMA and microautophagy cannot be differentiated | |
| Autosis | Electron microscopy | – | Intense vacuolization, swelling of the perinuclear space, nuclear concavity | Nuclear concavity may also appear in other cell types (i.e. endothelial cells) |
| Fluorescence microscopy | Nuclear staining | Nuclear concavity | Nuclear concavity may also appear in other cell types (i.e. endothelial cells) | |
| Fluorescence microscopy | ER proteins immunostaining | ER fragmentation | Not a definitive marker of autosis |
3.1 Non-selective general autophagy
In the 1950s, autophagy and lysosomal biology were largely studied at the morphological/ultrastructural level by electron microscopy (EM) or at the biochemical level by determining the degradation of long-lived proteins.98 In the 1990s, ATG molecules were identified using simpler systems (yeast cells) and genetic approaches, and since then, the analysis of autophagy has undergone significant advances. In principle, given that autophagic degradation is a highly dynamic process, and because of differences in the rates of cargo degradation across different cell types and in response to various stressors, the assessment of autophagy requires the measurement of autophagic flux involving the use of lysosomal inhibitors. Nevertheless, given the dynamic nature of the autophagic process, multiple complementary approaches should be considered for its evaluation. A common strategy is to estimate the number of autophagosomes by observing and quantifying their number. However, the net/steady-state level of autophagosomes in a given moment is the balance between the rate of their generation and degradation. This underscores the need for measuring the complete flux for accurate assessment of autophagy activity. Monitoring the number of autophagosomes is typically carried out by EM, fluorescence detection of LC3, and biochemical assays as discussed below.
3.1.1 Electron microscopy
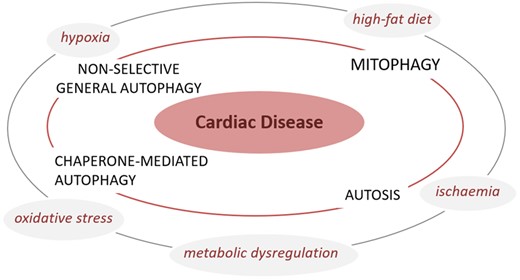
Despite new methods have been developed to study autophagy, EM remains the gold standard to analyse the ultrastructural details of autophagic structures to date (Figure 2).
Electron microscopy analysis of autophagic structures. Three-month old male C57BL/6 mice were subjected to 30 min ischaemia and 2 h reperfusion, and hearts with infarction border area were analysed by electron microscopy. Representative images indicate an autophagosome (arrowhead), an autolysosome (arrow), and a lysosome (asterisk). Scale bar: 2 µm.
An autophagosome is a double-membrane structure generated from an isolation membrane at distinct sites in the cell, though it is still unknown which cellular structures contribute to the formation of autophagosomes. These vesicles, as discussed earlier, sequester cargo and deliver it to lysosomes. EM images of an autophagosome typically reveal a double-membrane vacuole with a clear gap between the two membranes (Figure 2, arrow). EM is also used to determine the nature of the contents sequestered, allowing to distinguish between autophagosomes and those that have already fused with lysosomes (Figure 2, asterisk). Ultrastructural analyses reveal that sequestered organelles are largely intact in autophagosomes and allow for visualization of individual mitochondria engulfed during mitophagy. Mitochondria sequestered within autophagosomes can be readily detected through identification of cristae enclosed within the double-membrane autophagosomes. However, autophagosome fusion with lysosomes (forming the autolysosomes) leads to the rapid digestion of the cargo, which is apparent by the presence of material at various stages of degradation. Since the inner autophagosomal membrane is digested upon fusion with lysosomes (Figure 2, arrowhead), an autolysosome is typically observed as a single-membrane vacuole with an amorphous structure and high electron density.99 Indeed, late stage mitophagy is reflected by the single-membrane autolysosomes with residual mitochondria that might be difficult to identify.100 Immunogold EM for specific mitochondrial markers could also help confirm the nature of mitochondria in these late stages of mitophagy. Although EM is a powerful tool to evaluate the ultrastructural details of autophagic structures, it does not allow to determine whether autophagy is active or suppressed. In addition, this time-consuming approach is subject to possible artefacts in case fixation of samples and tissue sectioning have been inappropriately performed. Moreover, it may be difficult to preserve the integrity of the membranes. The ferrocyanide-reduced osmium method has proven useful for the preservation and contrast of membranous structures,101 and thus, is a method of choice for the detection of autophagosomes and autolysosomes. However, caution must be exerted when visualizing representative areas in a reasonably large number of replicates as this method is largely non-quantitative due to the limited numbers of sections and cells, and in differentiating autophagic structures from organelles such as rough ER, swollen mitochondria, and vacuoles of uncertain origin. Thus, EM must be used in combination with other assays for the accurate assessment of autophagic activity.
3.1.2 Fluorescence microscopy
The identification of LC3, a mammalian homologue of yeast Atg8 and the molecular marker of autophagosomes, undoubtedly facilitated autophagy monitoring. Pro-LC3, the unprocessed form of LC3, undergoes proteolytic cleavage by ATG4, which converts pro-LC3 to LC3-I. LC3-I is the soluble cytosolic form of LC3. Upon autophagic stimulus, LC3-I is conjugated to phosphatidylethanolamine (PE) through a ubiquitin-like reaction, resulting in the formation of LC3-II, the membrane-bound form of LC3. LC3-II is the only protein that specifically localizes to autophagosomes throughout the process, from the formation of the isolation membrane to its lysosomal degradation. Therefore, assessing LC3 lipidation is the most accurate way to follow the process of autophagy.102,103
Consequently, the development of modern tools to study autophagy evolved around LC3. Green fluorescent protein (GFP) fused to the N-terminus of LC3 (GFP-LC3) is broadly used as an autophagosome reporter. GFP-LC3 is thought to behave in the same way as the endogenous LC3.104 When expressed in cells, GFP-LC3 distributes diffusely throughout the cytoplasm and nucleus reflecting the soluble LC3-I form. Upon autophagy induction, punctate LC3 signals can be observed in the cytoplasm, representing the autophagosome-bound LC3. Therefore, increases in autophagosome content are reflected by the number of LC3 puncta per cell or the number of cells with an augmented number of LC3 puncta, as compared to cells maintained in the basal/non-stimulated state. Since ATG5 is required for the conversion of LC3-I to LC3-II, LC3-positive punctate structures do not form in Atg5-deficient cells105 or in cells expressing LC3 mutated at the amino acid residue required for PE conjugation,106 indicating the specificity of GFP-LC3 in measuring autophagosome levels. This molecule is also useful for tracking the formation, localization, and turnover of autophagosomes in live cells. The identification of LC3 as an autophagosome marker and the development of tools based on the specificity provided by LC3 is a great advantage over the use of EM.
There are, however, several pitfalls in monitoring autophagy activity using the GFP-LC3 reporter. First, since GFP itself can be aggregate-prone, LC3-positive aggregates may be misinterpreted as true LC3 puncta. Also, LC3 may bind to other membranes in the cell. Thus, complementary analysis should be performed to further confirm its presence in autophagosomes. This is particularly true when GFP-LC3 is transiently overexpressed or co-expressed with other aggregation-prone proteins. To circumvent this issue, the use of transformants that stably express GFP-LC3 is highly recommended. Protein aggregates in cells could also cause LC3 puncta formation through the incorporation of p62/sequestosome1 (SQSTM1), a well-established cargo adapter for autophagy.107 More importantly, as mentioned in the EM section, the number of autophagosomes calculated from GFP-LC3 puncta do not reflect autophagic activity. In other words, GFP-LC3 only reveals the steady-state levels of LC3 but not autophagy activity or flux. This problem can be solved by assessing autophagy flux.
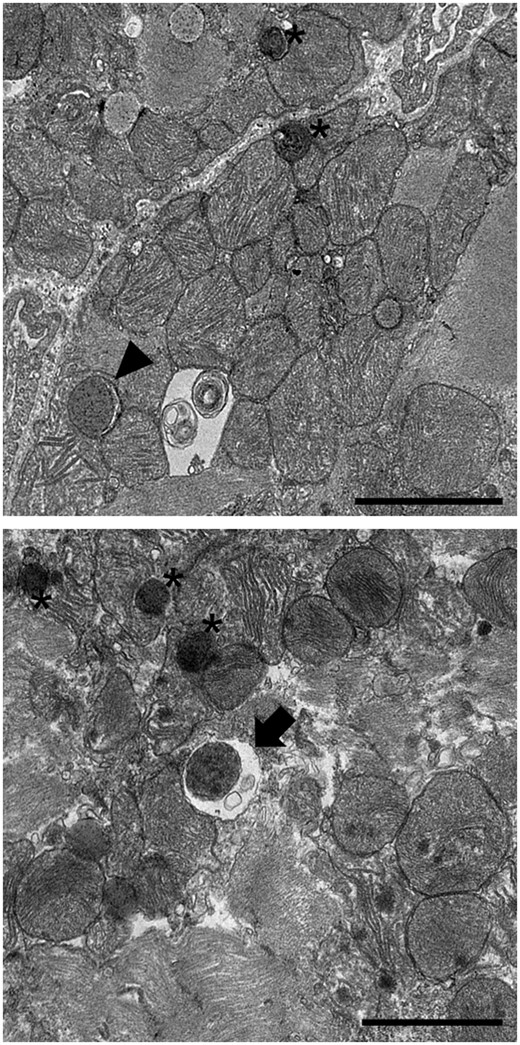
In context of fluorescence-based approaches, a construct that combines a red fluorescent protein with GFP-LC3 (mRFP-GFP-LC3) wherein mRFP and GFP are tandemly fused to the N-terminus of LC3 is a useful tool for measurement of autophagy flux (Figure 3).108 Upon delivery of the reporter to the lysosome, the GFP signal is quenched by the low pH/acidic environment. In contrast, the RFP is acid-stable and continues to fluoresce in the acidic environment. Using this construct, yellow (merged RFP and GFP signal) puncta indicate autophagosomes while red (RFP-positive and GFP-negative) puncta indicate autolysosomes. When both yellow and red puncta are increased, autophagic flux is considered to be high; however, robust autophagy induction is also reflected by a significant increase in red puncta, while the yellow puncta are unaffected in number. On the other hand, increases or no changes in yellow puncta without an accompanying increase in the red punctate signal indicate that autophagy flux/activity is blocked (Figure 3).102
Cardiac-specific-tandem-fluorescence mRFP-GFP-LC3 (tf-LC3): (A) three-month-old male C57BL/6 transgenic mice expressing cardiac-specific-tandem-fluorescence mRFP-GFP-LC3 (tf-LC3) were subjected to 30 min ischaemia and hearts with infarction border area were analysed by confocal microscopy to assess autophagic flux (scale bar: 10 µm). (B) The quantification of autophagosomes (yellow puncta) and autolysosomes (red puncta) is shown (mean values ± SE, n = 3; *P < 0.05, **P < 0.01 vs. sham).
In addition to the genetic approaches mentioned above, fluorescent small molecules can also be used to visualize autophagosomes and monitor autophagy. Though these probes are easy to use without the need for genetic engineering, there are limitations such as low specificity, cytotoxicity, the relative lack of information on materials and methodology for their optimal use across different systems, as well as the requirement of specialized instruments/training in generating these molecules. Recently, novel small molecule probes DALGreen and DAPGreen that stain autophagosomes were developed.109 It appears that the terminal amino group of DALGreen and DAPGreen is necessary for the incorporation of these dyes into the autophagosomal membrane by mimicking intramembrane phospholipids such as phosphatidylethanolamine. DAPGreen detects both autophagosomes and autolysosomes given that it is incorporated into the autophagosome during double-membrane formation and emits fluorescence under hydrophobic conditions without being affected by the pH. On the other hand, the fluorescence of DALGreen is enhanced in the acidic pH range and is suitable for monitoring autophagy activity/flux. It is likely that in the future, these probes could find wide use in the evaluation of autophagy across diverse model systems.
3.1.3 Flow cytometry
In the recent past, conventional or multispectral imaging flow cytometry have been proposed as alternative approaches for the high-throughput assessment of autophagic flux in live or fixed cells.102,110 These methodologies, which have been optimized for cells growing in suspension or circulating leukocytes, account for the study of autophagy dynamics in a large number of cells. The imaging flow cytometry combines the statistical power of flow cytometry with the information content of fluorescent microscopy. Associating the flow cytometry analysis of autophagic flux with that of other parameters such as cellular morphology, complexity, and (as in the case of concomitant detection of surface markers) phenotype, permits to accurately capture cell type-specific heterogeneity in autophagy levels.
Flow cytometry monitoring of autophagic flux relies on the expression of GFP-LC3 probe by target cells. Since GFP-LC3 is targeted for lysosomal degradation, total fluorescence intensity of GFP-LC3 can be used as a proxy to infer autophagy levels in cells; in conditions of autophagy induction (i.e. starvation) total GFP fluorescence intensity decreases. Alternatively, transient extraction with saponin (which depletes from cells soluble GFP-LC3I but not autophagosome-bound GFP-LC3II) can be performed prior to flow cytometry analysis; in this second scenario, an increase in GFP residual fluorescence will indicate an upregulation of the autophagic activity. In both settings, autophagy-inducing treatments should be compared in presence or absence of lysosomal inhibitors (see below) for an accurate measurement of autophagic flux.102 In line with these observations, a recent work has demonstrated that flow cytometry assessment of GFP-LC3 fluorescence could be successfully adopted to monitor autophagy in HL-1 cardiomyocytes.111
Despite the potential application of flow cytometry to monitor autophagic flux, these strategies are currently under used. In most of the cases, these methods only allow to measure global changes in GFP-LC3 levels, regardless of its transcriptional or translational fluctuations.
In addition, preparation of single cell suspensions of adherent cells or saponin extraction procedures impose elevated levels of stress to target cells, which in turn may lead to autophagy induction secondary to treatment. To bypass this issue, it is highly recommended to stain cells with viability dyes and to carefully titrate saponin concentration in order to minimize cellular toxicity and GFP-LC3 self-aggregation.
3.1.4 Biochemical assays
LC3 is commonly used to assess autophagosome number and autophagy activity also via biochemical approaches. The conversion of LC3-I to LC3-II, reflecting LC3 lipidation, is easily detectable by immunoblotting. The hydrophobicity of lipidated LC3-II increases its electrophoretic mobility in the SDS-PAGE, causing its separation from LC3-I. However, pro-LC3 (which is recognized by commercially available antibodies) also shows higher electrophoretic mobility than LC3-I112 and may be mistaken with LC3-II. Thus, it is always important to get a good separation of the bands using specific gels (e.g. Tris-glycine or gradient gels), as well as trying to visualize both LC3-I and LC3-II bands, as it will confirm the correct lipidation of LC3. Whatever the case may be, the amount of LC3-II correlates well with the number of autophagosomes in the cell.113 Although some investigators recommend the use of polyvinylidene difluoride membrane with 0.20 µm pore size for the immunoblotting of LC3,114–116 nitrocellulose membrane provides sufficient sensitivity to distinguish between differences in LC3-II in different samples. Most importantly, it is necessary to perform complete autophagic flux assays (Figure 4A–C), which will evaluate whether the increased number of autophagosomes is due to autophagy induction (Figure 4C, scenario 1) or is rather a consequence of an impairment in autophagosome-lysosome fusion or blocked degradation in lysosomes (Figure 4C, scenario 2). The differences in the intensity (densitometric values) of LC3-II between samples in the presence or absence of lysosomal inhibitors represent autophagic flux. For this purpose, inhibitors of lysosomal proteases such as bafilomycin A (that blocks autophagosome-lysosome fusion), or a combination of ammonium chloride (a base that dissipates lysosomal pH) and leupeptin (inhibitor of lysosomal proteases), as well as E64 and pepstatin A, are commonly used. Ex vivo flux of the tissue of interest can also be used to assess the autophagic activity (Figure 4B). Chloroquine and NH4Cl/Leupeptin have been successfully used to block lysosomal degradation in cardiac cells. In primary cultures of adult mouse cardiomyocytes or neonatal rat ventricular myocytes, it is sufficient to treat the cells 2–4 h prior to cell lysis either with 50 µM chloroquine, 50 nM bafilomycin A, or 20 mM/100 µM NH4Cl/leupeptin (117 and data not published). It is important that chloroquine and ammonium chloride solutions are freshly prepared each time. To inhibit the autophagic flux in vivo, different groups have used chloroquine concentrations ranging from 10 to 50 mg/kg injected i.p. in mice 4–6 h before sample collection.52,117–119 Another study reported the use of bafilomycin A for in vivo experiments; mice were injected with 6 µmol/kg i.p. and sacrificed after 30 min.89. In these in vivo experiments it is essential to synchronize autophagy induction/suppression in the animals by starvation/re-feeding regimen (24 h of starvation plus 3 h of feeding) thereby reducing the variability due to differences in food intake. The evaluation of autophagic substrates protein levels may also be used to study autophagy flux in combination with additional supporting methods. However, caution should be exercised regarding the inclusion of controls to confirm that changes in levels of these additional proteins in response to a given treatment are not due to alterations in gene expression. One such protein is p62/SQSTM1, a well-studied autophagy substrate which directly binds to LC3 and is degraded by autophagy. One concern is that p62/SQSTM1 can also be degraded by the proteasome;120,121 consequently, the assessment of autophagy flux/activity must be done in the presence of lysosomal inhibitors. In principle, the protein level of p62/SQSTM1 is considered to inversely correlate with autophagic activity.122 However, levels of p62/SQSTM1 are also transcriptionally regulated during autophagy and/or in response to stressors,120,121 which may be misinterpreted as an increase in autophagic activity. Alternatively, information about autophagic flux status can accurately be inferred by monitoring the degradation of radioactively123 or non-radioactively124 labelled long-lived proteins.
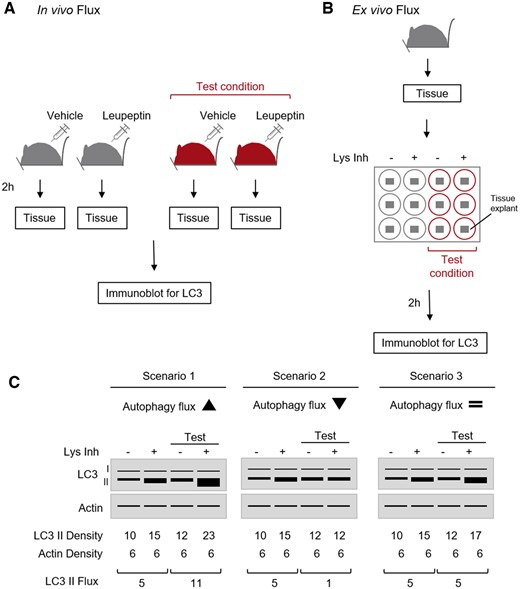
Autophagic flux in vivo and ex vivo via LC3 immunoblot. (A) In vivo flux. Mice (control or relevant test condition) can be injected with vehicle or leupeptin (30 mg/kg i.p.) 2 h before harvesting. Collected tissue(s) can be processed for SDS-PAGE and immunoblot for LC3. (B). Ex vivo flux. Tissue(s) harvested from a mouse can be cut into 0.5 cm3 explants and cultured in media under control or test conditions with vehicle or lysosomal inhibitors (Lys Inh) at 37°C in a CO2 incubator for 2 h with occasional swirling. Then, they can be processed for SDS-PAGE and immunoblot for LC3. (C). Schematic representation of LC3 blots depicting increased (left), decreased (middle), or unchanged (right) autophagic flux. Autophagic flux or LC3-II flux is calculated by subtracting the density values (after actin normalization) of + Lys Inh and control for each condition.
3.2 Mitophagy
Several approaches and molecular tools have been established to study mitophagy both in neonatal and adult cardiomyocytes, or other cell types in the heart (for instance, cardiac fibroblasts). The most commonly used methods to study mitophagy in cells assess changes in mitochondrial mass, ultrastructural changes in mitochondria via transmission EM (described in Section 3.1), and fluorescence microscopy for colocalization of mitochondria with autophagosomes or lysosomes.100,102 More recently, several novel assays have been developed, including MitoTimer, Mito-Keima, and Mito-QC, as discussed in Section 4.2. Importantly, these assays can be used to monitor and quantify mitophagy in vivo in diverse tissues.
3.2.1 Assessment of mitochondrial mass
Analysis of mitochondrial mass is the most reliable readout of mitophagy. This can be done by immunoblotting, measuring the relative amount of mitochondrial proteins in relation to levels of classical cellular protein loading markers. It is recommended to cover all mitochondrial compartment proteins, including the outer [e.g. translocase of outer membrane-20 (TOM20), voltage-dependent anion-selective channel protein (VDAC)] and inner mitochondrial membrane proteins [such as cytochrome C oxidase (COX) or ADP/ATP translocase 1 (ANT)], intermembrane space (cytochrome C), and matrix proteins [manganese superoxide dismutase (MnSOD), heat shock protein-60 (HSP60)]. This precaution is justified by the fact that some OMM proteins are degraded by the proteasome and are therefore not reliable markers of mitophagy,100 while others have been identified as substrates for CMA.90 In this regard, measurement of citrate synthase activity, a citric acid cycle enzyme generally not affected by the depletion of mtDNA or respiratory chain inhibition, is frequently used to measure mitochondrial mass in cells and tissues. Nevertheless, it must be considered that citrate synthase is one of the citric acid cycle enzymes identified as a CMA substrate.90 In addition, quantitative PCR can be used to quantify mitochondrial-to-nuclear DNA ratio, using 16S rRNA as an index of mtDNA, and hexokinase 2 for nuclear DNA.100 However, in order to interpret these results correctly, it is essential to assess mitochondrial biogenesis as well, to ensure that it is not impaired. It must be also noted that high levels of mitophagy may be required to detect net loss of mitochondrial proteins.
3.2.2 Fluorescence-based approaches
Fluorescence microscopy for colocalization of mitochondria with autophagosomes and lysosomes helps with the assessment of the degree to which the autophagic machinery sequesters and degrades mitochondria in the presence of a stressor. Co-labelling with GFP-LC3 and MitoTracker Red (for live cells) or immunostaining for mitochondrial proteins such as TOM20, VDAC, or COX-IV with antibodies (for fixed cells) offers information regarding colocalization between mitochondria and GFP-LC3-positive autophagosomes. Quantitative colocalization provides information on the degree of sequestration and serves as a marker for mitophagy. In addition, co-labelling for mitochondria and lysosomes using either LysoTracker or antibodies directed against lysosomal protein (LAMPs for instance) can be used as another assay for the assessment of mitophagy through colocalization of mitochondria with lysosomal markers. Although these assays may indicate the association of mitochondria with LC3-positive autophagosomes or lysosomes, mitochondrial degradation can only be confirmed following addition of lysosomal inhibitors. As discussed above, the propensity of GFP-LC3 to form aggregates requires caution since not all puncta will necessarily represent autophagosomes. The combination of electron and fluorescence microscopy tends to facilitate the interpretation of results related to the localization of LC3-positive double membranes around mitochondria. Given its complexity, one assay is unlikely to provide a clear picture of the biology so it is recommended to use complementary approaches for its assessment.
3.3 Chaperone-mediated autophagy
3.3.1 CMA components
Determining the abundance and distribution of key CMA components and CMA-active lysosomes can be used as an indirect way to quantify CMA activity, but these methods yield only snapshots and should be complemented with functional assays. Lysosomal LAMP-2A is rate-limiting for CMA and changes in LAMP-2A levels usually correlate with CMA activity.80 Nonetheless, not all LAMP-2A-positive lysosomes are equipped for CMA, as lysosomal HSC-70 (lys-HSC70) needs to be present as well, which is the case for 30% of LAMP-2A-positive lysosomes under basal conditions in organs such as liver. Additionally, lysosomal LAMP-2A levels are proportional to CMA activity and thus blotting lysosome-enriched fractions or membranous cell fractions is superior to blotting whole cell lysates. Given the sole involvement of LAMP-2A in CMA, antibodies specific for LAMP-2A should be utilized, rather than total LAMP-2 (that recognize the three isoforms of the lamp-2 gene—LAMP-2A, LAMP-2B, and LAMP-2C). CMA activation often occurs without de novo synthesis of LAMP-2A, but in some conditions such as oxidative stress,48,68 hypoxia,125 or genotoxic stress it is transcriptionally upregulated.68 Thus, LAMP-2A mRNA could be proportional to CMA activity; however, absence of changes in LAMP-2A mRNA does not necessarily mean that CMA is not altered. Regarding HSC70, total cellular levels measured via immunoblot or mRNA quantification are not informative of the CMA status. Assessment of lys-HSC70 in lysosomal fractions is more helpful than analyses of whole cell lysates. It is important to note that, when analysing lys-HSC70 in lysosome-enriched fractions, one should use antibodies specifically recognizing HSC70 and not HSP70.
3.3.2 Functional assays to track CMA activity
Comprehensive assessment of CMA activity in cells, tissues, and organelles requires tracking this pathway over time.126 Below we detail a number of assays to determine CMA activity.
3.3.2.1 CMA reporter
The use of photoconvertible CMA reporters is a good approach to assess CMA activity since it can be performed in intact cells, even with limited sample size (Figure 5).127 The principle behind this assay is the use of a photo-switchable protein that contains the KFERQ motif. Upon exposure to 405 nm light, it becomes possible to distinguish the photo-converted protein from the newly synthesized protein. Upon CMA activation in response to a given treatment, the fluorescent protein localizes to lysosomal membranes giving rise to visible fluorescent puncta. The number of puncta per cell is indicative of CMA activity (Figure 5). The CMA reporter ceases to fluoresce upon reaching the lysosomal lumen because of the unfolding required for the translocation across the lysosomal membrane and its rapid degradation inside the organelle. Consequently, this assay is only indicative of the binding step in the CMA pathway. One key advantage is that the pulse-chase nature of this assay allows testing CMA activity in response to different conditions and therapeutics.
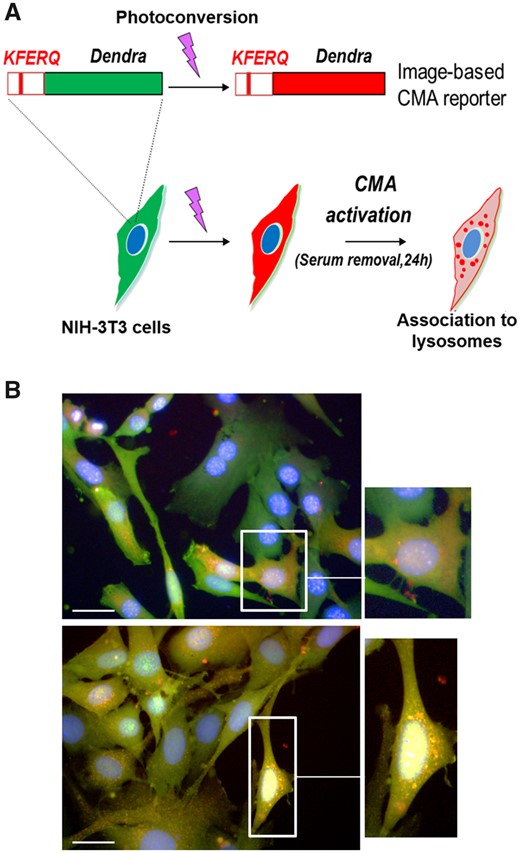
KFERQ-Dendra reporter to measure CMA activity. (A) Scheme of the experimental design to monitor CMA activity in cultured cells using the KFERQ–Dendra2 reporter. (B) NIH-3T3 cells expressing the Dendra2-KFERQ photoswitchable CMA reporter cultured in the presence (top panel and magnification) or absence (lower panel and magnification) of serum. Scale bar: 20 µm.
3.3.2.2 Lysosomal uptake
The most reliable method to assess CMA activity is reconstituting the process with isolated lysosomes that contribute exclusively to CMA. This in vitro assay uses intact lysosomes, pretreated or not with lysosomal protease inhibitors (PI), and incubated with a known CMA substrate such as glyceraldehyde 3-phosphate dehydrogenase (GAPDH) or ribonuclease A (RNase A). Samples are centrifuged after the incubation and the subsequent immunoblot for the CMA substrate used is a measure of the amount of substrate either bound to lysosomal membrane (those untreated with PI) or associated with lysosomes (those pretreated with PI). The amount of substrate translocated into the lysosomal lumen can be calculated by subtracting the amount of bound substrate from the total amount of substrate associated with lysosomes.
3.3.2.3 Metabolic labelling
Pulse and chase experiments can be used to track the degradation of potential CMA substrates by using radio-labelled amino acids 3H-leucine or 3H-valine in conjunction with inhibitors of either lysosomal proteases or macroautophagy to distinguish between macroautophagy and CMA-sensitive proteolysis. For example, contrary to macroautophagy, CMA is insensitive to phosphatidylinositol 3-kinase (PtdIns3K) inhibitors.128 When using inhibitors of macroautophagy, it must be noted that prolonged blockage of macroautophagy leads to an upregulation in CMA. Thus, analyses of activity of these pathways should be assessed at early time-points (<24 h). Otherwise, the fraction of cellular proteins degraded through CMA could be overestimated.
3.3.2.4 Immunofluorescence
Changes in the number of CMA-active lysosomes is an indirect measurement of CMA activity. Co-staining via immunofluorescence or use of dual immunogold staining for HSC70 and LAMP-2A usually offers good correlation with CMA activity. As previously stated, increases in LAMP-2A or lys-HSC70 levels positively correlate with CMA activity.25,26
3.4 Autosis
Although autophagy is often triggered as a pro-survival pathway, it may lead to cell death in specific conditions.60 In fact, several studies demonstrated how autophagy repression may ameliorate some pathological alterations in CD. For this reason, it is important to further explore the possible role of autosis in cardiac pathologies.
Unique morphological features characterize this type of cell death, including accumulation of autophagosomes and autolysosomes, disappearance of intracellular organelles, nuclear convolution, and characteristic expansion of the perinuclear space (Figure 6). Therefore, EM analysis remains the best method to detect autotic cells. In this regard, both the early phase (intense vacuolization) and the late phase (swollen perinuclear space and nuclear concavity) have been described in some pathological conditions in vivo (rat brain or human liver) using this technique.65,129 It is important to distinguish autosis features from the ones present in endothelial cells, such as the concavity of the nucleus. Immunofluorescence analysis could help in the identification of autotic cells, for instance detecting ER fragmentation and nuclear concavity.46,47 Nevertheless, double membranes are not discernible with this technique, as it would be impossible to distinguish the swelling of the perinuclear space from a random alteration in the shape of the whole nucleus.
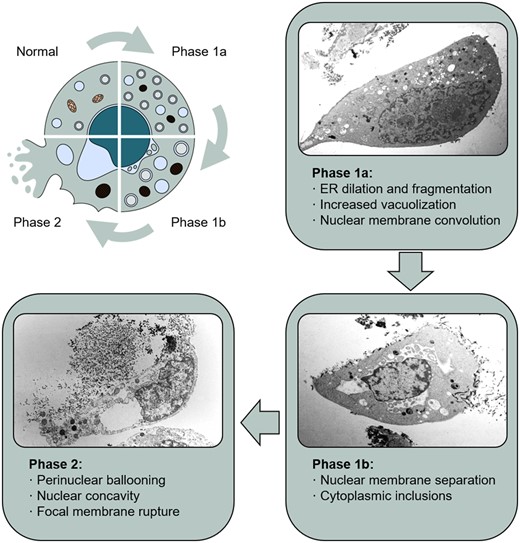
Autosis. Schematic diagram and representative images of the different phases of autosis in HeLa cells, showing the most characteristic features of this type of cell death. Images from Liu and Levine licensed under a Creative Commons Attribution 3.0 Unported License (https://creativecommons.org/licenses/by/3.0/).
Little is known about the complete molecular pathway underlying autosis, along with possible biochemical markers that could help in the identification and quantitation of this type of cell death. However, a unique feature of autosis is its dependency on autophagy proteins and the Na+, K+-ATPase.65 In this regard, another way to confirm autotic cell death relies on the blockage of this process by depleting ATGs or inhibiting Na+, K+-ATPase.
4. Animal models for the study of autophagy and CD
In the following sections, we discuss the animal models useful for studying autophagy in the context of CD (Table 2).
Genetic mouse models employed for the study of different macroautophagy forms in the cardiac system
| Mouse line | Effect on autophagy/mitophagy | Cardiac disease model | Effect on cardiac function | References |
|---|---|---|---|---|
| Atg5−/− | Inhibited | Pressure overload | Exacerbated hypertrophy, LV dilation and dysfunction | 51 |
| Atg5 Tg overexpression | Increased | Aging | Reduced age-related cardiac fibrosis, lifespan extension | 23 |
| Beclin 1+/− | Attenuated | I/R injury, pressure overload, diabetic cardiomyopathy, sepsis | Cardioprotective during reperfusion, blunted LV remodelling | 21,26,87,130,131 |
| Beclin 1 Tg overexpression | Increased | Pressure overload; Diabetic cardiomyopathy | Exacerbated LV remodelling | 21,87 |
| Increased | Sepsis | Cardioprotective | 130 | |
| Beclin 1 F121A knock-in | Increased | Aging | Reduced age-associated cardiac alterations, increased lifespan | 52 |
| ATG16L1-HM | Macroautophagy inhibited, mitophagy restored | Diabetic cardiomyopathy | Attenuated cardiac derangements | 87 |
| Mst1−/− | Increased | Myocardial infarction | Reduced infarct size, cardioprotective | 69 |
| RHEB overexpression | Inhibited | Ischaemia | Exacerbated injury | 27 |
| AMPK dominant-negative Tg overexpression | Inhibited | Ischaemia | Exacerbated injury | 26 |
| Parkin Tg overexpression | Increased | Aging | Reduction in age-associated cardiac abnormalities | 25 |
| Parkin−/− | Reduced | Myocardial infarction | Increased infarct size, hypertrophy | 74 |
| DRP1−/− | Inhibited | I/R injury, pressure overload | Exacerbated injury, heart failure | 32,73 |
| PGAM5−/− | Inhibited | I/R injury | Exacerbated injury | 66 |
4.1 Non-selective general autophagy
Mouse models for the measurement of autophagy in vivo have been established to precisely monitor the autophagic process. Transgenic mice expressing GFP fused to the autophagosome marker LC3 were generated in 2004 by Dr Noboru Mizushima in Dr Yoshinori Ohsumi’s group.104 Expression of GFP-LC3 did not affect autophagy per se, and these mice do not exhibit an abnormal phenotype. Since then, the GFP-LC3 transgenic mice have been widely used to evaluate and measure autophagy by fluorescence microscopy in multiple tissues, including the heart. Autophagosomes are visualized as puncta or vesicles labelled by GFP. However, treatment of these mice with lysosomal inhibitors to inhibit the degradation of autophagic vesicles is required to accurately assess the autophagy flux.
Other mouse models have been developed to better visualize the autophagy process and to overcome the limitation of GFP fluorescence typically quenched by the low lysosomal pH. The mRFP-GFP-LC3 tandem fluorescent-tagged LC3 reporter mouse allows for the detection of autophagosomes labelled with both mRFP and pEGFP (Figure 3).108,132 This tool has been useful to monitor autophagic activity during cardiac injury through cardiomyocyte-specific expression of mRFP-GFP-LC3 reporter40 (Figure 3). More recently, GFP-LC3-RFP-LC3ΔG fluorescent probe was designed to monitor autophagic flux in vitro and in vivo. Upon cleavage by endogenous ATG4, equimolar amounts of GFP-LC3 and RFP-LC3ΔG are generated. GFP-LC3 is degraded through autophagy, whereas RFP-LC3ΔG is not and remains in the cytosol, acting as an internal control. The GFP/RFP ratio reflects autophagic flux.133
Besides monitoring autophagy with reporter mice, the function of autophagy in tissues has been analysed using genetically engineered mice deficient in key autophagy genes. Knockout mice for non-redundant Atgs are lethal in the neonatal or embryonic stage. Consequently, conditional tissue-specific Atg gene knockout mice have been developed to assess the contribution of autophagy to diverse pathophysiological conditions. For example, cardiac-specific Atg5 knockout mice revealed the importance of autophagy in preserving cardiac function.51 Autophagy has also been investigated in adult mice at the whole body level. Mice heterozygous for the loss of the autophagy gene Beclin 1 have significantly reduced autophagy activity.134 These mice have been used to study autophagy in models of ischaemia/reperfusion and sepsis in the heart, demonstrating important cardioprotective roles of autophagy.26,31,130 Similar to the Beclin 1 deficient animals, ATG16L1 hypomorphic mice, or animals lacking autophagins (the mammal orthologues of yeast Atg4s), exhibit decreased levels of autophagy.135,136 Other approaches include the tamoxifen-inducible Cre-mediated deletion of floxed Atg5 or Atg7 alleles, leading to selective and temporal deletion of autophagy genes in adulthood.137–139 Using this strategy, autophagy activity is inhibited within 1–2 weeks of treatment with tamoxifen, following which these mice begin to show tissue-specific abnormalities over a period of few weeks. Another approach is to study the pathophysiological consequences of increased basal autophagy activity in mice. For instance, transgenic mice overexpressing Atg5 have been developed; however, it is unclear whether and how autophagy is indeed increased in these mice since, although required for the autophagy to occur, ATG5 is not involved in the regulation of autophagy levels.23
More recent studies have described the Beclin 1-F121A knock-in mice, expressing a mutation in the BH3 domain of Beclin 1 that leads to constitutively increased basal autophagy in multiple tissues.52,140,141 The Beclin 1-F121A mice with increased levels of autophagy throughout adulthood have an increased lifespan and improved healthspan including decreased age-associated cardiac alterations.52 On a similar note, cardiac-specific transgenic mice overexpressing Beclin 1 have also been developed and show increase in stress-induced autophagy.21,130
4.2 Mitophagy
Currently, the large majority of mitophagy studies monitor the colocalization of mitochondrial probes with typical markers of autophagy.102,142 Dr Toren Finkel’s group generated a reporter mouse expressing the fluorescent reporter Mito-Keima, which results from the fusion of the fluorescent protein Keima to the mitochondrial matrix protein COX8 (Figure 7).143 Keima is a pH-sensitive fluorescent protein whose emission spectra differ in mitochondria (458 nm, green fluorescence at pH 8.0) compared to the acidic environment of lysosomes (561 nm, red fluorescence at pH 4.5).144 Transgenic mitochondria-localized Keima mice have been used to assess mitophagy since this model provides the most sensitive and specific analysis of mitochondrial flux to lysosomes (Figure 7). However, there are downsides to assessing mitophagy using the Mito-Keima probe. For instance, the Keima excitation wavelengths for green and red fluorescence partially overlap, rendering the quantitation and interpretation of the data difficult. It should also be noted that Mito-Keima fluorescence fades upon prolonged light exposure. In addition, fixation disrupts the lysosomal pH gradient required for this probe to work.144–146 To optimize these conditions, it is important to increase the cross-link reaction while suppressing tissue damage. Augmenting the concentration of formaldehyde is not an option since its amount is usually in excess. Higher temperatures promote autolysis of the tissue. A longer reaction time may result in an inappropriate diffusion of denatured protein. Thus, pH may be the sole parameter that can be adjusted to achieve this purpose. Since the affinity of formaldehyde for an unprotonated amino group is much higher than for a protonated group, the formation of the aminomethylol group is highly pH sensitive. As the pH increases, more groups lose their proton and react with formaldehyde. In fact, the advantage of alkaline fixation for effective cross-linking has been reported in the context of immunohistochemistry and in situ hybridization.147,148 Moreover, alkaline fixation counter-neutralizes the intracellular pH, thus preventing inappropriate acidic Mito-Keima signals due to cell death-dependent intracellular acidification. To observe mitophagy using Mito-Keima mice, heart is fixed with alkaline formaldehyde for 30 min.117 Vibratome-mediated sectioning and microscopic analysis are conducted immediately after fixation. The high-ratio signal (561/458 nm), indicating localization of Mito-Keima protein in an acidic environment, is upregulated in response to starvation or ischaemia in the wild-type heart and associated with the induction of autophagy (Figure 7, unpublished data). Treatment with Tat-Beclin1, an autophagy-inducing peptide,149 also increased this signal. On the other hand, the hearts from cardiac-specific Atg7 knockout mice do not show any high-ratio signal at baseline.143 This suggests that the high-ratio signal of Mito-Keima obtained with alkaline fixation clearly reflects mitophagy. One cautionary note with the use of Mito-Keima mice is that it is difficult to exclude the possibility that ischaemia may contribute to the formation of acidic puncta. It is recommended to complete the procedure within 2 h.
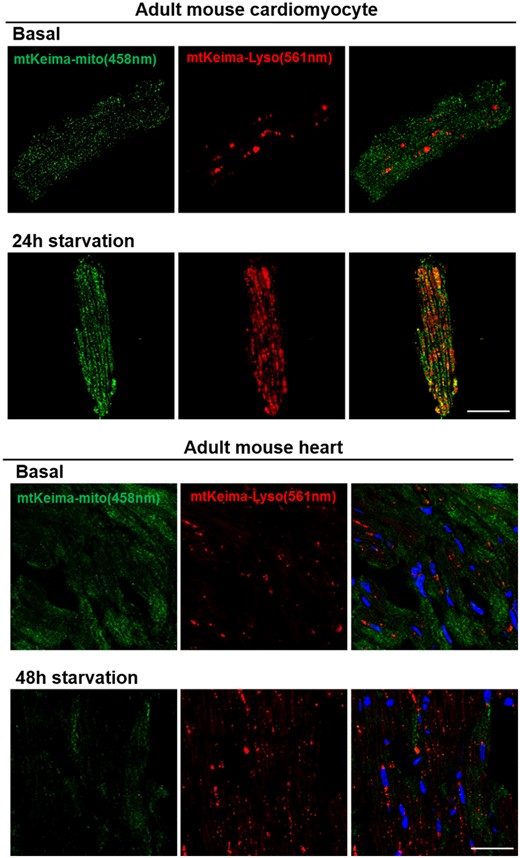
Mito-Keima as a mitophagy reporter to study cardiac mitophagy in mice. (Upper panel) Isolated adult mouse cardiomyocytes from 16-week-old male Mito-Keima mice with no treatment (basal) or 24 h starvation. (Lower panel) Mouse heart tissue from Mito-Keima mice with no treatment (basal) or after 48 h of starvation. Images were taken with a confocal microscope with sequential 458 nm and 561 nm excitations. Normal mitochondria are presented as green and mitophagy (mitochondria fused with lysosome) is presented as red. Scale bar: 25 µm.
Since the rate of mitochondrial turnover is slow in the heart (approximately every 2 weeks),25,74 measuring mitochondrial turnover and biosynthesis in vivo has proven difficult. Consequently, several novel methods have been developed to monitor mitophagy in vivo, including the use of fluorescent probes such as MitoTimer and Mito-QC (quality control).
MitoTimer is a useful tool for monitoring mitochondrial turnover in vivo. The fluorescent timer protein, also called DsRed-E5, is a mutant form of the red fluorescent protein DsRed that changes its colour from green to red over a period of time as the protein matures.150 The timer protein was fused with mitochondria targeting sequence of COX8A to generate MitoTimer targeted to the mitochondrial matrix.151,152 Subsequently, Stotland and Gottlieb generated transgenic mice with cardiac-specific expression of MitoTimer driven by the cardiac α-myosin heavy chain (α-MHC) promoter.153 Despite the fact that α-MHC is equally expressed in atrial and ventricular myocardium, MitoTimer is largely expressed in the left and right ventricles and to the lesser extent in the atria. MitoTimer expression in vivo facilitates its use in experiments exploring roles of mitophagy in skeletal and cardiac muscle.
The Mito-QC probe is another new tool developed for assessing mitophagy and visualizing the mitochondrial network.145 Like Mito-Keima, Mito-QC is a pH-sensitive mitochondrial fluorescent probe, consisting in the tandem mCherry-GFP tag fused to the OMM protein FIS1. Mito-QC shows green and red fluorescence in normal conditions but reveals a predominant mCherry (red) signal when mitophagy is induced and mitochondria are delivered to the lysosomes. McWilliams et al.145 generated the Mito-QC transgenic mice, which can be used to monitor changes in mitophagy during stress. Unlike for the Mito-Keima reporter, there is no evidence of an overlap in the Mito-QC excitation spectra. Furthermore, it has been reported that samples from Mito-QC mouse can be fixed prior to microscopic analysis.145 However, Mito-QC also requires the pH gradient across the lysosomal membrane for an accurate detection of mitophagy. Since acid-induced reduction of GFP fluorescence is reversible upon re-neutralization of pH,154,155 the acidic signal of Mito-QC (red alone) should theoretically only be maintained in the presence of the pH gradient across the lysosomal membrane. We therefore speculate that optimized fixation aimed at preserving lysosomal membrane structure is essential not only for Mito-Keima but also for Mito-QC.
Despite technical limitations, these tools present significant advantages that allow the assessment of mitophagy in vivo. However, extensive research is necessary for the development of the state-of-the-art techniques to better understand the regulation of mitophagy in CD.
4.3 Chaperone-mediated autophagy
Assessing the CMA status in different tissues from various rodent models can be performed via the assays mentioned earlier. For example, CMA has been investigated using lysosomes isolated from liver, brain, kidney, and spleen.13 The lamp-2 gene gives rise to three splice variants, lamp-2a, b, and c. The resulting proteins, LAMP-2A, B, and C, have been associated with CMA,156 macroautophagy,91 and RNAphagy157 respectively. A previous model with deletion of the whole LAMP-2 gene that targets all three isoforms of LAMP2 proved unsuitable for investigating CMA due to interference with other autophagic pathways and defective lysosomal biogenesis and stability.92 A Cre-loxP system was used to disrupt an exon specific to domains of LAMP-2A without affecting the other two LAMP-2 isoforms. This first in vivo approach demonstrated the importance of CMA in the regulation of metabolism, since mice lacking LAMP-2A in the liver displayed severe dysfunction in glucose and lipid metabolism.90 Implication of CMA in the immune system was shown by Valdor et al. This study showed that CMA is required for proper T-cell activation and that restoration of LAMP-2A in aged cells results in an improved T-cell response.48
4.4 Autosis
As a unique biochemical feature, autosis is regulated by the Na+, K+-ATPase. Cardiac glycosides like digoxin, a chemical inhibitor of the Na+, K+-ATPase, block autosis and markedly reduce brain injury in response to cerebral hypoxia–ischaemia in neonatal rats.65 Of note, unlike the human α-isoforms of the Na+, K+-ATPase, the mouse α1 isoform of the Na+, K+-ATPase is insensitive to cardiac glycosides. Since the expression level of α1 isoform is predominant over the other α-isoforms, the Na+, K+-ATPase cannot be inhibited by digoxin-like molecules in the rodent heart. This limitation can be avoided using cardiac-glycoside sensitive Na+, K+-ATPase α1 knock-in mice.158 Replacement of specific amino acid residues in the mouse Na+, K+-ATPase α1 (Arg-111 and Asp-122) with residues naturally present in the human α1 isoform (to Glu-111 and Asn-122) confers sensitivity to cardiac glycosides. It should be noted that these compounds are used for the treatment of systolic heart failure and for heart rate control in the presence of atrial fibrillation. These effects are mediated by an increase of intracellular calcium concentration in cardiomyocytes. It is reasonable to speculate that some of the beneficial effects of digitalis on cardiac contractility may be partially mediated by the reduction of autosis.
5. Conclusions and perspectives
The literature reviewed here strongly indicates that modulation of autophagy represents a potential therapeutic approach to treat CD upon various stress conditions. Several therapeutic strategies have been proposed to stimulate autophagy. Inhibitors of mTORC1, such as rapalogues (rapamycin analogues), or activators of AMPK, such as metformin and 5-aminoimidazole-4-carboxamide ribonucleotide (AICAR), confer cardioprotection in different stress conditions, including aging.27,159,160 Natural compounds can also be considered valid options because of their lower toxicity. For example, resveratrol, a polyphenol present in red wine, stimulates cardiac autophagy through activation of NAD-dependent protein deacetylase sirtuin-1 (SIRT1) and AMPK.161,162 Spermidine and trehalose are inducers of autophagy and may be considered novel cardioprotective agents as well.24,58 Synthetic peptides that have the ability to selectively activate autophagy were recently developed and showed to benefit cardiac function. For instance, administration of a low dose of Tat-Beclin 1 counteracted heart failure induced by pressure overload via induction of mitophagy.73 Recently, it has been shown that aspirin, a worldwide drug used to prevent heart attack in high risk patients, induces autophagy, suggesting a novel molecular mechanism underlying the pro-health effects of this drug.72 However, most of the molecules that induce autophagy, often, also impact other molecular pathways and this problem limits their use. Certainly, the development of more specific autophagy inducers is a major issue for forthcoming researches. In particular, natural activators of autophagy may represent a valid option for activating autophagy in patients because of their low adverse effects.163 Another point that needs to be considered is the study of the impact of standard pharmacological agents for the treatment of CD on autophagy. In the future, it will be interesting to evaluate the cardioprotective role of CMA and lipophagy stimulation for the treatment of cardiac and metabolic diseases, also in response to triggers relevant to CD, such as oxidative stress, hypoxia, and lipogenic challenges, or its age-associated decline.
Although in most conditions autophagy activation reduces myocardial injury, in certain pathological situations it appears to be maladaptive in the heart. Further investigations are needed to better understand the mechanisms underlying this paradoxical consequence. Although it is possible that exaggerated autophagy activation is deleterious, it may also be possible that the signalling mechanisms promoting autophagy may determine whether the outcome is beneficial or toxic. It is now known that alternative pathways regulating autophagy exist and recent work has demonstrated that specific molecules regulating the autophagic machinery could also trigger other forms of cell death. Clarifying these aspects is key to understanding when autophagy needs to be activated and when this activation should be avoided. In this regard, the use of cardiac-specific conditional knockout models for autophagy may prove beneficial.
Finally, methods to study autophagy require further improvements. Since autophagy is a dynamic process, misinterpretation of data leads to inaccurate evaluation of autophagy and autophagic flux. In addition, several results from previous studies were obtained in in vitro models, which are important for dissecting the signalling pathways regulating autophagy but may not be able to mimic the in vivo environment and may have limited physiological relevance. To date, several detection tools have been developed to precisely quantify autophagy in diverse model systems, and these methodologies were recently summarized and standardized in guidelines for the evaluation of mammalian autophagy.102 The evaluation of autophagy in human subjects remains yet another important challenge. It would be critical to understand how levels of cardiac autophagy correlate with cardiac outcomes in subjects affected by CD. This is possible when myocardial biopsies are available. Unfortunately, this approach is not always feasible, particularly in larger cohorts of subjects. Therefore, it is important to develop new techniques to monitor autophagy in vivo or to identify novel circulating markers associated with cardiac autophagy and dysfunction, which may be used to monitor autophagy in human subjects.
Author contributions
M.C.M., A.F., and S.S.12,13 conceived the manuscript idea and together with J.M.M. and N.K. coordinated and supervised the work. All the authors participated in manuscript writing, critically reviewed the content and agree to be accountable for the work. S.K. performed major scientific editing. A.F., M.C.M., F.C., J.N., J.M.M., N.K., S.K., and Y.C. prepared figures and tables.
Funding
This work was supported by the Fondation Leducq Transatlantic Network of Excellence [15CVD04]; the American Heart Association [17POST33650088 to J.M.M., 18POST34050036 to J.N., and 18POST34060247 to R.M.]; and the Italian Ministry of Health [GR-2013-02355401 to S.S.12,13].
Conflict of interest: none declared.
References
Author notes
Nina Kaludercic, Maria Chiara Maiuri, Susmita Kaushik and Álvaro F. Fernández contributed equally to the study.
