


Abstract
In March 2020, the United Kingdom Primary Immunodeficiency Network (UKPIN) established a registry of cases to collate the outcomes of individuals with PID and SID following SARS-CoV-2 infection and treatment. A total of 310 cases of SARS-CoV-2 infection in individuals with PID or SID have now been reported in the UK. The overall mortality within the cohort was 17.7% (n = 55/310). Individuals with CVID demonstrated an infection fatality rate (IFR) of 18.3% (n = 17/93), individuals with PID receiving IgRT had an IFR of 16.3% (n = 26/159) and individuals with SID, an IFR of 27.2% (n = 25/92). Individuals with PID and SID had higher inpatient mortality and died at a younger age than the general population. Increasing age, low pre-SARS-CoV-2 infection lymphocyte count and the presence of common co-morbidities increased the risk of mortality in PID. Access to specific COVID-19 treatments in this cohort was limited: only 22.9% (n = 33/144) of patients admitted to the hospital received dexamethasone, remdesivir, an anti-SARS-CoV-2 antibody-based therapeutic (e.g. REGN-COV2 or convalescent plasma) or tocilizumab as a monotherapy or in combination. Dexamethasone, remdesivir, and anti-SARS-CoV-2 antibody-based therapeutics appeared efficacious in PID and SID. Compared to the general population, individuals with PID or SID are at high risk of mortality following SARS-CoV-2 infection. Increasing age, low baseline lymphocyte count, and the presence of co-morbidities are additional risk factors for poor outcome in this cohort.
Introduction
The risk of morbidity and mortality following SARS-CoV-2 infection in patients with primary immunodeficiency (PID) and secondary immunodeficiency (SID) remains unclear. National epidemiological studies tend to consider immunocompromised individuals as a homogenous group (e.g. HIV-1 infection, solid organ transplant, immunosuppressive medications) and are unable to inform our understanding of outcome in individuals with rare diseases [1, 2].
Instead, retrospective case series have been used to develop our understanding of the risk in patients with PID and SID [3–9]. While the results of such studies must be interpreted with caution, a consistent pattern has emerged showing that the adult patients with PID and SID are at an increased risk of morbidity and mortality from COVID-19 compared to the general population and that an increased prevalence of chronic co-morbidities, potentially driven by underlying immunodeficiency, partially contributes to that risk. The risk of severe morbidity and mortality from COVID-19 in children with PID or SID remains less clear with data from the UK showing no increased risk in this group [7], although mortality has been reported elsewhere [8].
To more comprehensively understand the risk of morbidity and mortality from COVID-19 in patients with PID and SID, the United Kingdom Primary Immunodeficiency Network (UK PIN) has systematically collated outcomes from COVID-19 in patients with PID and SID throughout the pandemic. This national effort has enabled a large cohort of individuals with PID and SID to be developed, and their outcomes understood in comparison to well-curated national statistics.
Herein, we report morbidity and mortality from COVID-19 in a cohort of 310 individuals with PID or SID from the UK; we build upon our previous work [5] by providing revised estimates of mortality in clinically important PID and SID subgroups, insight into independent risk factors for mortality and the efficacy of targeted COVID-19 treatments in this cohort.
Methods
The United Kingdom Primary Immunodeficiency Network (UK PIN) has systematically collected data from its members on the outcomes of SARS-CoV-2 infection in patients under the care of Clinical Immunology teams across the UK since March 2020.
In March 2020, data collection proformas were sent to all UK PIN affiliated paediatric and adult immunologists and centres by email. During the first wave of the UK pandemic (March 2020–July 2020), data collected included age, sex, ethnicity, body mass index, pre-infection lymphocyte count (taken from a full blood count at the last immunology outpatient appointment prior to SARS-CoV-2 infection), prior immunological treatments [e.g. immunoglobulin replacement, immunosuppression (any biologic immunosuppressive within 1 month of SARS-CoV-2 infection, any anti-CD20 depleting agents within 6-months of SARS-CoV-2 infection, or any daily oral immunosuppression including steroids), and antibiotic prophylaxis], existing chronic comorbidities, SARS-CoV-2 PCR result, whether individuals were hospitalized, and whether individuals survived or died. The outcomes from the first 100 cases in this case series have been published previously [5]. During the subsequent waves of the UK pandemic (September 2020–present), additional data collected included whether an individual received any targeted COVID-19 treatments during their inpatient stay and whether an individual seroconverted following natural infection. In the UK, care for hospitalized patients with COVID-19 was protocolized at a national level. Only treatments with demonstrable efficacy in randomized control trials (e.g. RECOVERY) were approved for mainstream use. Patients’ access to dexamethasone, remdesivir, tocilizumab, and antibody-based therapeutics was either through enrolment and randomization within the RECOVERY study, or through protocolized care as laid out by the National Institute for Health and Care Excellence (NICE) guidelines (https://www.nice.org.uk/guidance/ng191/chapter/Recommendations). The published literature was also reviewed to capture any further UK cases of COVID-19 in immunodeficiency patients that had been published elsewhere: this literature search revealed two additional cases [10, 11] which have been included.
Data were collated according to the 2019 IUIS classification of inborn errors of immunity and further analysis was undertaken on three subgroups: (i) individuals with common variable immunodeficiency (including 6 patients with monogenic CVID-like disease secondary to haploinsufficiency of NFκB1, NFκB2, BACH-2, or CTLA-4), collectively referred to as CVID-phenotype, (ii) all individuals with primary immunodeficiency receiving immunoglobulin replacement (IgRT) including CVID but excluding those who had received definitive treatment with allogenic stem cell transplantation or gene therapy (i.e. those with a clinically significant antibody deficiency regardless of proximal diagnosis), and (iii) individuals with secondary immunodeficiency.
Data were analyzed using GraphPad Prism 9.0 (GraphPad Prism Software, San Diego, Calif). Differences between the distributions of continuous variables were evaluated using the 2-tailed Mann–Whitney U test. Differences between categorical variables were evaluated using the 2-tailed Chi-square test. Odds ratios were calculated using the Baptista-Pike method. Infection fatality ratios and case fatality ratios are defined according to the World Health Organisation (https://www.who.int/news-room/commentaries/detail/estimating-mortality-from-covid-19). Briefly, case fatality ratio (CFR) is defined as the total number of deaths from SARS-CoV-2 divided by the total number of PCR-proven SARS-CoV-2 infections. Infection fatality ratio (IFR) is defined as the total number of deaths from SARS-CoV-2 divided by the total number of suspected cases regardless of whether they are proven by molecular diagnostics. Both IFR and CFR are presented to more accurately capture mild COVID-19 cases occurring early in the pandemic (February–May 2020), a period where the UK community transmission was high, but the availability of molecular diagnostics for non-hospitalized cases was low. All deaths reported herein occurred in the individuals with PCR-proven COVID-19. UK national statistics are sourced from the UK Department of Health and Social Care (1/1/2020–29/3/2021). Detailed methodology on how these statistics are collated is available on the UK Coronavirus Dashboard (https://coronavirus.data.gov.uk/). When analyzing pre-SARS-CoV-2 infection lymphocyte counts in the SID cohort, patients with chronic lymphocytic leukaemia were excluded.
Multiple logistic regression models were constructed using survival as the outcome variable. Age and baseline lymphocyte count were included as continuous variables; sex, receipt of prophylactic antibiotics, receipt of immune suppression, and the presence of different comorbidities were included as categorical variables. Odds ratios for continuous variables are expressed as the change in odds of survival per unit increase of that continuous variable within the model. Odds ratios for categorical variables are expressed as the odds ratio associated with mortality if that comorbidity is present.
Results
A total of 310 cases of SARS-CoV-2 infection in patients with PID or SID were recorded between March 2020 and July 2021 from 27 UK PIN affiliated immunology departments representing all four nations of the United Kingdom. Cases included 218 individuals with primary immunodeficiency, 6 of whom had received allogenic stem cell transplantation or gene therapy for their underlying condition, 92 individuals with secondary immunodeficiency. In addition, 13 individuals with C1 inhibitor deficiency and 3 with autoinflammatory diseases were also reported.
In patients with primary or secondary immunodeficiency, 45.8% (n = 142/310) of patients were hospitalized and the overall IFR in this cohort was 17.7% (n = 55/310). Eighty-six percent (n = 268/310) had SARS-CoV-2 confirmed by PCR or rapid antigen testing; the remainder had either an illness consistent with COVID-19 when the availability of molecular testing for SARS-CoV-2 was limited and had the diagnosis made clinically or radiologically. Hospitalization rates, IFR, and CFR data for specific immunodeficiencies are presented in Table 1.
Overall description of UK PIN COVID-19 cohort. Individuals with monogenic CVID-like disease are listed separately and marked with an asterisks. The chronic granulomatous disease (CGD) group included 2 individuals with autosomal recessive CGD, 1 individual with X-linked CGD, and 1 symptomatic carrier. Bone marrow transplantation/gene therapy group included patients with CARMIL-2 deficiency, X-linked SCID, CTPS-1 deficiency, IL-7R deficiency, X-linked CGD, and Wiskott Aldrich syndrome. The secondary immunodeficiency arising from other pathology included organ transplantation patients, clozapine-induced hypogammaglobulinaemia, and protein losing enteropathies. All reported COVID-19 deaths occurred in patients with PCR-proven SARS-CoV-2 infection during their hospital admission.
| Diagnosis | n | Age (y) | Sex n (%F) | Ethnicity n (%BAME) | PCR/antigen proven infection | IgRT | pAbx | Immune suppression | Hospitalised | Deaths | %IFR | %CFR |
|---|---|---|---|---|---|---|---|---|---|---|---|---|
| Predominant antibody deficiencies | ||||||||||||
| Common variable immunodeficiency (genetically undifferentiated) | 87 | 49 (30.7–58.3) | 51 (58.6) | 4 (5.3) | 80 (92.0) | 76 (87.3) | 45 (51.7) | 16 (18.3) | 38 (43.7) | 15 | 17.2 | 18.8 |
| NFKB1 haploinsufficiency∗ | 2 | 34 (27.0–41.0) | 0 (0.0) | 0 (0.0) | 1 (50.0) | 2 (100.0) | 2 (100.0) | 1 (50.0) | 1 (50.0) | 0 | 0.0 | 0.0 |
| BACH2 haploinsufficiency∗ | 2 | 38 (22.0–55.0) | 1 (50.0) | 0 (0.0) | 2 (100.0) | 2 (50.0) | 0 (0.0) | 0 (0.0) | 0 (0.0) | 0 | 0.0 | 0.0 |
| NFKB2 haploinsufficiency∗ | 1 | Adult | 1 (100.0) | 0 (0.0) | 1 (100.0) | 1 (100.0) | 1 (100.0) | 0 (0.0) | 1 (100.0) | 1 | 100.0 | 100.0 |
| CTLA-4 haploinsufficiency∗ | 1 | Adult | 0 (0.0) | 1 (100.0) | 1 (100.0) | 1 (100.0) | 1 (100.0) | 1 (100.0) | 1 (100.0) | 1 | 100.0 | 100.0 |
| XLA | 26 | 29.5 (21.3–33.8) | 0 (100.0) | 6 (23.1) | 22 (84.6) | 26 (100.0) | 16 (61.5) | 0 (0.0) | 11 (42.3) | 2 | 7.7 | 9.1 |
| Undifferentiated primary antibody deficiency | 26 | 52.0 (30.3–72.5) | 18 (69.2) | 1 (3.8) | 20 (76.9) | 14 (53.8) | 12 (46.2) | 2 (7.7) | 6 (23.1) | 4 | 15.4 | 20.0 |
| SPAD | 8 | 57 (51.5–69.8) | 3 (37.5) | 1 (14.3) | 6 (75.0) | 6 (75.0) | 6 (75.0) | 1 (12.5) | 5 (62.5) | 2 | 25.0 | 33.3 |
| Good’s Syndrome | 5 | 72 (60.5–77.5) | 3 (60.0) | 0 (0.0) | 5 (100.0) | 5 (100.0) | 5 (100.0) | 0 (0.0) | 4 (80.0) | 1 | 20.0 | 20.0 |
| Evans Syndrome | 3 | 22.0 (19.0–55.0) | 2 (66.7) | 0 (0.0) | 2 (66.7) | 2 (66.7) | 1 (33.3) | 2 (66.7) | 1 (33.3) | 0 | 0.0 | 0.0 |
| Combined immunodeficiencies | ||||||||||||
| Hyper IgE syndrome (STAT3) | 2 | 36 (26.0–46.0) | 0 (0.0) | 0 (0.0) | 2 (100.0) | 1 (50.0) | 1 (50.0) | 0 (0.0) | 1 (50.0) | 0 | 0.0 | 0.0 |
| Hyper IgM syndrome (2 XL, 1AID) | 3 | 23 (17.0–40.0) | 0 (0.0) | 2 (66.7) | 3 (100.0) | 3 (100.0) | 2 (66.6) | 0 (0.0) | 0 (0.0) | 0 | 0.0 | 0.0 |
| Wiskott Aldrich syndrome | 3 | 37.0 (34.0–39.0) | 0 (0.0) | 1 (33.3) | 3 (100.0) | 3 (100.0) | 2 (66.6) | 0 (0.0) | 0 (0.0) | 0 | 0.0 | 0.0 |
| Undifferentiated CID | 8 | 43.0 (29.0–53.8) | 6 (75.0) | 2 (25.0) | 5 (62.5) | 6 (75.0) | 7 (87.5) | 2 (25.0) | 3 (37.5) | 2 | 25.0 | 40.0 |
| ICOS deficiency | 2 | 32.5 (28.0–37.0) | 2 (100.0) | 1 (50.0) | 2 (100.0) | 1 (50.0) | 1 (50.0) | 1 (50.0) | 1 (50.0) | 0 | 0.0 | 0.0 |
| Idiopathic T cell lymphopaenia | 1 | Adult | 1 (100.0) | 0 (0.0) | 0 (0.0) | 0 (0.0) | 1 (100.0) | 0 (0.0) | 0 (0.0) | 0 | 0.0 | 0.0 |
| GATA-2 | 1 | Adult | 1 (100.0) | 0 (0.0) | 1 (100.0) | 0 (0.0) | 0 (0.0) | 0 (0.0) | 1 (100.0) | 0 | 0.0 | 0.0 |
| TPP2 deficiency | 1 | Child | 1 (100.0) | 1 (100.0) | 1 (100.0) | 0 (0.0) | 1 (100.0) | 1 (100.0) | 1 (100.0) | 0 | 0.0 | 0.0 |
| CARD11 dominant negative | 2 | 21.5 (18.0–25.0) | 1 (50.0) | 0 (0.0) | 2 (100.0) | 0 (0.0) | 1 (50.0) | 0 (0.0) | 1 (100.0) | 0 | 0.0 | 0.0 |
| Syndromic CID | ||||||||||||
| Ataxia teleangectasia | 4 | 11 (5.0–12.8) | 3 (75.0) | 3 (100.0) | 4 (100.0) | 0 (0.0) | 2 (50.0) | 1 (25.0) | 0 (0.0) | 0 | 0.0 | 0.0 |
| Trisomy 21 | 1 | Adult | 1 (100.0) | 0 (0.0) | 1 (100.0) | 1 (100.0) | 1 (100.0) | 0 (0.0) | 1 (100.0) | 1 | 100.0 | 100.0 |
| 22q11 microdeletion | 2 | 19.5 (18.0–21.0) | 0 (0.0) | 0 (0.0) | 2 (100.0) | 0 (0.0) | 0 (0.0) | 0 (0.0) | 1 (50.0) | 0 | 0.0 | 0.0 |
| Kabuki’s syndrome | 1 | Adult | 0 (0.0) | 0 (0.0) | 0 (0.0) | 1 (100.0) | 1 (100.0) | 0 (0.0) | 1 (100.0) | 0 | 0.0 | 0.0 |
| Syndromic immunodeficiency with defect in DNA damage repair | 1 | Adult | 0 (0.0) | 0 (0.0) | 1 (100.0) | 1 (100.0) | 0 (0.0) | 0 (0.0) | 0 (0.0) | 0 | 0.0 | 0.0 |
| Neutrophil defects | ||||||||||||
| Chronic granulomatous disease | 4 | 26.5 (8.0–42.8) | 3 (75.0) | 2 (50.0) | 4 (100.0) | 1 (25.0) | 3 (75.0) | 0 (0.0) | 1 (25.0) | 0 | 0.0 | 0.0 |
| Immunodeficiencies following bone marrow transplantation or gene therapy | ||||||||||||
| Post bone marrow transplant/gene therapy | 6 | 27 (20.8–31.3) | 3 (50.0) | 1 (16.7) | 5 (83.3) | 3 (50.0) | 3 (50.0) | 1 (16.7) | 1 (16.7) | 0 | 0.0 | 0.0 |
| Disorders of immune regulation | ||||||||||||
| XLP | 2 | 30 (23.0–37.0) | 0 (0.0) | 0 (0.0) | 2 (100.0) | 1 (50.0) | 2 (100.0) | 1 (50.0) | 1 (50.0) | 0 | 0.0 | 0.0 |
| ALPS | 3 | 19 (6.0–23.0) | 3 (100.0) | 0 (0.0) | 2 (66.6) | 1 (33.3) | 1 (33.3) | 2 (66.7) | 0 (0.0) | 0 | 0.0 | 0.0 |
| STAT3 GoF | 1 | Adult | 0 (0.0) | 1 (100.0) | 0 (0.0) | 0 (0.0) | 1 (100.0) | 0 (0.0) | 0 (0.0) | 0 | 0.0 | 0.0 |
| Complement deficiencies | ||||||||||||
| C1 inhibitor deficiency | 13 | 45 (29.5-51.5) | 6 (46.1) | 1 (7.7) | 9 (69.2) | a | 1 (7.7) | 0 | 0.0 | 0.0 | ||
| MBL deficiency | 2 | 56.0 (46.0-66.0) | 2 (100.0) | 0 (0.0) | 2 (100.0) | 1 (50.0) | 0 (0.0) | 0 (0.0) | 2 (100.0) | 0 | 0.0 | 0.0 |
| TCC deficiency | 2 | 39.5 (20.0-59.0) | 1 (50.0) | 0 (0.0) | 2 (100.0) | 0 (0.0) | 2 (100.0) | 0 (0.0) | 1 (50.0) | 1 | 50.0 | 50.0 |
| Other primary immunodeficiency | ||||||||||||
| Undifferentiated PID | 5 | 43.0 (18.0-58.0) | 2 (40.0) | 0 (0.0) | 4 (80.0) | 1 (20.0) | 1 (20.0) | 0 (0.0) | 1 (25.0) | 0 | 0.0 | 0.0 |
| Autoinflammatory disease/interferonopathies | ||||||||||||
| Hyper IgD syndrome | 1 | Adult | 1 (100.0) | 1 (100.0) | 0 (0.0) | 0 (0.0) | 0 (0.0) | 1 (100.0) | 0 (0.0) | 0 | 0.0 | 0.0 |
| Aicardi-Gouteres syndrome | 1 | Child | 1 (100.0) | 1 (100.0) | 1 (100.0) | 0 (0.0) | 0 (0.0) | 0 (0.0) | 0 (0.0) | 0 | 0.0 | 0.0 |
| A20 haploinsufficiency | 1 | Child | 1 (100.0) | 0 (0.0) | 1 (100.0) | 1 (100.0) | 1 (100.0) | 1 (100.0) | 1 (100.0) | 0 | 0.0 | 0.0 |
| Secondary immunodeficiency | ||||||||||||
| Secondary to haematological disease | 52 | 65.0 (56.3-74.8) | 25 (48.1) | 6 (11.5) | 46 (88.4) | 37 (71.2) | 27 (51.9) | 15 (31.9) | 29 (55.8) | 12 | 23.1 | 26.1 |
| Secondary to rheumatological disease | 21 | 58.0 (50.0-74.0) | 18 (85.7) | 4 (19.0) | 21 (100.0) | 15 (71.4) | 12 (57.1) | 14 (77.8) | 17 (81.0) | 8 | 38.1 | 38.1 |
| Secondary to respiratory disease | 6 | 67.0 (50.0-79.3) | 4 (66.7) | 0 (0.0) | 5 (83.3) | 3 (50.0) | 6 (100.0) | 4 (66.7) | 4 (66.7) | 3 | 50.0 | 60.0 |
| Secondary to other pathology or not specified | 13 | 57.0 (27.0-67.5) | 6 (46.2) | 3 (23.1) | 11 (84.6) | 7 (53.8) | 10 (76.9) | 4 (36.3) | 6 (46.2) | 2 | 15.4 | 18.2 |
To understand risk factors associated with mortality from COVID-19 in patients with immunodeficiency, the following sub-groups of individuals were considered: individuals with common variable immunodeficiency including those with monogenic CVID-like disease collectively referred to as CVID-phenotype (n =93), individuals with PID receiving immunoglobulin replacement therapy (n = 159), and individuals with secondary immunodeficiency (n = 92).
Common variable immunodeficiency disorder
Ninety-three cases of SARS-CoV-2 infection in patients with a CVID-phenotype were analysed; 87 individuals had genetically undifferentiated CVID and 6 had a monogenic CVID-like disease (Table 1). The median age of this cohort was 48 years (IQR 30.3–57.0), 57.0% (n = 53/93) were female and 51.6% (n = 48/93) were receiving antibiotic prophylaxis. IFR in this cohort was 18.3% (n = 17/93) and increased CFR was observed in all age brackets over 20 years in comparison to national statistics (Table 2). The median age of death from COVID-19 in individuals with CVID was 63.0 years.
Age stratified mortality within major subgroups of the UK PIN COVID-19 cohort
| PID with antibody deficiency (n = 159) | CVID phenotype (n = 92∗∗) | Symptomatic SID (n = 92) | UK National Statistics | ||||||||||||||||||
|---|---|---|---|---|---|---|---|---|---|---|---|---|---|---|---|---|---|---|---|---|---|
| Age | N | PCR+ | Hospitalized (n, %) | Deaths | IFR (%) | CFR (%) | N | PCR + | Hospitalized (n, %) | Deaths | IFR (%) | CFR (%) | N | PCR+ | Hospital-ized(n, %) | Deaths | IFR (%) | CFR (%) | UK cases | UK deaths | UK CFR (%) |
| 0–9 | 4 | 4 | 1 (25.0) | 0 | 0.0 | 0.0 | 173 544 | 15 | 0.009 | ||||||||||||
| 10–19 | 8 | 7 | 2 (25.0) | 0 | 0.0 | 0.0 | 1 | 1 | 0 (0.0) | 0 | 0 | 0.0 | 1 | 1 | 0 (0.0) | 0 | 0.0 | 0.0 | 390 185 | 41 | 0.01 |
| 20–29 | 33 | 28 | 6 (18.2) | 1 | 3.0 | 3.6 | 20 | 18 | 4 (20.0) | 1 | 5.0 | 5.6 | 5 | 1 | 2 (40.0) | 0 | 0.0 | 0.0 | 691 283 | 169 | 0.02 |
| 30–39 | 33 | 25 | 10∗ (30.3) | 1 | 3.0 | 4.0 | 16 | 14 | 6∗ (37.5) | 1 | 6.3 | 7.1 | 5 | 5 | 0 (0.0) | 0 | 0.0 | 0.0 | 670 441 | 547 | 0.08 |
| 40–49 | 21 | 20 | 12 (57.1) | 3 | 14.2 | 15.0 | 14 | 13 | 7 (50.0) | 1 | 7.1 | 7.7 | 6 | 6 | 4 (66.6) | 4 | 66.6 | 66.6 | 586 201 | 1,672 | 0.29 |
| 50–59 | 25 | 23 | 12 (48.0) | 9 | 36.0 | 39.1 | 21 | 18 | 8 (38.1) | 5 | 23.8 | 27.8 | 20 | 18 | 16 (80.0) | 5 | 25.0 | 27.8 | 565 477 | 5,219 | 0.92 |
| 60–69 | 14 | 13 | 5$ (35.7) | 3 | 21.4 | 23.1 | 7 | 7 | 3$ (42.9) | 1 | 14.3 | 14.3 | 22 | 17 | 8 (36.3) | 4 | 18.2 | 23.5 | 303 084 | 11,791 | 3.89 |
| 70–79 | 15 | 15 | 12 (80.0) | 6 | 40.0 | 40.0 | 10 | 10 | 8 (80.0) | 5 | 50.0 | 50.0 | 19 | 17 | 14 (73.7) | 5 | 26.3 | 29.4 | 172 110 | 26,162 | 15.20 |
| 80–89 | 5 | 5 | 5 (100.0) | 2 | 40.0 | 40.0 | 3 | 3 | 3 (100.0) | 2 | 66.7 | 66.7 | 13 | 13 | 12 (92.3) | 7 | 53.8 | 53.8 | 148 327 | 42,331 | 28.54 |
| 90+ | 1 | 1 | 1 (100.0) | 0 | 0 | 0.0 | 68 060 | 23,368 | 34.33 | ||||||||||||
| Total | 158 | 140 | 65 (41.1) | 25 | 15.8 | 17.9 | 92 | 84 | 38 (43.7) | 16 | 17.4 | 19.0 | 92 | 79 | 57 (62.0) | 25 | 27.2 | 31.6 | 3 768 712 | 111,315 | 2.95 |
Age-stratified hospitalization rates, CFR and IFR are presented and compared to UK national statistics for the general population. UK national data are sourced from UK Department of Health and Social Care statistics between 1/1/2020 and 29/3/2021; ∗∗age not provided for one patient with CVID described in Table 1 who died, $excludes one patient admitted with immune thrombocytopenic purpura immediately following SARS-CoV-2 infection, ∗excludes 2 patients attending emergency department but not admitted to hospital. All reported COVID-19 deaths occurred in patients with PCR-proven SARS-CoV-2 infection during their hospital admission.
Univariate analysis demonstrated that increasing age, lower baseline lymphocyte count, receipt of prophylactic antibiotics, and the presence of chronic lung disease, cardiovascular disease, chronic liver disease, diabetes mellitus, and chronic gastrointestinal disease were all associated with a significantly increased risk of mortality from COVID-19 in these individuals (Figure 1, Table S1). Sixty-four percent of individuals who died had a pre-COVID lymphocyte count less than 1.0 × 10⁹/L compared to 21.8% who survived (P < 0.0001). The use of current immunosuppression was significantly over-represented in patients with a lymphocyte count less than 1.0 × 10⁹/L (36.0% vs. 13.3%, P = 0.02), as was the prevalence of granulomatous-lymphocytic interstitial lung disease (GL-ILD) (28.0% vs. 10.0%, P = 0.04), organ-specific autoimmunity (48.0% vs. 18.0%, P = 0.005) and splenomegaly (24.0% vs. 8.0% P = 0.05) in comparison to individuals with CVID with a lymphocyte count greater than 1.0 × 10⁹/L. In multivariate analysis, a low pre-SARS-CoV-2 infection lymphocyte count and receipt of prophylactic antibiotics were independently associated with an increased risk of mortality from COVID-19 in these individuals (Table S2). Six patients who survived COVID-19 had serological responses to natural infection measured; 100% were found to be positive (5 spike glycoprotein antibody positive, 1 nucleocapsid antibody positive).
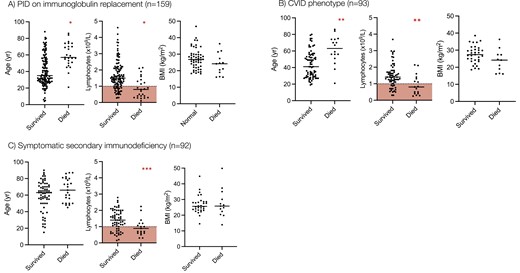
Risk factors for mortality from COVID-19 in patients with PID and SID. Age, baseline lymphocyte count, and body mass index are compared between COVID-19 survivors and non-survivors in patients with (A) PID on immunoglobulin replacement, (B) Common variable immunodeficiency, and (C) Secondary immunodeficiency. Statistical comparison of the groups is made using the 2-tailed Mann–Whitney U test. ∗P < 0.0001, ∗∗P = 0.003, ∗∗∗P = 0.03. Red shaded area denotes lymphopenia (<1.0 × 10⁹/L).
PID receiving immunoglobulin replacement therapy
One-hundred and fifty-nine cases of SARS-CoV-2 infection in individuals with PID receiving IgRT have been recorded in this case series. The median age of these individuals was 40 years (IQR 28.0–56.3), 44.7% (n = 71/159) were female and in addition to IgRT, 55.3% (n = 88/159) were receiving prophylactic antibiotics. The patients hospitalized as a result of SARS-CoV-2 infection (41.5%, n = 66/159), a further 2 patients attended the emergency department but were not admitted to hospital and 1 patient was admitted for a flare of immune thrombocytopenia purpura, temporally associated with SARS-CoV-2 infection. IFR in this subgroup was 16.3% (n = 26/159) and an increased CFR was observed in all age brackets above 20–29 compared to UK national statistics (Table 2). The median age of death from COVID-19 in this cohort was 57.0 years compared to the UK national average of 83.0 years.
In univariate analysis, patients with PID receiving IgRT who died of COVID-19 were significantly older, had lower pre-SARS-CoV-2 infection lymphocyte counts (Figure 1A) and had a significantly higher prevalence of chronic lung disease (specifically bronchiectasis), cardiovascular disease, chronic liver disease, and diabetes mellitus than those who survived (Table 3). 61.5% of individuals who died had a pre-infection lymphocyte count of less than 1.0 × 10⁹/L compared to 21.8% who survived (P < 0.0001). The use of current immunosuppression was significantly over-represented in patients with a lymphocyte count less than 1.0 × 10⁹/L (23.8% vs. 10.7%, P = 0.04) in this subgroup, as was the prevalence of GL-ILD, organ-specific autoimmunity, and splenomegaly. In multivariate analysis, a higher pre-infection lymphocyte count was independently associated with survival but chronic liver disease and diabetes mellitus were independently associated with mortality (Table 4).
Univariate analysis of risk factors associated with mortality in PID with antibody deficiency Median and interquartile ranges are provided for continuous variables. Differences between the distributions evaluated using 2-tailed Mann–Whitney U test. Differences between categorical variables are evaluated using 2-tailed Fisher exact test with ORs calculated using the Baptista-Pike method
| Parameter | Survived (n = 133) | Died (n = 26) | OR (95% CI) | P |
|---|---|---|---|---|
| Age (yrs) | 35.0 (27.5–53.0) | 57.0 (50.5–72.0) | <0.0001 | |
| Sex (n,% female) | 60 (45.9) | 11 (42.3) | 0.89 (0.40–2.06) | 0.79 |
| Pre-SARS-CoV-2 infection lymphocyte count (×109/L) | 1.50 (1.07–2.11) | 0.80 (0.35–1.35) | <0.0001 | |
| Body mass index (kg/m2) | 26.9 (22.7–30.4) | 24.2 (17.7–29.4) | 0.0559 | |
| Prophylactic antibiotics (n, %) | 71 (53.8) | 18 (72.0) | 2.21 (0.88–5.59) | 0.0920 |
| Current immunosuppression (n, %) | 20 (15.0) | 2 (7.7) | 0.47 (0.10–1.87) | 0.3212 |
| Chronic lung disease (n, %) | 63 (47.7) | 19 (76.0) | 3.47 (1.32–8.98) | 0.0095 |
| Bronchiectasis | 41 (31.3) | 13 (52.0) | 2.38 (0.96–5.36) | 0.0462 |
| Granulomatous interstitial lung disease | 13 (8.3) | 2 (8.0) | 1.27 (0.28–5.95) | 0.7650 |
| Cardiovascular disease (n, %) | 10 (7.6) | 7 (28.0) | 4.74 (1.72–13.68) | 0.0026 |
| Rheumatological disease (n, %) | 4 (3.0) | 1 (4.0) | 1.33 (0.10–8.68) | 0.08001 |
| Chronic liver disease (n, %) | 17 (12.9) | 8 (32.0) | 3.18 (1.17–8.30) | 0.0166 |
| Diabetes mellitus (n, %) | 4 (3.0) | 6 (24.0) | 10.0 (2.72–32.9) | <0.0001 |
| Chronic renal disease (n, %) | 3 (2.3) | 2 (8.0) | 3.74 (0.62–18.90) | 0.1348 |
| Autoimmune cytopaenia (n, %) | 29 (22.0) | 6 (24.0) | 1.12 (0.41–3.14) | 0.8230 |
| Chronic gastrointestinal disease (n, %) | 17 (12.9) | 7 (28.0) | 2.63 (1.01–7.07) | 0.0540 |
| Haematological malignancy (n, %) | 7 (5.3) | 1 (4.0) | 0.74 (0.06–4.50) | 0.7802 |
| Splenomegaly (n, %) | 16 (11.9) | 3 (12.0) | 1.01 (0.29–3.37) | 0.9933 |
| Organ specific autoimmunity (n, %) | 6 (4.5) | 3 (12.0) | 2.87 (0.74–10.64) | 0.1383 |
Multivariate analysis of risk factors associated with mortality in PID with antibody deficiency
| Variable | Odds ratio | 95% confidence interval | Z | P value |
|---|---|---|---|---|
| Age | 0.97 | 0.93–1.01 | 1.36 | 0.17 |
| Male sex | 2.61 | 0.58–13.2 | 1.23 | 0.22 |
| Pre SARS-CoV-2 infection lymphocyte count | 10.8 | 2.85–65.2 | 3.05 | 0.002 |
| Prophylactic antibiotics | 2.68 | 0.59–14.8 | 1.23 | 0.22 |
| Immune suppression | 0.18 | 0.009–1.55 | 1.4 | 0.16 |
| Bronchiectasis | 2.54 | 0.54–12.9 | 1.17 | 0.24 |
| GL-ILD | 0.54 | 0.02–6.12 | 0.45 | 0.65 |
| Cardiovascular disease | 6.76 | 0.64–88.8 | 1.55 | 0.12 |
| Rheumatological disease | 3.46 | 0.02–987 | 0.47 | 0.64 |
| Chronic liver disease | 16.5 | 2.05–160 | 2.56 | 0.01 |
| Diabetes mellitus | 20.6 | 1.64–465 | 2.13 | 0.03 |
| Chronic kidney disease | 1.81 | 0.02–64.5 | 0.29 | 0.77 |
| Autoimmune cytopenias | 0.07 | 0.004–0.61 | 2.18 | 0.03 |
| Chronic gastrointestinal disease | 1.79 | 0.33–8.95 | 0.70 | 0.48 |
| Haematological malignancy | 0.64 | 0.001–27.8 | 0.17 | 0.87 |
| Splenomegaly | 0.37 | 0.02–5.08 | 0.72 | 0.47 |
| Other organ specific autoimmunity | 5.84 | 0.39–80.9 | 1.31 | 0.19 |
X-linked agammaglobulinaemia
Twenty-six patients with X-linked agammaglobulianemia were included (Table 1). The cohort of XLA patients was, on average, younger than other individuals with antibody deficiency (median age 29.5 years) and IFR was lower at 7.7% (n = 2/26). Of the two individuals who succumbed to COVID-19, one had received lung transplantation for respiratory complications of their immunodeficiency [11]; the other was reported to suffer from nodular regenerative hyperplasia but had no pre-existing structural lung disease and died despite receiving treatment with dexamethasone, remdesivir, tocilizumab, and convalescent plasma.
Secondary immunodeficiency
Ninety-two patients with SID, under the care of a clinical immunologist, were included in this case series (Table 1). This cohort was, on average, older than the PID cohort with a median age of 63.0 years and outcomes were worse, with an IFR of 27.2% (n = 25/92). Compared to UK national statistics, higher IFR was observed in all age brackets above 40 years (Table 2). Haematological malignancy and its treatment was the most common cause of secondary immunodeficiency in this cohort accounting for 56.5% (n = 52/92) of cases: non-Hodgkin’s lymphoma (n = 27), chronic lymphocytic leukaemia (n = 11), and plasma cell dyscrasias were the most common underlying diseases in this group. 55.8% (n = 29/52) of these patients were hospitalized with an IFR of 23.1% (n = 12/52).
Individuals whose secondary immunodeficiency arose from the underlying rheumatological disease were younger, more likely to be receiving immune suppression at the time of infection, and had a higher IFR of 38.1% (n = 8/21). In univariate analysis, patients with SID who died from COVID-19 had significantly lower pre-infection lymphocyte counts than those who survived (Figure 1, Table 5). 52.6% of individuals who died had pre-SARS-CoV-2 lymphocyte count less than 1.0 × 10⁹/L compared to 26.6% who survived (P = 0.03). We also observed that in the SID cohort, patients receiving daily prednisolone as immunosuppression were far more likely to die than those not receiving daily prednisolone (mortality 44.0% vs. 7.46%, P < 0.0001). However, multivariate analysis did not show a significant independent effect of any of these variables (Fig. S3). Seroconversion following natural infection was lower in SID than in CVID; 14 patients were assessed and 42.8% (n = 6/14) were found to be seropositive following their illness compared to 100% (n = 6/6) in CVID.
Univariate analysis of risk factors associated with mortality in SID. Median and interquartile ranges are provided for continuous variables. Differences between the distributions evaluated using 2-tailed Mann–Whitney U test. Differences between categorical variables, evaluated using 2-tailed Fisher exact test with ORs calculated using the Baptista-Pike method
| Parameter | Survived (n = 67) | Died (n = 25) | OR (95% CI) | P |
|---|---|---|---|---|
| Age (yrs) | 63.0 (50.0–71.0) | 66.0 (50.0–80.0) | 0.21 | |
| Sex (n,% Female) | 38 (56.7%) | 15 (60.0%) | 1.15 (0.47––2.91) | 0.99 |
| Pre SARS-CoV-2 infection lymphocyte count (×109/L) | 1.40 (0.87–1.90) | 0.89 (0.60–1.20) | 0.03 | |
| Body mass index (kg/m2) | 26.0 (23.4–29.2) | 25.8 (21.3–32.6) | 0.67 | |
| Immunoglobulin replacement (n, %) | 43 (64.2) | 19 (76.0) | 1.77 (0.64–5.08) | 0.28 |
| Prophylactic antibiotics (n, %) | 40 (59.7) | 15 (60.0) | 1.01 (0.41–2.57) | 1.01 |
| Current immunosuppression (n, %) | 26 (38.8) | 14 (56.0) | 2.01 (0.82–5.23) | 0.14 |
| Chronic lung disease (n, %) | 23 (34.4) | 12 (48.0) | 1.77 (0.70–4.44) | 0.23 |
| Bronchiectasis | 12 (17.9) | 3 (12.0) | 0.63 (0.18–2.38) | 0.49 |
| Granulomatous interstitial lung disease | n/a | n/a | n/a | n/a |
| Cardiovascular disease (n, %) | 17 (25.4) | 11 (44.0) | 1.73 (0.16–1.19) | 0.08 |
| Rheumatological disease (n, %) | 14 (20.9) | 8 (32.0) | 1.78 (0.61–5.18) | 0.27 |
| Chronic liver disease (n, %) | 1 (1.49) | 1 (4.0) | 2.75 (0.14–52.9) | 0.46 |
| Diabetes mellitus (n, %) | 7 (10.5) | 5 (20.0) | 2.14 (0.66–7.33) | 0.23 |
| Chronic renal disease (n, %) | 11 (16.4) | 3 (14.3) | 0.69 (0.19–2.74) | 0.60 |
| Autoimmune cytopaenia (n, %) | 2 (2.99) | 3 (12.0) | 4.43 (0.84–25.72) | 0.09 |
| Chronic gastrointestinal disease (n, %) | 5 (7.5) | 1 (4.0) | 0.52 (0.04–4.24) | 0.55 |
| Haematological malignancy (n, %) | 40 (59.7) | 13 (52.0) | 0.73 (0.30–1.83) | 0.50 |
| Splenomegaly (n, %) | 3 (4.5) | 0 (0.0) | 0.00 (0.00–3.09) | 0.28 |
| Organ specific autoimmunity (n, %) | 2 (2.99) | 2 (8.0) | 2.83 (0.42–18.59) | 0.29 |
C1 inhibitor deficiency
Data on the outcomes of 13 patients with C1 inhibitor deficiency were submitted, all of whom survived (Table 1); the median age of patients with C1 inhibitor deficiency was 45 years (IQR: 29.5–51.5) and 46.1% were female. Only one patient, a man in his 20s with other pre-existing comorbidities, required hospital treatment specifically for COVID-19; another required hospitalization for renal disease. Of note, additional information was submitted for 2 patients implicating SARS-CoV-2 infection as a precipitating factor for concurrent flares of hereditary angioedema, as has been previously reported [12, 13].
Acute treatments for COVID-19
Hundred and forty-four patients in this cohort required hospital treatment for COVID-19, with an overall inpatient survival of 61.8% (n = 89/144). 22.9% of hospitalized patients (n = 33/144) received a targeted COVID-19 treatment within the RECOVERY trial, on a compassionate use basis, or as standard of care following the adoption of treatment proven to be efficacious in the RECOVERY trial (Table 6). In this cohort, 20 patients received dexamethasone, 26 patients received remdesivir, and 10 patients received anti-SARS-CoV-2 antibody-based therapies (e.g. REGEN-COV2, convalescent plasma) either as a monotherapy or in combination: the survival rates of individual patients treated with dexamethasone and/or remdesivir and/or antibody-based treatments exceeded 75%. Five patients received tocilizumab as a monotherapy or in combination: survival rates in this cohort were 20%.
Targeted COVID-19 treatments used in patients with PID or SID. One-hundred and forty-four patients in this cohort were admitted to hospital of whom 29.9% (n = 33/144) received specific COVID-19 treatments through the RECOVERY trial or through compassionate use programs are described. Two patients randomized to standard care in the RECOVERY trial, 1 patient who refused randomization in the RECOVERY trial and 1 patient who received lopinavir/ritonavir are excluded.
| Treatment | n | Age (median) | Survived (n, %) |
|---|---|---|---|
| Dexamethasone overall | 20 | 51.3 | 15 (75.0) |
| Dexamethasone monotherapy | 5 | 46.0 | 4 (80.0) |
| Dexamethasone + remdesivir | 8 | 56.0 | 8 (100.0) |
| Remdesivir overall | 26 | 54.5 | 22 (84.6) |
| Remdesivir monotherapy | 7 | 57.0 | 7 (100.0) |
| Antibody based therapies overall | 10 | 52.5 | 8 (80.0) |
| REGEN-COV-2 monotherapy | 1 | 70s | 1 (100.0) |
| REGEN-COV2 + remdesivir | 1 | 80s | 1 (100.0) |
| REGEN-COV2 + remdesivir + dexamethasone | 2 | 33.0 | 2 (100.0) |
| Convalescent plasma + remdesivir | 4 | 53.5 | 3 (75.0) |
| Tocilizumab overall | 5 | 60.0 | 1 (20.0) |
| Tocilizumab monotherapy | 1 | 60s | 0 (0.0) |
| Tocilizumab + dexamethasone | 1 | 70s | 0 (0.0) |
| Tocilizumab + dexamethasone + remdesivir | 1 | 50s | 0 (0.0) |
| Tocilizumab + dexamethansone + remdesivir + convalescent plasma | 1 | 40s | 0 (0.0) |
| Tocilizumab + dexamethansone + remdesivir + REGEN-COV2 | 1 | 70s | 1 (100.0) |
Discussion
The UK has recorded amongst the highest number of cases (8918 per 100 000 population) and deaths (193.9 per 100 000 population) from COVID-19 in the world [14]. Despite public health measures to minimize the exposure of clinically extremely vulnerable individuals to SARS-CoV-2 [15], the pandemic has disproportionately affected patients with PID and SID. In this large nationwide study, we demonstrate an increased risk of mortality from COVID-19 in individuals with PID requiring antibody replacement therapy and individuals with CVID in all age groups above 20 years old compared to the UK general population. In patients with SID, an increased risk of mortality emerges beyond 40 years of age. Inpatient mortality in patients with immunodeficiency was higher than the general population (38.2% vs. 26.0%) [1]. In comparison to the general population, where the median age of death from COVID-19 was 83.0 years, immunodeficiency patients died, on average, up to 26 years younger than the general population.
The risk factors for the poor outcome from COVID-19 in patients with primary immunodeficiencies closely mirror those in the general population [16]; increasing age and common comorbidities were all associated with an increased risk of death in univariate analysis; chronic liver disease and diabetes mellitus (PID on IgRT) and receipt of prophylactic antibiotics (CVID) were independently associated with death in multivariate analysis of these cohorts. In SID, no additional independent risk factors were observed, but the overall CFR of 31.6% compared to 2.95% in the UK general population illustrates the vulnerability of individuals requiring long-term immunological support following treatment for other diseases. Furthermore, the CFR of 38.1% for patients with rheumatological disease in this study is markedly higher than the estimated CFR of 5.6% for unselected rheumatoid arthritis patients demonstrating the subgroup of patients with SID are at especially high risk of poor outcomes [17]. Our data also highlights that those individuals with secondary immunodeficiency who continue to receive treatment with any daily dose of prednisolone also appear at increased risk of mortality. Reassuringly and concordant with other UK studies in immunocompromised children [7], we found no increased risk of mortality amongst the 18 paediatric patients within this study, although 27.7% were hospitalised.
One striking observation from this study is that pre-existing lymphopenia is independently associated with mortality in all three groups with immunodeficiency. Previous studies have demonstrated that pre-existing lymphopenia is independently associated with an increased risk of developing pneumonia, skin infections, urinary tract infections, sepsis, and endocarditis in the Danish general population [18] and an increased risk of mortality from pneumonia in the UK general population [19]. Peripheral CD4 and CD8 T-cell lymphopenia and dysregulated T-cell responses have also been associated with the severe disease during acute COVID-19, although some studies suggest this observation is secondary to lymphocyte redistribution during acute illness [20, 21]. In our study, pre-existing lymphopenia in patients with CVID and PID receiving IgRT was associated with GL-ILD, organ-specific autoimmunity and splenomegaly, and the use of immunosuppressive drugs. The relative contributions of these variables to the pathogenesis of the observed lymphopenia remain unclear; characterizing the nature of pre-existing lymphopenia, its composition by lymphocyte subsets analysis, and its impact on functional immunity with respect to outcomes from infectious disease is an important research priority in both the general population and patients with immune deficiency.
There is a paucity of evidence regarding the efficacy of treatments for COVID-19 in patients with PID and SID [22]. In this case series, compared to an overall inpatient survival following COVID-19 of 61.8%, survival was improved in individuals who received dexamethasone (75.0%), remdesivir (84.6%), or antibody-based treatments (80.0%) as a monotherapy or in any combination. In contrast, only 20% of individuals receiving tocilizumab survived. These data require cautious interpretation; specific data on the timing of these pharmacological interventions in relation to disease onset and COVID-19 severity was not gathered as part of this study and the number of treated individuals is small. However, it is possible, or even likely, that modulation of the immune response in a patient with immunodeficiency is different from the general population. For example, although convalescent plasma demonstrated no benefit in healthy individuals during acute severe COVID-19 infection [23], antibody-based treatments appear effective herein and in case reports of antibody deficiency patients were ex vivo studies have confirmed viral neutralization [24]. Furthermore, polyclonal immunoglobulin replacement is the standard of care in the prevention of chronic sinopulmonary infection in individuals with antibody deficiency and hyperimmune serum may be used for post-exposure prophylaxis in seronegative individuals against certain infectious diseases, a concept supported by early data in anti-SARS-CoV-2 monoclonal antibody trials [25, 26]. Similarly, inhibition of the IL-6 axis in individuals already suffering from an existing immunodeficiency may have unintended consequences despite success in randomized control trials in previously healthy individuals [27].
There are significant differences in the estimated mortality rates from COVID-19 in the different national and international registry-based studies published to date [3–9] and many estimates of the case fatality ratio in patients with inborn errors of immunity do not exceed those of the general population [28]. Comparison of national statistics is challenging; differences in the response to and course of the pandemic worldwide will impact mortality statistics. The age-stratified CFR reported in this study are broadly concordant with other studies: the risk of death in paediatric patients is very low regardless of their underlying immunodeficiency but a significantly increased risk of morbidity and mortality does emerge with increasing age, becoming pronounced above the age of 40 years in comparison to the general population. The high overall CFR observed in this study may arise because the UK PIN cohort is, on average, older than the cohorts reported in other studies which are relatively enriched with paediatric patients [3–9]. The difference in access to rational therapeutics to treat severe COVID-19 may also contribute to the observed differences.
The major strength of this study is its size and comprehensive representation amongst UK PIN affiliated centres across the United Kingdom reducing the potential for bias seen in smaller case series and facilitating the enrolment of large numbers of patients with a rare disease. The work confirms the increased risk of mortality from COVID-19 we observed in our original case series [5] and builds upon it by providing revised estimates of the magnitude of that risk in relation to the UK general population and the determinants of that risk in clinically relevant disease subgroups. However, this study remains a clinician-reported registry and we are unable to guarantee that all SARS-CoV-2 infections in patients with PID or SID have been captured by this study. Furthermore, bias may exist within the SID cohort described herein; by definition, these individuals have been referred to a Clinical Immunologist for immunological assessment which may enrich for more severe phenotypes of SID. Cases of SARS-CoV-2 in paediatric patients remain underrepresented by this study, but similar outcomes in a larger cohort of UK patients have been reported elsewhere [7]. Owing to the retrospective nature of this study, we are unable to characterize the nature or longevity of serological responses of individuals with PID or SID following natural infection; however, the COV-AD study, a national UK study studying the cellular and humoral response to SARS-CoV-2 natural infection and vaccination is in progress and will be able to inform upon these important immunological questions.
In summary, our study highlights the burden of morbidity and mortality in individuals with PID and SID following infection with SARS-CoV-2 and elucidates independent risk factors associated with poor outcomes. The impact of the COVID-19 on individuals with PID and SID cannot be underestimated; these data must inform public health policy, including the urgent provision of anti-SARS-CoV-2 antibody-based therapies in this population, to minimize the risk of poor outcomes during future waves of the evolving pandemic.
Abbreviations
- AID
activation-induced cytidine deaminase
- ALPS
autoimmune lymphoproliferative syndrome
- AR
autosomal recessive
- BACH 2
BTB domain and CNC homolog 2
- CARD 11
caspase recruitment domain family member 11
- CFR
case:fatality ratio
- CGD
chronic granulomatous disease
- CID
combined immunodeficiency
- CTLA-4
cytotoxic T-lymphocyte associated protein 4
- CVID
common variable immunodeficiency disorder
- GATA-2
GATA-binding factor 2
- GoF
gain of function
- ICOS
inducible T-cell costimulator
- IFR
infection:fatality ratio
- MBL
mannose-binding lectin
- NFκB
nuclear factor kappa B
- PID
primary immunodeficiency
- SID
secondary immunodeficiency
- SPAD
specific polysaccharide antibody deficiency
- STAT
signal transducer and activator of transcription
- TCC
terminal complement complex
- TPP-2
tripeptidyl peptidase 2
- XL
X-linked
- XLA
X-linked agammaglobulinaemia
- XLP
X-linked lymphoproliferative disorder.
Acknowledgements
The authors would like to acknowledge the wider immunology community, in particular those individuals living with primary and secondary immunodeficiency and their families for their patience and resilience throughout the COVID-19 pandemic.
Funding
No specific funding was received for this study.
Competing interests
The authors declare no competing interests.
Author contributions
A.M.S., S.O.B., S.S., and A.G.R. conceived the study. A.M.S. collated the data, analysed the data, produced the first draft of the manuscript and revised the manuscript. S.O.B., S.S. and A.G.R. are the joint senior authors of this manuscript. All authors contributed to data collection and reviewed the revised manuscript prior to submission.
Ethics approval
This study reports fully anonymized, routinely collected data regarding patient outcomes. No specific ethical approval is required for collation or publication in accordance with HRA guidance.
Consent to participate
Not applicable
Consent for publication
Not applicable
Data availability
All available data is presented within the figures and tables of this manuscript.
Code availability
No code has been used in the preparation of this manuscript.
References
Author notes
These authors contributed equally and shared joint senior authorship.
