


Abstract
Neocortical injury initiates a cascade of events, some of which result in maladaptive epileptogenic reorganization of surviving neural circuits. Research focused on molecular and organizational changes that occur following trauma may reveal processes that underlie human post-traumatic epilepsy (PTE), a common and unfortunate consequence of traumatic brain injury. The latency between injury and development of PTE provides an opportunity for prophylactic intervention, once the key underlying mechanisms are understood. In rodent neocortex, injury to pyramidal neurons promotes axonal sprouting, resulting in increased excitatory circuitry that is one important factor promoting epileptogenesis. We used laser-scanning photostimulation of caged glutamate and whole-cell recordings in in vitro slices from injured neocortex to assess formation of new excitatory synapses, a process known to rely on astrocyte-secreted thrombospondins (TSPs), and to map the distribution of maladaptive circuit reorganization. We show that this reorganization is centered principally in layer V and associated with development of epileptiform activity. Short-term blockade of the synaptogenic effects of astrocyte-secreted TSPs with gabapentin (GBP) after injury suppresses the new excitatory connectivity and epileptogenesis for at least 2 weeks. Results reveal that aberrant circuit rewiring is progressive in vivo and provide further rationale for prophylactic anti-epileptogenic use of gabapentinoids following cortical trauma.
Introduction
Post-traumatic epilepsy (PTE) is one of the most common forms of acquired epilepsy worldwide. Individuals with a traumatic brain injury (TBI) are 1.5–29 times more likely than the general population to develop epilepsy, and in cases of severe head trauma such as ballistic injuries sustained during combat, the risk factor can be as high as 50% (Caveness et al. 1979; Salazar et al. 1985; Annegers and Hauser 1998; Lowenstein 2009). PTE can be difficult to treat with currently available medications or surgical techniques, and attempts to prevent PTE with anticonvulsant drugs have not been successful (Schierhout and Roberts 2001; Beghi 2003; Temkin 2009). Seizures often occur after a latent period of months to years following a TBI and the precise molecular mechanisms that precipitate the first seizure are unknown. However, understanding the epileptogenic process in animal models may lead to new pharmacotherapeutic targets aimed at preventing PTE.
In animal models of neocortical (Salin et al. 1995; Carmichael and Chesselet 2002; Li and Prince 2002; Chuckowree et al. 2004; Jin et al. 2006) and hippocampal trauma (Tauck and Nadler 1985; McKinney et al. 1997), and also in human epileptogenic temporal lobes (de Lanerolle et al. 1989; Davenport et al. 1990), neuronal circuits reorganize in response to injury and can become hyperexcitable. In the neocortical isolation (cortical undercut or UC) model of PTE, axotomized layer V pyramidal neurons sprout new axon collaterals over the course of several weeks. This reactive sprouting is associated with enhanced recurrent excitatory connectivity and in vitro epileptiform activity that propagates throughout the cortical circuit (Prince and Tseng 1993; Hoffman et al. 1994; Salin et al. 1995; Jin et al. 2006). Epileptiform activity and seizures in vivo also develop after a latency in this model of post-traumatic epileptogenesis (Graber and Prince 2006; Chauvette et al. 2016; Ping and Jin 2016).
Excitatory synapse formation both in vitro and during development is dependent in part on astrocyte-secreted thrombospondins (TSPs) binding to neuronal alpha2delta-1 (α2δ-1) auxiliary subunits of voltage-gated calcium channels (VGCCs; Christopherson et al. 2005; Eroglu et al. 2009). TSP expression is low in the adult brain, but increases after nerve and brain injury. This injury-induced increase in TSP expression correlates with the acquisition of maladaptive synaptic circuitry in models of allodynia (Lin et al. 2003; Liauw et al. 2008; Kim et al. 2012). Gabapentin (GBP) is a potent and selective ligand at α2δ-1 (Li et al. 2011). When GBP is administered to rodents during development, sensory barrel formation is disrupted, presumably because GBP interferes with normal TSP-mediated excitatory synaptogenesis (Eroglu et al. 2009). GBP also shows efficacy in human and animal models of neuropathic pain, presumably by blocking the formation of injury-induced, TSP-dependent neuropathic circuitry (Luo et al. 2002).
We have recently shown that expression of TSP and α2δ-1 is upregulated in the reductions were seen in markers of neuronal injury, excitatory synapse formation was reduced, and in vitro epileptiform burst activity was less frequent (Li et al. 2012). Experiments in the pilocarpine-induced status epilepticus (SE) rat model of epileptogenesis have also shown that GBP reduces seizure-induced markers of glial and neuronal injury in the hippocampus (Rossi et al. 2013). Similar results have been recently reported in the freeze lesion model of microgyria (Andresen et al. 2014). The effects of GBP on reorganization of excitatory circuits after neocortical lesion have not been examined. In the current study, we used laser-scanning photostimulation (LSPS) to detail the time course and distribution of changes in excitatory synaptic circuitry at 3 and 14 days after UC lesion. Consistent with previous results (Jin et al. 2006), we find that excitatory circuits are substantially reorganized 14-day postlesion. Furthermore, we determine that GBP administration during the first 3 days after the lesion limits the formation of aberrant recurrent excitatory connectivity, specifically in layer V, and protects against the occurrence of chronic epileptiform activity as assessed in in vitro neocortical slices 2 weeks later. Portions of these results have been published in abstract form (Takahashi et al. 2012).
Materials and Methods
Partial Cortical Isolations
All procedures were conducted according to National Institutes of Health Guide for the Care and Use of Laboratory Animals and protocols approved by the Stanford Institutional Animal Care and Use Committee. Partial islands of neocortex (i.e., UCs) were isolated in anesthetized male rats at postnatal day 21 (P21, P0 = date of birth) as described previously (Hoffman et al. 1994; reviewed in Graber and Prince 2006). Briefly, animals were deeply anesthetized with ketamine (80 mg/kg, i.p.) and xylazine (8 mg/kg, i.p.) and mounted in a stereotactic frame. A unilateral cranial bone window (~3 × 5 mm) centered on the coronal suture was removed, leaving the dura intact, to expose a portion of the fronto-parietal cortex. A 30-gauge needle bent at a right angle 3 mm from the tip was inserted parasagitally ~1–2 mm from the central sulcus with the needle point aimed rostrally. The needle was advanced tangentially through the dura and pia, just beneath the pial vessels, and lowered to a depth of 2 mm. The needle was then rotated on its longitudinal axis by ~120°–180° to produce a contiguous white matter lesion. The needle was then elevated to a position just under the pia to make a second transcortical cut and removed. The skull opening was covered with sterile Saran Wrap and the skin sutured. The animals were then allowed to recover in a temperature- and light-controlled (12 h light/dark cycle) environment with access to food and water ad libitum.
GBP Administration
GBP (100 mg/kg) or saline was administered (i.p.) to UC animals by random assignment within the first hour following surgery, and continued 3×/day for 3 days (on P21–P23), following protocols established in Li et al. (2012). Although the dosages of GBP in our study would be considered on the higher end of the spectrum, we found 100 mg/kg 3× day to be an effective dose to limit injury-induced synaptogenesis in the earlier study (Li et al. 2012) and, therefore, used this dosage. The researcher administering the drug blinded the treatment condition to the experimenter acquiring the electrophysiological data. Assignment was revealed once the data were collected and analyzed. Several groups of rats were used: Naïve, age-matched male controls (P24, n = 5), UC animals treated with saline for 3 days after injury (P24, n = 8), and UC animals that received GBP for 3 days after injury (P24, n = 5). Similarly, the 14-day UC group consisted of naïve, age-matched male controls (P35, n = 4), UC animals 14 days after injury (P35, n = 6) that had received saline for the first 3 days after injury, and UC animals 14 days after injury (P35, n = 5) that had received GBP for the first 3 days after injury.
Slice Preparation and Electrophysiology
Animals were deeply anesthetized with sodium pentobarbital (55 mg/kg, i.p.), brains rapidly removed and placed in ice-cold (4 °C) sucrose artificial cerebrospinal fluid (sACSF) cutting solution containing (in mM): 234 sucrose, 26 NaHCO3, 11 glucose, 10 MgSO4, 2.5 KCl, 1.25 NaH2PO4, and 0.5 CaCl2 gassed with 95% O2/5% CO2. Brains were then blocked and mounted on a vibratome stage (VT 1200, Leica). Coronal brain slices (350 μm) containing the sensorimotor cortex (the region of injury in UC animals) were cut in oxygenated sACSF and immediately transferred to an incubation chamber filled with oxygenated ACSF containing (in mM): 126 NaCl, 26 NaHCO3, 10 glucose, 2.5 KCl, 1.25 NaH2PO4, 2 CaCl2, and 1 MgSO4; osmolarity 295–300 mOsm, pH 7.4 when gassed with 95% O2/5% CO2. Slices were incubated at 34 °C for 1 h and then at room temperature until they were transferred to the recording chamber.
Patch electrodes were pulled from borosilicate glass (1.5 mm OD, Sutter Instruments) and had an impedance of 3–4 MΩ when filled with a potassium gluconate internal solution that contained (in mM): 130 K-gluconate, 10 KCl, 10 HEPES, 10 EGTA, 3 ATP-Mg, 0.3 GTP-Na (pH 7.40, 295 mOsm). Whole-cell voltage clamp recordings were made from minimally submerged brain slices in a custom-built recording chamber. Cells were visualized using infrared differential interference contrast (IR-DIC) microscopy (Zeiss Axioskop, Carl Zeiss) and a 63× water immersion lens (Achroplan 63×, 0.9W, Carl Zeiss). Cells with pyramidal shaped somata and a single emerging dendrite extending toward the pial surface were selected. A number of neurons were filled with biocytin and identified retrospectively as pyramidal cells; however, their structures were not otherwise analyzed. We limited our sample to non-bursting cells in layer Va (Chagnac-Amitai et al. 1990). The cells that were recorded in current clamp and subsequently subjected to LSPS mapping were all regular spiking (i.e., non-burst generating) with spike frequency adaptation. Based on input resistance, they were also similar in size. Recordings were obtained with a Multiclamp 700A amplifier and Clampex 9 software interfaced to a Digidata 1322A 16-bit data acquisition board (Molecular Devices). Signals were sampled at 10 kHz and low pass filtered at 4 kHz. All cells were voltage clamped at −67 mV, the estimated ECl− with the internal solution described above, and corrected for a calculated 13 mV liquid junction potential. All recordings were obtained at room temperature with re-circulated oxygenated solutions (20 mL) at a minimum flow rate of 3.5 mL/min.
Laser-Scanning Photostimulation
LSPS of caged glutamate was performed as described previously (Deleuze and Huguenard 2006; Jin et al. 2006, 2011), unless otherwise noted. After recording spontaneous activity for 2–6 min, high divalent cations (4 mM Ca2+/4 mM Mg2+), 20 μM d-APV (NMDA receptor antagonist), and 100 μM 4-Methoxy-7-nitroindolinyl-caged-l-glutamate (MNI-caged-l-glutamate, Tocris) were added to the re-circulating ACSF. The high divalent cations and APV were used to limit spontaneous epileptiform activity and recurrent polysynaptic excitation (Shepherd et al. 2003; Jin et al. 2006). A frequency-tripled Nd:YVO4 laser (Series 3500 pulsed laser, 100 kHz repetition rate, DPSS Lasers) delivered 100 mW of 355 nm light. The beam was directed through the epifluorescent light path of the microscope, steered precisely in XY space by galvanometer controlled mirrors (model 6210H, Cambridge Technology), and beam expanded 2× to under-fill the back aperture of a 5× Fluar objective (0.25 NA, Zeiss). Beam diameter at the back aperture was approximately 2 mm with a peak power density of ~40 mW/mm2. The optical path through the objective resulted in a Gaussian beam with a theoretical waist width (W0) of ~7.4 μm and a depth of focus of ~245 μm at the focal plane. The Q-switched UV laser provided a 100–300 μs “flash” of uncaging light per stimulus. Stimulus locations were separated by 75 μm, unless otherwise indicated. To prevent glutamate toxicity, local caged-glutamate depletion, and/or receptor desensitization, stimulus locations were visited randomly and without consecutive stimulation in any 1 quadrant (Shepherd et al. 2003). Custom software and hardware developed by John Huguenard and Carl Pisaturo (Deleuze and Huguenard 2006; Jin et al. 2006) was used to direct and trigger the laser during data acquisition. To normalize uncaging stimuli between cells, prior to mapping experiments, glutamate was uncaged directly onto the soma of the recorded cell with a small 5 × 5 grid (50 μm spacing) and the laser duration was adjusted so that the maximal peak current for direct evoked (nonsynaptic) events was ~200 pA for each cell.
Event Detection
Several measures were used to standardize experimental conditions and effects of LSPS across groups. Direct activation profiles ensured that each experiment was conducted with roughly the same uncaging stimulus. The direct activation maps also demonstrated that the area of direct activation was similar between groups, arguing against dendritic sprouting or other intrinsic mechanisms that could alter the spatial resolution of LSPS between experimental groups. Measurements of passive properties also did not show any correlations with map connectivity measurements. Additionally, a Matlab-based analysis routine was used to batch-process the data with equal settings and analysis parameters, with the experimenter blinded to the treatment condition, ensuring that all data were treated equally. Efforts were made to reduce contamination from spontaneous events; maps were made by averaging across trials only from the locations that showed a positive response in more than one map, High divalent cations and a low concentration of APV were added to the bath to suppress polysynaptic activity, and any occasional sEPSCs that occurred before the laser stimulus were subtracted from evoked events.
Connectivity Maps
For analyzing connectivity within and between groups, all data were batch-processed with Matlab (source code available upon request) using identical map creation protocols, thus all data were treated equally. For each mapping experiment, the current amplitudes of direct and synaptic events were first arranged as heat maps based on XY coordinates. Each LSPS trial consisted of identical parameters (laser intensity, grid spacing, etc.) and used a different randomly generated sampling order. A single connectivity map from a neuron was obtained by averaging 3–5 mapping trials. For any given stimulus location, averaging occurred if an event was detected in more than 1 map; each “hot spot” in a connectivity map, therefore, represents evoked activity that occurred in 2 or more trials (see Supplementary Fig. S1A). Connectivity maps with less than 3 hot spots (which could reflect poor slice health) were excluded from further analysis.
Measures of Connectivity
A modified Sholl analysis was used to compare the intensity and prevalence of synaptic inputs between different groups (Jin et al. 2006). For each connectivity map, the Euclidean distances of all photostimulation sites (i.e., “grid spots”) from the soma were calculated and grouped into 100 μm bins, and the number of grid spots in concentric 100 μm rings centered on the soma was recorded (see Fig. 2C, Supplementary Fig. S2B). The amplitudes at each hot spot and directly evoked events were also grouped into 100 μm bins. For each bin, the number of hot spots evoked and the sum of cumulative EPSC amplitudes (or direct-evoked amplitudes) were normalized to the number of grid spots (per bin), giving region-normalized hot spot ratios and region-normalized cumulative EPSC amplitudes, respectively (see Fig. 2D, Supplementary Fig. S2C). For each connectivity map, the row and column means were also calculated to measure the strength of laminar and columnar connectivity, respectively. Significance for Sholl and columnar/laminar analyses were tested by 2-way ANOVA with a Bonferroni post-test.
Averaging Connectivity Maps
To visualize overall connectivity within a given group, connectivity maps (some rotated, see below) were registered to one another with respect to cell location and pial orientation. These maps were interpolated onto an “ideal map” and subsequently averaged to make a composite map (see Supplementary Fig. S1B). The composite map dimensions were chosen to encompass as much of the sampled region from each connectivity map as possible, while ensuring that each composite map location was sampled by all connectivity maps.
Map Rotation
in matlab:
rotAngle = deg2rad(rotation_angle);
xprime = x*cos(rotAngle) – y*sin(rotAngle);
yprime = x*sin(rotAngle) + y*cos(rotAngle).
Excitation Profiles
To map excitation profiles, layer V pyramidal neurons were recorded in loose-seal cell-attached mode during LSPS (50–75 μm spot separation). Laser duration was set at 200 μs and the analysis window was restricted to 100 ms poststimulus. A local maxima/minima peak detection routine (peakdet.m, ©Eli Billauer, http://billauer.co.il/peakdet.html) was used to identify spikes. Spike location, number of spikes, and spike latencies were measured for each trace and displayed as heat maps or histograms (source code available upon request). Frequency distributions of the number of spikes evoked per stimulus and the latency to the first spike following LSPS were also calculated from these data. A modified Sholl analysis was used to calculate the ratio of the number of spikes evoked per number of spots sampled within concentric 50 μm rings centered on the soma.
LSPS-Induced Epileptiform Activity
To analyze LSPS-induced epileptiform (i.e., bursting) activity, event detection was performed on an extended analysis window 500 ms after laser stimulation (Supplementary Fig. S5). Bursts were identified as 5 or more consecutive synaptic events with interevent intervals less than 75 ms between each event. The locations and cumulative amplitudes in the fraction of slices in which these epileptiform events occurred were summarized in heat maps using the image registration algorithms described above.
Spontaneous Burst Event Detection
A minimum of 2 min of spontaneous gap-free recordings were made in normal ACSF prior to modifying the ACSF for LSPS (addition of MNI-glutamate, high divalent cations, and APV). Spontaneous epileptiform bursts were identified as 10 or more consecutive EPSCs with interevent intervals less than 75 ms between each event (a different criterion from LSPS burst detection was necessary to account for a higher degree of spontaneous activity). Significance between groups was tested with Kruskal–Wallis 1-way ANOVA with Dunn's Multiple Comparison Test or Chi-squared test.
Results
We have found that excitatory circuits are reorganized as early as 3 days after UC injury (Takahashi et al. 2016). Therefore, we performed UCs in 21-day old (P21) rats and used LSPS to map excitatory circuits at both 3 days and 14 days after UC in order to determine the effects of early GBP treatment. The 14-day time point was chosen to coincide with that used in recent experiments with GBP in this model (Li et al. 2012). Previously employed metrics for circuit analysis were used (Jin et al. 2006, see Materials and Methods section and Supplementary Fig. S1). Modified Sholl analyses were used to determine (1) the “region-normalized cumulative excitatory postsynaptic current (EPSC) amplitudes”, which represent the relative strength of connectivity onto the recorded cell, and (2) “region-normalized hot spot ratios”, which represent the relative number of connections from presynaptic neurons terminating on the recorded cell. Simply stated, the first terminology measures the overall strength of connections that originate from each Sholl region, while the second is a measurement of the number of “hot spots” (i.e., connections) originating within each Sholl region. Connectivity maps were collapsed in the x- or y-dimension to assess the columnar or laminar profile of cortical connectivity, respectively.
Effects of GBP Treatment 3 Days Postlesion
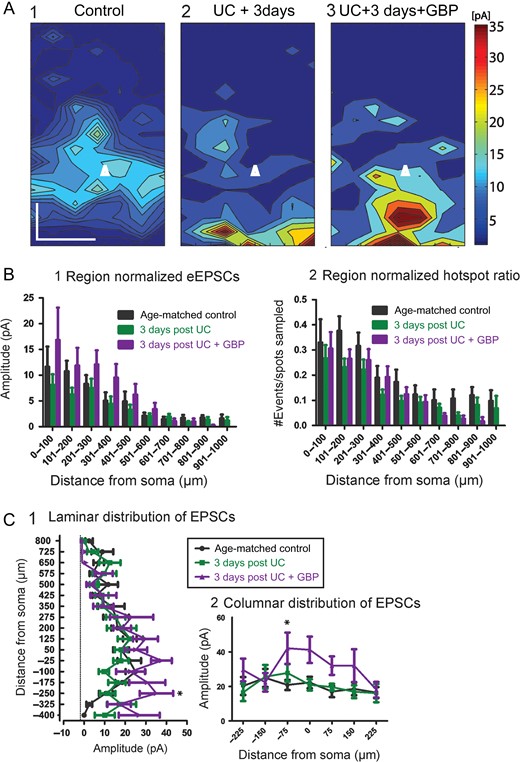
We first made measurements to compare excitatory connectivity in cortical slices at P24, 3 days after the UC lesion. The following groups of male rats were used: age-matched naïve (n = 16 cells/5 animals); UC (n = 20 cells/8 animals); and UC treated with GBP (n = 15 cells/5 animals). Composite maps (Fig. 1A) from each group were obtained by averaging multiple maps across the z-dimension. These maps represent the overall pattern of connectivity, and when compared showed differences between groups that were reflected in the laminar and columnar plots (Fig. 1A,C). Modified Sholl analyses for region-normalized cumulative EPSC amplitude revealed a small but significant difference between groups for treatment condition (Fig. 1B1, F = 4.77, P = 0.0089), however a post-test comparison did not reveal significant differences between Sholl regions. Hot spot ratios, defined as the numbers of locations from which laser stimuli evoked responses in the recorded cell divided by the number of spots sampled, were also calculated (see Materials and Methods section). Although this measure showed a significant effect between groups (Fig. 1B2, F = 8.07, P = 0.004), a post-test comparison again did not show significant differences in Sholl regions. A laminar analysis showed a significant effect between groups with GBP treatment (Fig. 1C1, F = 6.85, P = 0.001) and a post-test comparison showed significantly larger EPSC amplitudes from GBP-treated animals compared to both saline-treated and age-matched controls at a distance −250 μm below the soma (P < 0.05). Similarly, a columnar analysis (Fig. 1C2) showed significant differences between groups for treatment condition (F = 9.1, P = 0.0001) with the largest difference occurring between the GBP treated and control group at a location −75 μm below the soma (toward layer VI) (P < 0.05). Therefore, unexpectedly, laminar analysis indicated that, compared to controls and UC animals, “increased” excitatory connectivity was present in the 3-day GBP-treated group.
Cumulative amplitude maps 3 days after UC. (A) Composite maps of cumulative EPSCs evoked by LSPS. Pia oriented up, and cell location in layer Va represented by white triangle. Composite maps were made by averaging connectivity maps from all cells within a group with respect to laminar orientation and cell location. An increase in the evoked amplitude is seen most prominently in the UC group treated with GBP (A3) versus control (A1) and 3 days postUC (A2). Scale bar, 200 × 200 μm. (B) Modified Sholl analyses of region-normalized EPSC amplitudes (B1) and region-normalized hot spot ratios (B2). Normalized EPSC amplitude reflects the strength of connections within each Sholl region, normalized to the number of grid locations sampled. The hot spot ratio is the number of hot spots divided by the number of grid locations sampled per Sholl region. The Sholl analyses were similar overall between groups, with the GBP-treated group trending towards larger amplitudes, (C) Laminar (C1) and columnar (C2) distributions show significantly larger cumulative EPSCs from GBP-treated group (*P < 0.05).
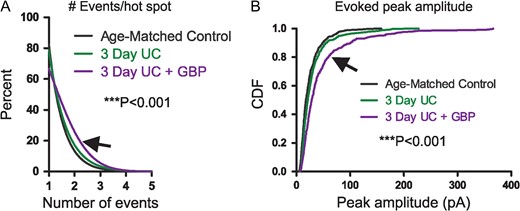
To explain these results, we examined the components that make up the connectivity maps. Sholl and laminar/columnar analyses are dependent on cumulative EPSC amplitudes, which in turn are the sum of detected EPSCs occurring within a narrow analysis time window (see Materials and Methods section). Therefore, both the number and amplitude of EPSCs can influence the calculation of connectivity maps. To further delineate the source of apparent increased connectivity, we first analyzed the number of detected events that were evoked per hot spot in each group (Fig. 2A). The majority (~80%) of cumulative EPSC hot spots in control and 3-day UC slices were composed of single events and no significant differences were found between the 2 groups. However, in the 3-day UC GBP-treated group (arrow in Fig. 2A), there was a significant increase in the number of events evoked per uncaging stimuli compared to the other groups, which may have led to a larger cumulative EPSC amplitude (control: 1.23 ± 0.02, UC untreated: 1.26 ± 0.02, GBP treated: 1.44 ± 0.03 events, P < 0.001 for both comparisons, Kruskal–Wallis 1-way ANOVA with Dunn's multiple comparison test). An increase in the average peak amplitude of evoked EPSCs could also result in larger cumulative EPSC amplitudes and, therefore, influence Sholl and laminar/columnar analyses. We, therefore, analyzed the peak amplitude of the single largest event evoked per stimulus and compared this parameter between groups (Fig. 2B). Cumulative distributions of the evoked peak amplitude showed that the largest evoked events occurred in the GBP-treated group (arrow in Fig. 2B) compared to both control and untreated UC group (Fig. 2B, P < 0.001 for both comparisons, Kruskal–Wallis 1-way ANOVA with Dunn's multiple comparison test). Therefore, these 2 analyses indicated that both the number of EPSCs initiated per uncaging stimulus, and the amplitude of the evoked EPSCs were larger in the GBP-treated group 3 days after the injury.
LSPS event distribution. (A) Cumulative distributions show significantly more events evoked per hot spot from 3-day UC group treated with GBP (arrow) compared to both control and 3-day UC groups (***P < 0.001). (B) Cumulative distribution of evoked amplitudes. Significantly larger events were evoked in cells from the GBP-treated group (arrow) compared to both controls and UC groups (***P < 0.001).
These differences were present despite similar LSPS conditions across groups, as evidenced by direct response profiles (treatment effect on direct amplitude: F = 2.92, P = 0.06, treatment effect on direct response ratio: F = 1.94, P = 0.15, Supplementary Fig. S2). Additionally, there were no significant differences in the passive properties of the recorded cells (Table 1) and there was no correlation between passive properties and overall connectivity between groups (Supplementary Fig. S3). The data suggest that 3 days of GBP treatment may have led to a change in the output of presynaptic neurons connected to layer V, resulting in larger and/or more frequent uncaging-evoked EPSCs per laser stimulus. The mechanisms for these effects may relate to neuroprotective actions of GBP (e.g., Li et al. 2012; Rossi et al. 2013), but were not investigated further in the current experiments.
Three day postinjury group
| 3-day control | 3-day UC | 3-day UC + GBP | |
|---|---|---|---|
| Number of cells (n) | 16 | 20 | 15 |
| Access resistance (MΩ) | 14 ± 1.2 | 15.9 ± 1.1 ns | 15.6 ± 1.1 ns |
| Input resistance (MΩ) | 158.6 ± 23.2 | 134.6 ± 18.5 ns | 170.4 ± 28.4 ns |
| 3-day control | 3-day UC | 3-day UC + GBP | |
|---|---|---|---|
| Number of cells (n) | 16 | 20 | 15 |
| Access resistance (MΩ) | 14 ± 1.2 | 15.9 ± 1.1 ns | 15.6 ± 1.1 ns |
| Input resistance (MΩ) | 158.6 ± 23.2 | 134.6 ± 18.5 ns | 170.4 ± 28.4 ns |
Effects of Early GBP Treatment Assessed 14-Day PostLesion
Several lines of evidence suggest that UC lesions increase recurrent excitatory connectivity and promote epileptiform activity in layer V about 2 weeks after lesion (Prince and Tseng 1993; Hoffman et al. 1994; Salin et al. 1995; Jin et al. 2006). Therefore, 2 weeks after UC lesion, we assessed the effect of early GBP treatment on excitatory connectivity in cortical slices using analysis parameters identical to those employed 3 days postUC. We compared the following groups of P35 rats: age-matched controls (n = 15 cells/4 rats); 14 days postUC (n = 19 cells/4 rats); and 14 days postUC, treated with GBP for only the first 3 days beginning on the day of lesion (n = 19 cells/5 animals).
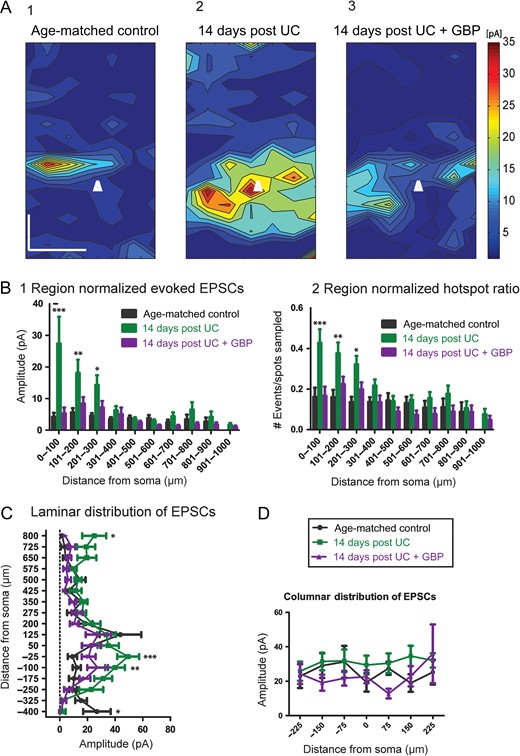
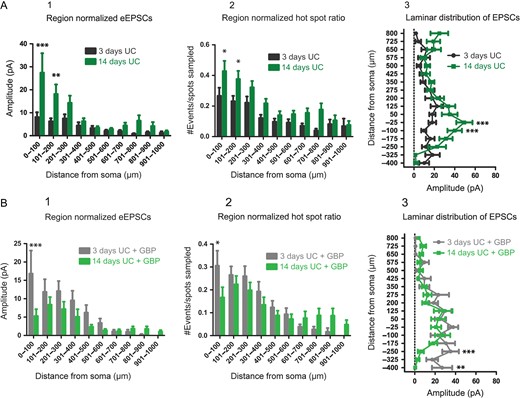
Consistent with previous results (Salin et al. 1995; Jin et al. 2006), LSPS maps showed a significant increase in excitatory connectivity within layer V of UC animals compared to controls (Fig. 3A1,2). Significant differences existed between groups (F = 19.1, P < 0.0001), that were most evident from Sholl regions close to the soma for region-normalized cumulative EPSC amplitude (Fig. 3B1; P < 0.001 for region 0–100 μm, P < 0.01 for region 101–200 μm, and P < 0.05 for region 201–300 μm) and hot spot ratios (Fig. 3B2; P < 0.001 for region 0–100 μm, P < 0.01 for region 101–200 μm, and P < 0.05 for region 201–300 μm). Significant increases in amplitude were also found in the laminar distribution of EPSCs from UC animals compared to controls, with the largest difference within layer V at −25 μm (P < 0.001) and −100 μm (P < 0.01) below the soma, toward deeper layers (Fig. 3C).
Cumulative amplitude maps 14 days after UC. (A1) Composite maps of cumulative EPSCs evoked by LSPS from 15 control Pyr neurons. Pia oriented up, and cell location in layer Va represented by white triangle. Scale bar in A1 for A1-3:200 × 200 μm. (A2) An increase in the evoked cumulative amplitude is seen most prominently in the saline-treated UC group (n = 19). (A3) Composite map from 19 neurons 14 days after UC from rats treated with GBP for 3 days, beginning on day of UC. (B) Modified Sholl analyses showing that region-normalized EPSC amplitudes (B1) and hot spot ratios (B2) were greater in Sholl regions 0–100, 101–200, and 201–300 from saline-treated UC animals (green bars) versus control (black bars) and 14 days GBP (purple bars). Asterisks: ***P < 0.001, **P < 0.01, *P < 0.05 here and in Figures below. (C) Laminar distributions also show significantly larger cumulative EPSCs from saline-treated UC group (green) compared to both UC + GBP (purple) and age-matched controls (black) at sites deep to somata. (D) No significant differences in columnar distribution of EPSCs among the 3 groups.
In comparison to saline-treated UC animals, slices from GBP-treated UC rats had a significant reduction in connectivity 14 days after UC (Fig. 3A3) for both region-normalized EPSCs (Fig. 3B1) and hot spot ratios (Fig. 3B2). In fact, there were no significant differences in these measurements between age-matched controls and UC animals treated with GBP (cf. purple and black bars in Fig. 3B). As seen in Sholl analyses, GBP treatment shifted the distribution of EPSC amplitudes to a pattern more similar to age-matched controls (Fig. 3C). Therefore, early GBP treatment significantly reduced both the strength and number of connections to layer V 14 days after lesion, compared to nontreated UC animals. Columnar distributions showed no significant difference among any of the groups (Fig. 3D).
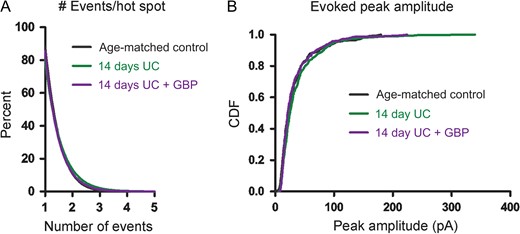
Similar to the data analysis performed above, we examined both the amplitude and frequency of uncaging-evoked EPSCs to determine how these parameters contributed to the connectivity maps at 14 days. Analyses of the number of events that were evoked per hot spot showed very similar profiles among the different 14-day postlesion groups, with the majority (~80%) of cumulative EPSC hot spots composed of single peak events. There were no significant differences in the cumulative probability plots for number of events evoked per hot spot or in the distributions of the single largest peak amplitude per hot spot among the 3 groups (Fig. 4B).
Event distribution 14 days after UC. (A) Cumulative distributions plot the percent of uncaging spots versus number of EPSCs evoked/hot spot and show similar numbers of evoked events per hot spot between groups. (B) Cumulative distribution functions (CDFs) of evoked EPSC peak amplitudes show no significant differences between groups.
In agreement with data obtained at the 3-day time point, all groups at 14 days had very similar direct response profiles (treatment effect on direct amplitude: F = 0.44, P = 0.65, treatment effect on direct response ratio: F = 16.38, P < 0.0001, Supplementary Fig. S4). There was also no significant difference in access resistance (Table 2), and no correlation between passive properties and connectivity among groups (Supplementary Fig. S3). However, both UC groups had higher input resistances compared to age-matched controls (Table 2), consistent with previous observations made in this model (Tseng and Prince 1996; Jin et al. 2005) and in cortical isolations of cats in vivo (Avramescu and Timofeev 2008). These data confirm that increased connectivity in layer V 14 days after UC is due to a robust and layer-specific increase in the recurrent excitatory connections within layer V, consistent with previous results (Salin et al. 1995; Jin et al. 2006). Furthermore, our results indicate that GBP treatment, limited to the first 3 days after injury, has profound effects on the later functional connectivity of the circuit, as suggested by results of Li et al. (2012).
Fourteen day postinjury group
| 14-day control | 14-day UC | 14-day UC + GBP | |
|---|---|---|---|
| Number of cells (n) | 15 | 19 | 19 |
| Access resistance (MΩ) | 8 ± 0.6 | 9.9 ± 1.2 ns | 13.7 ± 1.2 ns |
| Input resistance (MΩ) | 70.1 ± 13.6 | 111.8 ± 20.3* | 175.1 ± 23.9* |
| 14-day control | 14-day UC | 14-day UC + GBP | |
|---|---|---|---|
| Number of cells (n) | 15 | 19 | 19 |
| Access resistance (MΩ) | 8 ± 0.6 | 9.9 ± 1.2 ns | 13.7 ± 1.2 ns |
| Input resistance (MΩ) | 70.1 ± 13.6 | 111.8 ± 20.3* | 175.1 ± 23.9* |
All values expressed as means ± SEM. *P < 0.05; ns, not significant versus control.
Comparison of Connectivity at 2 Time Points
In order to assess the effects of GBP on the time course for development of connectivity, we compared UC animals (Figs. 1 and 3) with and without GBP at the 2 time points after injury. Results showed that without GBP, cumulative EPSC amplitudes increased with time after injury (F = 22.6, P < 0.0001), with significant differences in the 0–100 μm (P < 0.001) and 101–200 μm (P < 0.01) Sholl regions (Fig. 5A1). Hot spot ratios also increased with time after injury (F = 27.96, P < 0.0001), with significant differences in the 0–100 μm (P < 0.05) and 101–200 μm (P < 0.05) Sholl regions (Fig. 5A2). Laminar distributions of the data also showed larger amplitude cumulative EPSCs evoked at locations −25 μm (P < 0.001) and −100 μm (P < 0.001) below the soma in the 14-day compared to the 3-day UC group (Fig. 5A3). These data suggest that recurrent excitatory connectivity after UC increases significantly between 3 and 14 days after injury.
Comparison of connectivity over time. (A) Region-normalized EPSC amplitude (A1), hot spot ratio (A2), and laminar analyses (A3) comparing connectivity at 3 days after UC (black) and 14 days after UC (green). Overall, excitatory connectivity increases in layer V (0–300 μm) over this time period. (B) Similar analyses comparing evoked EPSCs (B1), hot spot ratios (B2) and laminar distribution of EPSC amplitude (B3) for GBP-treated UC rats 3 days (gray) and 14 days (green) after UC. Overall, connectivity is decreased at 14 days versus 3 days after UC by GBP treatment.
As shown in Figure 5B, GBP treatment had significant effects that evolved between 3 and 14 days after UC (Fig. 5B, F = 8.91, P = 0.003). Evoked EPSCs (Fig. 5B1; P < 0.001) and hot spot ratios (Fig. 5B2; P < 0.05) were significantly decreased in the 0–100 μm Sholl region for the 14-day UC GBP group compared to the 3-day UC GBP group. Laminar distributions of the data (Fig. 5B3) showed smaller cumulative EPSCs evoked in the 14-day UC + GBP group compared to the 3-day UC + GBP group at locations −250 μm (P < 0.001) and −400 μm (P < 0.01) below the soma. These data show that early GBP treatment prevents injury-induced recurrent excitatory connectivity in this model.
Uncaging-Evoked Epileptiform Bursts
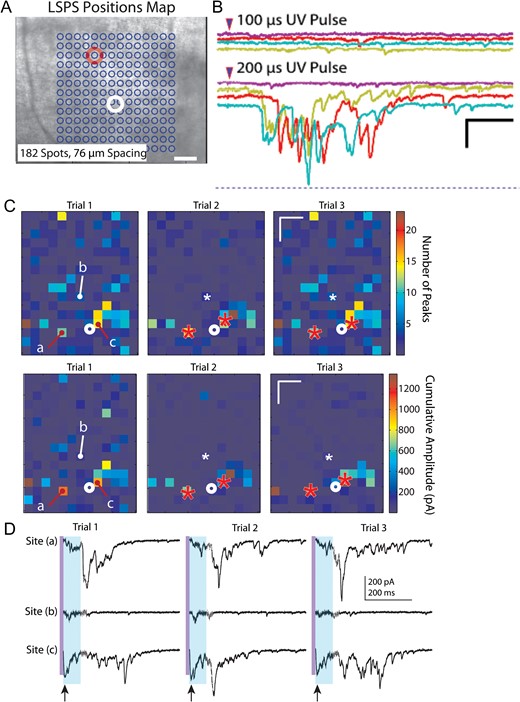
While recording from layer V pyramidal neurons in slices from UC animals, we noticed that a single laser stimulation at a single location (e.g., Fig. 6A) occasionally evoked all-or-none epileptiform bursts. These bursts consisted of multiple EPSCs of variable amplitude, latency, and duration that were triggered at threshold when laser pulse duration was varied (Fig. 6B). Repeated uncaging of glutamate at some single locations distributed throughout the uncaging map would reliably evoke epileptiform bursts with each uncaging stimulus (Fig. 6C). Such polysynaptic evoked events were unexpected, as the ACSF in LSPS experiments contained normal 2.5 mM [K+], high divalent cations and a low concentration of APV (20 μm), all included to reduce recurrent excitation and spontaneous or evoked hyperexcitability.
LSPS-evoked bursts. (A) Representative LSPS experiment in which bursts were evoked in a layer V pyramidal neuron (white circle) by uncaging at one location (red circle). (B) Evoked LSPS bursts from experiment of A. Bursts were multiphasic, long in duration, evoked all-or-none at threshold when laser stimulus duration was varied, occurred at variable long latencies following laser stimulation, and without any direct uncaging response or short latency evoked EPSC in the recorded neuron. These features indicate that, in this case, the laser stimulus activated a polysynaptic network whose synaptic output took >100 ms to reach the recorded neuron. Calibration: 200 pA, 200 ms. (C) Example of 3 LSPS trials in which epileptiform events were evoked from identical locations marked by “a” and “c” in Trial 1 and red asterisks in Trials 2 and 3. Top row: heat maps of the number of EPSC peaks, Bottom row: heat maps of cumulative amplitudes. White asterisks in Trials 2 and 3 and “b” in Trial 1: location where stimulation did not evoke a burst. Note the larger number of peaks and cumulative amplitudes in the heat map from locations of burst activity compared to other hot spots that did not show burst activity. Calibration in Trial 3 maps: 200 μm. (D) Raw traces corresponding to responses from locations “a,” “b,” and “c” in heat maps of C. Stimulation at sites “a” and “c,” but not site “b”, evoked epileptiform activity across trials. Purple vertical line: time of uncaging stimulus; light blue shading: 75 ms time window in which analysis would miss the long latency epileptiform event. Arrows below traces of Site (c), bottom line, point to direct responses, followed in each trial by a small amplitude putative monosynaptic response. Long variable latency burst discharges evoked in each Trial from sites “a” and “c,” but not site “b”. Calibration: 200 pA, 200 ms for all sweeps.
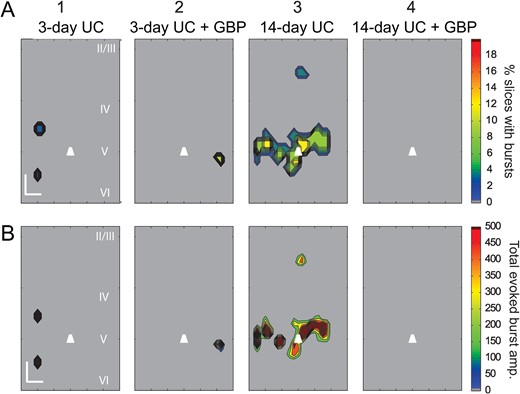
To determine the prevalence of these events and the locations from which they were evoked, we reanalyzed all of the data with an extended analysis window of 500 ms to detect prolonged, high frequency and large amplitude events (see Supplementary Fig. S5 and Methods). Consistent with our single trial observations, during the course of recording from a single cell, bursts were evoked from the same location across multiple trials (Fig. 6C). The evoked epileptiform activity was markedly different from the surrounding background activity, occurred with longer latencies than evoked monosynaptic events, and was easily identified with our event detection algorithm (Fig. 6D and Supplementary Fig. S5). Furthermore, the bursts could be repeatedly evoked by stimulating the same location across trials that were separated in time by several minutes, that is, they did not appear to be occurring at random. Composite maps showing the percentage of slices with evoked epileptiform activity and their respective cumulative burst amplitudes revealed that evoked bursts occurred most frequently in the slices from saline-treated 14-day UC group (6 out of 23 cells from 6 UC animals), and except in 1 instance, epileptiform activity was evoked exclusively from uncaging in layer V (Fig. 7A3,B3 14-day UC). Similar burst activity was also evoked in slices from saline-treated animals 3 days after UC (2 out of 30 cells from 8 animals) and GBP-treated animals 3 days after UC (1 out of 19 cells from 5 animals). LSPS-evoked epileptiform activity was not detected in slices from the GBP-treated 14-day UC group (Fig. 7A4,B4, 14-day UC + GBP) or in un-lesioned control animals.
Composite LSPS-evoked Burst Maps. (A) Composite burst maps showing the percentage of slices with LSPS-evoked bursts in layer V Pyr neurons 3 and 14 days after UC, in animals treated with saline (A1, 3) or GBP (A2,4) (n = 20 slices from eight 3-day UC animals; n = 15 slices from five 3-day UC + GBP animals; n = 19 slices from four 14-day UC animals; n = 19 slices from five 14-day UC + GBP animals). Note that the largest proportion of bursts were evoked within layer V from saline-treated 14-day UC animals (A3, B3), and no bursts were evoked in 14-day UC animals treated with GBP (A4, B4). (B) Composite maps showing the average cumulative EPSC amplitudes of evoked burst activity (same data set as in A). Calibration in B1:200 μm. EPSC amplitude (right heat bar) in pA.
Spontaneous EPSCs
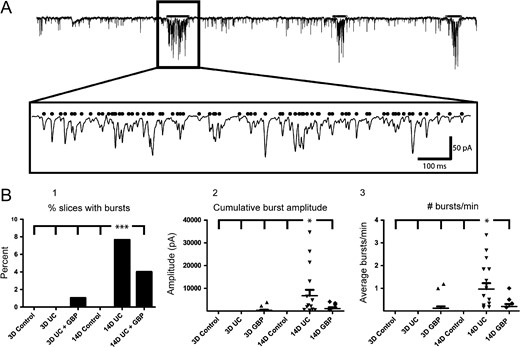
Prior to each LSPS experiment, gap-free recordings were routinely obtained in normal ACSF before addition of high divalent cations, APV, and 8MNI-glutamate. Spontaneous epileptiform bursts were routinely observed during these recordings in slices from UC animals (Fig. 8A). We found a significant increase in the number of slices with epileptiform bursts from the saline-treated 14-day UC group (Fig. 8B1, P < 0.001, comparing 14-day UC vs. all other groups, χ2-test). Similarly, the cumulative amplitude of each burst (Fig. 8B2) and the number of bursts that occurred per minute (Fig. 8B3), were both significantly higher in the saline-treated 14-day UC group compared to all other groups (P < 0.05 for both comparisons). As in the case of the LSPS-evoked epileptiform events, the incidence of spontaneous epileptiform events increased between 3 days and 14 days following UC, and was decreased at the 14-day time point with GBP treatment (Fig. 8B1). These data provide additional evidence for the protective anti-epileptogenic effects of early GBP treatment following injury.
Spontaneous epileptiform bursts. (A) Example of automated burst detection. A1: Superimposed raw and filtered traces containing 3 prolonged epileptiform bursts. A2: First burst marked by black line in box of A1 expanded ~20× in A2 showing the detected EPSCs (black dots). Calibration in A2:100 ms for A2. (B) Quantification of the percentage of bursting slices (B1), cumulative amplitude per burst (B2), and the number of bursts that occurred per minute (B3). ***P < 0.001, *P < 0.05 (n = 16 cells from 5 naïve P24 animals, n = 20 cells from eight 3-day UC animals, n = 15 cells from five 3-day UC + GBP animals, n = 15 cells from 4 P35 naïve animals, n = 19 cells from 4 14-day UC animals, n = 19 cells from 5 14-day UC + GBP animals).
Discussion
In this study, LSPS was used to determine if GBP suppresses 2 well-characterized abnormalities that occur after neocortical injury in the UC model: increased recurrent excitatory connectivity and in vitro epileptiform activity. LSPS is a powerful technique for mapping neuronal connectivity in cortical and subcortical structures (Dantzker and Callaway 2000; Schubert et al. 2001, 2006; Shepherd and Svoboda 2005; Deleuze and Huguenard 2006; Weiler et al. 2008; Yu et al. 2008; Brill and Huguenard 2009), plasticity during development (Shepherd et al. 2003; Bureau et al. 2004), and for assessing epileptogenic and other pathophysiological circuitry (Shao and Dudek 2004, 2005; Jin et al. 2006, 2011, 2014; Kumar et al. 2007; Bureau et al. 2008; Chu et al. 2010). LSPS has several advantages over paired recordings and electrical stimulation. Focal glutamate uncaging at or near somata initiates action potentials in small groups of presynaptic neurons. In contrast to electrical or optogenetic stimulation, action potentials are not initiated by axons or dendrites following glutamate photolysis (see Supplementary Fig. S1 and also Shepherd et al. 2003; Jin et al. 2006). LSPS efficiently maps synaptic connections in a relatively large area by scanning hundreds of locations with high resolution.
The principal findings from this study are that excitatory connectivity is reorganized between 3 and 14 days following UC neocortical injury and that acute short-term GBP treatment for just 3 days, beginning on the day of injury, prevents aberrant excitatory circuit formation and subsequent in vitro epileptiform activity as assessed 14 days later. The results underscore the utility of this model for studying the molecular and functional mechanisms of injury-induced changes in excitatory circuits (Salin et al. 1995; Jin et al. 2006, 2011) and provide additional evidence that GBP can suppress potential epileptogenic injury-induced alterations in excitatory circuits (Li et al. 2012).
Progressive Changes in Excitatory Connectivity and Epileptiform Activity
Complex time-dependent progression of epileptiform activity has been observed in both in vivo (Avramescu and Timofeev 2008; Williams et al. 2009) and in vitro models of PTE (Berdichevsky et al. 2011; Lillis et al. 2015); reviewed in (Dudek and Staley 2012). Tracking epileptogenesis in human PTE is difficult, given the variability in degrees of injury and latent periods, possible differences in individual susceptibility to postlesional seizures, and the invasive nature of chronic monitoring. Understanding the precise mechanisms of epileptogenesis in animal models is crucial for developing strategies aimed at preventing PTE. Interfering with these mechanisms could provide clues on how to halt the epileptogenic process in humans (Dudek and Staley 2011; Prince et al. 2012). Our results show a significant increase in recurrent excitatory connectivity in saline-treated UC animals between 3 and 14 days after injury that coincided with an increase in the frequency of both spontaneous and LSPS-evoked epileptiform activity. Further, this dynamic epileptogenic process can be modified with acute, transient GBP treatment initiated following the injury. These results raise a number of important questions that should be addressed in future experiments, including the duration of the effect of brief GBP treatment, and whether a delay in treatment after injury would decrease the GBP prophylaxtic action on excitatory connectivity and epileptogenesis in the injured cortex.
Excitatory Circuitry Early After Injury
Three days after injury, excitatory connectivity in the UC cortex near the recorded neuron in layer V appeared to be decreased (Fig. 1A2 vs. A1). Additionally, columnar analysis showed that the changes deep to the recorded cells (Fig. 1A2) were not significant (Fig. 1C2). This could reflect a loss of neurons that is known to occur in the first 24–72 h after trauma (Rink et al. 1995; Sato et al. 2001; Wang et al. 2008) and continue for at least 7 days in the UC model (Li et al. 2012). The UC lesion also undoubtedly severs or otherwise damages many axons, which could lead to atrophy and alterations in intrinsic properties of surviving pyramidal neurons (Greer et al. 2011). The data are also consistent with pioneering work that showed decreased spontaneous activity in vivo within the first few days after cortical isolation in cats (Sharpless and Halpern 1962). The later observation has also been confirmed more recently by experiments that showed a significant increase in the duration of silent epochs following cortical injury (Nita et al. 2007; Avramescu and Timofeev 2008; Timofeev et al. 2010).
Despite evidence for early decreases in excitatory connectivity in the above reports and in our experiments (Fig. 1), both spontaneous and evoked epileptiform activity was occasionally observed (Figs 6 and 8). This finding is consistent with results of other studies demonstrating that acute changes can induce burst-like paroxysmal activity soon after injury, both in vivo (Sharpless and Halpern 1962; Nilsson et al. 1994; Topolnik et al. 2003a, 2003b; Yang et al. 2010) and in vitro (Yang and Benardo 1997; Yang et al. 2007). Increases in 68 kD neurofilament- and GAP43-IR within the first 3 days after trauma support the conclusion that there is early increased excitatory sprouting in the UC model (Prince et al. 2009; Li et al. 2012; Takahashi et al. 2016). These findings are consistent with injury-induced axonal sprouting observed acutely in other models of central nervous system trauma (Povlishock and Kontos 1985; DeFelipe and Jones 1991; Fishman and Mattu 1993; King et al. 2001; Chuckowree et al. 2004; Greer et al. 2011). Surviving pyramidal neurons may also become hyperexcitable shortly after injury (Greer et al. 2012). Our LSPS experiments, which assess global functional connectivity, did not provide evidence for an early increase in excitatory connectivity (Fig. 1A). Data from 3-day UC animals in this study are consistent with alterations in circuitry manifest by a reduction in synaptic activity, punctuated by brief episodes of paroxysmal discharges.
The “increase” in strength of excitatory connectivity and basal excitatory activity with GBP treatment 3 days after injury, compared to both age-matched controls and saline-treated animals (Fig. 1A3 vs. A2), was unexpected, given the results in the 14 day + GBP group (Fig. 3A,B) and previous results (Li et al. 2012). The number of events evoked per laser stimulus and the average peak amplitude per hot spot were significantly greater 3 days after GBP treatment (Fig. 2), which contributed to the observed enhancement of the connectivity maps. GBP has a relatively short half-life of ~2 h in rats (Vollmer et al. 1986; Radulovic et al. 1995) and experiments were conducted >12 h after the last GBP treatment, so acute effects were most likely not playing a role. Acute effects would also be anticipated to “lower” synaptic activity, as GBP reduces synaptic transmission by blocking the trafficking of VGCCs (see below) and competition with TSPs for binding to α2δ-1 receptors (Eroglu et al. 2009). We speculate that chronic blockade of synaptic activity for 3 days by GBP may have activated homeostatic mechanisms resulting in an increase in the frequency and amplitude of excitatory events upon GBP withdrawal (Turrigiano 2008; Mitra et al. 2011). In humans, acute discontinuation of GBP is associated with various neuropsychiatric symptoms including insomnia, anxiety, and headaches (Norton 2001; Finch et al. 2010; Hellwig et al. 2010), and in 1 case, may have precipitated an episode of SE (Barrueto et al. 2002), suggesting that rebound increases in excitability may be a side-effect of abrupt termination of GBP. An alternative possibility is that the increase in excitability/connectivity at 3 days in GBP-treated rats in our study is due to the neuroprotective effects of GBP in this model (Li et al. 2012; Rossi et al. 2013), resulting in a larger proportion of surviving neurons contributing to excitatory sprouting and activation by LSPS. Although a homeostatic mechanism might be implicated in the enhanced excitability resulting from early increases in quiet periods in the UC model (Houweling et al. 2005), other results show that suppressing activity during a critical 3-day period early after the UC results in a reduction, rather than enhancement of epileptiform activity, weeks later (Graber and Prince 1999, 2004). Potential mechanisms for differences in effects of deafferentation will require additional experiments, but could involve variables such as animal age, species, and cortical site examined (Galvan et al. 2003; Graber and Prince 2004).
Excitatory Connectivity 2 Weeks After Injury
In slices from saline-treated UC rats 14 days after injury, there was a dramatic enhancement of recurrent excitatory connectivity within layer V, consistent with previous results (Jin et al. 2006). The enhancement was seen in both Sholl and laminar analyses and occurred without an increase in the peak amplitude or number of evoked EPSCs. The results suggest an increase in recurrent excitatory connectivity specifically in layer V, consistent with previous anatomical analysis of axonal sprouting in this model (Salin et al. 1995).
The enhancement in layer V connectivity coincided with layer V-specific initiation of LSPS-evoked epileptiform activity. The LSPS-evoked epileptiform bursts were repeatedly initiated from uncaging glutamate at specific locations and persisted across multiple mapping trials with the same cell. The results suggest an uneven density of new recurrent excitatory circuits, or local reductions in GABAergic inhibition, leading to activation of a subset of neurons that triggered a network tuned for generating epileptiform activity. In some cases, the evoked epileptiform burst occurred with a latency of several hundred milliseconds, as previously reported for bursts evoked by electrical stimulation (Hoffman et al. 1994; Salin et al. 1995), and consistent with sequential activation in a polysynaptic excitatory network. The extent to which the slicing procedure itself contributed to this apparent focal nature of the burst-generating network is unknown, however, similar long and shifting latencies between stimulus and evoked epileptiform bursts were also found in vivo in the acute penicillin model of focal epileptogenesis in naïve cortex and in chronic neocortical isolations (Prince 1965; Prince and Gutnick 1971). The apparent increased burst generation in layer V is also consistent with an earlier study showing that epileptiform activity could be evoked in disinhibited slices by focal L-glutamate microdrop application specifically in layer IV/upper layer V (Connors 1984) and earlier results obtained with recordings from multiple laminae in UC slices (Prince and Tseng 1993; Hoffman et al. 1994).
Spontaneous epileptiform bursts were significantly more frequent in the saline-treated 14-day UC group compared to all other groups examined. Comparison of excitatory connectivity between the 3-day UC and 14-day UC groups showed that there was an increase in layer V connectivity between these 2 time points that was reflected in the incidence of evoked epileptiform activity and the frequency of spontaneous epileptiform bursts. The observed changes argue for excitatory circuitry abnormalities as a mechanism for seizure generation in this model, as in animal models of hippocampal SE- and kindling-induced epilepsies and human epileptogenic temporal lobes (Tauck and Nadler 1985; Babb et al. 1991; McKinney et al. 1997; Avoli et al. 2005).
GBP decreases excitatory synapse formation both during development in vivo (Eroglu et al. 2009) and after UC injury (Li et al. 2012) by binding to the α2δ-1 receptor for astrocyte-secreted TSPs (Eroglu et al. 2009). We found that brief GBP treatment reduced recurrent excitatory connectivity in the UC cortex 14 days after injury to levels indistinguishable from those in naïve age-matched control animals, without a significant change in the overall number of events evoked per hot spot or a reduction in mean peak amplitude. Remarkably, LSPS did not evoke any epileptiform bursts in the GBP-treated slices. Furthermore, spontaneous epileptiform bursts, although present 14 days after UC, were significantly less frequent and had significantly smaller cumulative amplitudes with GBP treatment compared to saline-treated littermates (Fig. 8B). The most parsimonious explanation for these results is that GBP prevented the layer-specific formation of recurrent excitatory circuits after injury resulting in decreased epileptiform activity. Other pathologies such as reduced inhibition (Li and Prince 2002; Faria and Prince 2010; Faria et al. 2012; Ma and Prince 2012) may still be present and contribute to hyperexcitability. Previous studies showed that blockade of synaptic activity with tetrodotoxin during a 3-day critical period after injury also reduced epileptogenic burst generation in the UC model (Graber and Prince 1999, 2004). In future experiments it will be important to determine whether GBP treatment would be effective if delayed beyond this critical period, and whether effects to decrease aberrant excitatory connectivity persist beyond 2 weeks.
Gabapentinoids (GBP and pregabalin) may decrease functional excitatory synaptic connectivity and epileptiform activity in the UC model through several mechanisms. GBP binds with high affinity to α2δ-1 auxiliary subunits of L-type VGCC (Gee et al. 1996; Dooley et al. 2007; Li et al. 2011; Dolphin 2012) and is primarily expressed in presynaptic terminals of excitatory cells (Cole et al. 2005), where it may have acute effects on transmitter release (van Hooft et al. 2002; Cunningham et al. 2004; Brown and Randall 2005; Dooley et al. 2007; Micheva and Smith 2007; Taylor et al. 2007). The α2δ proteins are thought to be involved in calcium channel trafficking, and chronic GBP administration in cultures interferes with α2δ and reduces the surface expression and current density of calcium channels, associated with a reduction in synaptic activity (Hendrich et al. 2008; Tran-Van-Minh and Dolphin 2010; Hoppa et al. 2012). Recent results have shown that GBP, α2δ-1, and TSPs interact through the synaptogenic part of the TSP molecule and this interaction does not depend on the presence of other calcium channel subunits (Eroglu et al. 2009). The effects on synapse formation after injury would likely be the principle mechanism by which GBP would affect post-traumatic epileptogenesis (Dolphin 2012; Li et al. 2012). α2δ-1 is upregulated, along with TSPs, in the UC model of neocortical trauma, and these alterations are decreased by brief GBP treatment after injury. Results are somewhat analogous to those in spinal nerve injury models of neuropathic pain where the anti-allodynic effect of GBP is dependent on its binding to α2δ-1 (Luo et al. 2001, 2002; Field et al. 2006; Bauer et al. 2009). Potential actions of GBP on GABAergic transmission that might influence network excitability have been reported, including inhibition of GAT1 that would enhance GABA inhibition (Eckstein-Ludwig et al. 1999; Fijałkowski et al. 2017). Binding of GBP to α2δ-2 receptors expressed on interneurons (Cole et al. 2005) would potentially act to limit new excitatory synapses induced by TSPs onto GABAergic neurons after injury. GBP has a significantly higher binding affinity for α2δ-1 than α2δ-2 (Gong et al. 2001), so it is likely that effects to limit new excitatory synapses were principally on excitatory innervation of pyramidal cells, rather than interneurons. Recent recordings in transgenic mice overexpressing α2δ-1 have shown that GBP reduces mEPSCs but has no effects on mIPSCs in Pyr cells (W Zhang and DA Prince, unpublished data).
Although the precise mechanism by which GBP provides prophylaxis is yet to be determined, the effects, measured in vitro, on both injury-induced formation of enhanced recurrent excitatory connectivity and network hyperexcitability are striking. These findings may be relevant to prevention of epileptogenesis following TBI.
Authors’ Contributions
D.K.T. and S.J. performed the experiments and D.K.T. analyzed the data. D.K.T. and D.A.P. planned the experiments and wrote the manuscript.
Supplementary Material
Supplementary data are available at Cerebral Cortex online.
Funding
The Neurological Institute of Neurological Disorders and Stroke at the National Institutes of Health (Grant numbers NS12151 and NS090076 to D.A.P.); (F32) (NS077623 to D.K.T.) and the Edward F. and Irene Thiele Pimley Research Fund.
Notes
We thank John Huguenard for helpful suggestions regarding the laser-scanning photostimulation experiments and Michelle Vierra for technical assistance. Conflict of Interest: None declared.