


Abstract
The catechol-O-methyltransferase (COMT) gene is associated with frontal cortex development and the pathophysiology of attention-deficit/hyperactivity disorder (ADHD). However, how the COMT gene impacts brain structure and behavior in ADHD remains unknown. In the present study, we identify the effect of COMT on cortical thickness and surface area in children with ADHD and children with typically developing (TD) using a machine learning approach. In a sample of 39 children with ADHD and 34 age- and IQ-matched TD children, we found that cortical thickness and surface area differences were predominantly observed in the frontal cortex. Furthermore, a path analysis revealed that a COMT genotype affected abnormal development of the frontal cortex in terms of both cortical thickness and surface area and was associated with working memory changes in children with ADHD. Our study confirms that the role of COMT in ADHD is not restricted to the development of behavior but may also affect the cortical thickness and surface area. Thus, our findings may help to improve the understanding of the neuroanatomic basis for the relationship between the COMT genotype and ADHD pathogenesis.
Introduction
Attention-deficit/hyperactivity disorder (ADHD) is one of the most prevalent neurodevelopmental disorders, with a 5.3% worldwide pooled prevalence in children (Polanczyk et al. 2014). Convergent data from brain structure and molecular genetic studies suggest that these factors may play a central role in the etiology and pathogenesis of ADHD (Ellison-Wright et al. 2008; Fowler et al. 2009; Konrad and Eickhoff 2010; Nakao et al. 2011; Qiu et al. 2011; Sun et al. 2014; Hoogman et al. 2017).
For instance, meta-analyses of voxel-based morphometry (VBM) studies (Konrad and Eickhoff 2010; Nakao et al. 2011; Qiu et al. 2011; Hoogman et al. 2017) suggest that decreased subcortical brain volume may serve as an anatomical marker of pathophysiology in children and adults with ADHD. Accumulating evidence from genetic studies (Fowler et al. 2009; Sun et al. 2014) indicates that the catechol-O-methyltransferase (COMT) gene may play a pivotal role in the activation of dopamine within frontal cortex structures, which are critical to executive function and may also underlie the neural pathophysiology of ADHD (Bellgrove et al. 2005). Furthermore, the COMT gene may also affect gray matter volume development through modulation of dopamine levels (Honea et al. 2009; Lee and Qiu 2016). This is noteworthy, as imbalances in dopamine levels during neurodevelopment may alter discrete brain regions in children with ADHD (Bellgrove et al. 2005; Lee and Qiu 2016; Shimada et al. 2017).
In a previous study, investigators reported that a mutation in the COMT gene was associated with decreased gray matter volume in children with ADHD (Shimada et al. 2017). Due to its important role in ADHD pathophysiology and associations with neurodevelopmental processes, the COMT gene may be an important mechanistic factor in the etiology of ADHD (Sun et al. 2014; Mizuno et al. 2017). Although many studies have employed volumetric approaches to the study of ADHD-associated neuroanatomy, a more detailed characterization of structural factors such as cortical thickness and surface area and their associations with ADHD may aid in further understanding this complex neurodevelopmental psychopathology (Hyatt et al. 2012; Kelly et al. 2013).
Given this background, further study of cortical thickness and surface area in children with ADHD is likely important, as both measurements are related to distinct brain characteristics and can be influenced by genetic factors (Panizzon et al. 2009) and atypical brain growth trajectories (Wallace et al. 2013). However, to the best of our knowledge, no study has assessed the association between these 2 neurostructural characteristics (cortical thickness and surface area) and COMT polymorphisms in children with ADHD.
Thus, the aim of the present study was to investigate the effects of a COMT gene polymorphism on cortical thickness and surface area in children with ADHD. We used a machine learning approach to predict cortical thickness and surface area differences between children with ADHD and typically developing (TD) children, as well as their respective associations with a COMT gene polymorphism. Specifically, this study had 3 goals: 1) to classify cortical thickness and surface area features which differ between ADHD and TD children; 2) to determine whether there is an association between assessed neuroanatomical features and the COMT gene polymorphism; and 3) to examine the association between neuroanatomical feature alterations and the core symptoms of ADHD. We hypothesized that children with ADHD would have neuroanatomical differences in frontal brain regions associated with a COMT polymorphism genotype and that these differences would be associated with the core symptoms of ADHD.
Materials and Methods
Participants
Seventy-three boys (39 with ADHD and 34 TD) aged 7–15 years with intelligence quotients (IQs) ≥80 (assessed using the Wechsler Intelligence Scale for Children-Fourth edition) (Wechsler 2003) participated in this study. Children with ADHD met the Diagnostic and Statistical Manual of Mental Disorders-5 diagnostic criteria, as determined by an experienced clinician (Y.M., S.T., or A.T.) at the University of Fukui Hospital. Twenty-seven children with ADHD were further classified as combined presentation, while 12 had a predominantly inattentive presentation. Comorbid diseases were evaluated using a semistructured diagnostic interview using the Mini International Neuropsychiatric Interview for Children and Adolescents (MINI Kid) (Duncan et al. 2018). Children with ADHD included 5 patients with comorbid oppositional defiant disorder, one with episodes of mania, and one with a specific learning disorder. We confirmed that the children with ADHD did not also have ASD, and that the TD children did not have ASD or psychiatric diseases using the MINI Kid, which was administered by an experienced clinician (Y.M., S.T., or A.T.). To investigate ADHD symptom severity and social position, all parents of participants were asked to complete an ADHD rating scale (Pappas 2006) and provide information regarding socioeconomic status (SES) based on the Hollingshead Index of Social Position (Hollingshead and Hollingshead 1957). As in a previous study, the working memory index was determined using the WISC-IV (Gray et al. 2012). The exclusion criteria for both groups included any contraindications for magnetic resonance imaging (MRI), Full-Scale Intelligence Quotient (FSIQ) score < 80, a history of severe head trauma, neurological abnormalities, and drug or substance abuse. Fifteen children with ADHD were medication-naïve, 20 were medicated with osmotic release oral methylphenidate, 4 were medicated with atomoxetine, and one was medicated with aripiprazole. All participants and their parent(s) provided written informed consent and all procedures were approved by the ethics committee of the University of Fukui (assurance no. 20110104). This study is registered with the University Hospital Medical Information Network (UMIN000025830).
Image Data Acquisition
MRI was performed using a 3-T MR scanner (Discovery MR 750; General Electric Medical Systems, Milwaukee, WI, USA). High-resolution T1-weighted anatomical MRI (repetition time = 6.38 ms, echo time = 1.99 ms, flip angle = 11°, field of view = 256 mm, 256 × 256 matrix, 172 slices, and voxel dimensions = 1.0 × 1.0 × 1.0 mm) was performed at the University of Fukui Hospital. All participants were medication-free (including methylphenidate and atomoxetine) prior to MRI for at least 5 times half-lives, consistent with previous studies (Fair et al. 2010; Mizuno et al. 2017).
Data Preprocessing
A vertex-based approach provided information on cortical thickness and surface area across several thousand cortical folding patterns within a brain surface curvature template (Fischl 2012). To investigate cortical thickness and surface area information, FreeSurfer version 6.0 software package (available from: http://surfer.nmr.mgh.harvard.edu/) was used. Similar to our previous study (Jung et al. 2017), preprocessing of anatomical data was performed using the following steps: 1) motion correction and non-uniformity correction, 2) automatic Talairach transformation, 3) intensity normalization, 4) skull strip and segmentation of the subcortical white and gray matter, 5) tessellation of the white and gray matter, 6) surface smoothing and inflation, 7) topology correction, and 8) parcellation. Cortical reconstructions were reviewed for quality and corrected by trained experts as necessary. Finally, cortical thickness, surface area, and volume were calculated across 148 regions using the Destrieux Atlas template (Fischl 2012).
Classification Feature Selection to Distinguish Between TD and ADHD
Cortical thickness, surface area, and volume served as features that were input into the classification analyses using support vector machine-recursive feature elimination (SVM-RFE), implemented using LIBSVM v3.18 under Matlab R2015a (available from: http://www.csie.ntu.edu.tw/~cjlin/libsvm/). We report the cross-validation accuracy, sensitivity, and specificity for each of the 3 brain structure measurements used. All analyses were performed using 10-fold cross-validation to avoid overfitting of the model. In brief, significant differences in the 3 brain structure measurements between the TD participants and those with ADHD were assessed in 148 brain regions and detected using a mass univariate 2-sample t-test with a threshold of P < 0.001, as in a previous study (Yahata et al. 2016). Features with the most discriminative powers were fed into an SVM with a linear kernel. Non-parametric permutation tests were used (1000 times) to estimate the statistical significance of the observed classification accuracy. Finally, using SVM-RFE, we selected for the feature with the most discriminative power as the classifier used to train the classification model and obtain weights for each feature. To estimate the performance of the classifiers and to rank the features in each iteration, we used a 10-fold cross-validation strategy. If the classifier trained on real class labels had an accuracy exceeding the 95% confidence interval generated based on the accuracies of the classifiers trained on randomly relabeled class labels, it was considered well performing. To further examine the classifier’s generalization capability, the performance of the classifier was further tested using an independent dataset available from the ADHD-200 sample imaging database (http://fcon_1000.projects.nitrc.org/indi/adhd200/) under an unrestricted usage agreement for non-commercial research purposes. The inclusion criteria were as follows: 1) full-scale IQ (F-IQ) scores > 80, 2) age between 7 and 15 years to minimize potential developmental effects, 3) scans obtained using a 3-T MRI scanner to increase between-site reliability, and 4) males. We preprocessed the MRI data using the same procedure as that used for the analysis of our data and calculated the cortical thickness for each subject (Jung et al. 2017).
Structural Covariance Analysis
Structural covariance analysis is emerging as a valuable approach for assessing brain structure in the context of neurodevelopmental disorders, as reported previously (Ecker, Ronan, et al. 2013; Bethlehem et al. 2017). Thus, we performed structural covariance analysis to investigate structural brain organization differences between the 2 groups using the Brain Connectivity Toolbox (brain-connectivity-toolbox.net) (Rubinov and Sporns 2010). To construct adjacency matrices for network analyses, we computed a 148 region of interest (ROI) × 148 ROI correlation matrix after adjustments to remove potential effects of age, SES, and FSIQ using regression analysis.
Node degree was calculated by counting the number of links connected to other nodes in order to identify group-level differences within levels of network density. The top 10% of nodes with the highest degrees of connectivity were retained as hubs (Bethlehem et al. 2017). To investigate the overall distribution differences between the 2 groups, group correlation matrices for all ROI pairs were calculated by thresholding at P-values ranging between 0.1 and 0.4 in 0.02 increments (k = 0.1, 0.12, 0.14, 0.16, 0.18, 0.2, 0.22, 0.24, 0.26, 0.28, 0.3, 0.32, 0.34, 0.36, 0.38, and 0.4). All substantial covariance connections that survived a false discovery rate (FDR) correction were identified.
Single-Nucleotide Polymorphism Genotyping
Genomic DNA was extracted from the buccal mucosa cells using a standard phenol–chloroform method using the QIAamp DNA Micro Kit (Qiagen, Tokyo, Japan). We targeted the COMT Val158Met (rs4680) single-nucleotide polymorphism (SNP), which was selected due to its significant association with ADHD in a previous meta-analysis (Gizer et al. 2009). SNPs were genotyped using TaqMan genotyping assays (Applied Biosystems, Foster City, CA, USA) and the standard protocols provided by the manufacturer. The 5′-CCCAGCGGATGGTGGAT-3′ forward and 5′-CAGGCATGCACACCTTGTC-3′ reverse primers predesigned by assay-by-design method were used (Applied Biosystems, Foster City, CA, USA). All samples were genotyped via real-time polymerase chain reaction (PCR) analysis using the StepOnePlus System (Applied Biosystems). Reactions were performed in 10-μL volumes containing 9 ng genomic DNA, 0.25 μL of Tris-EDTA buffer, 0.25 μL of each TaqMan probe, and 5 μL TaqMan PCR Master Mix. The PCR cycling conditions comprised one 20-s cycle at 95 °C, followed by 40 cycles at 95 °C for 3 s, and at 60 °C for 20 s. For each amplification, 4.5 μL of HPLC-grade water containing Master Mix was used as a negative PCR control. Genotype discrimination was then performed using StepOnePlus System software (version 3.0.1.).
The Influence of COMT Genotype on Classification Features
To investigate brain-genotype associations, the 2 groups (Val/Val and Met carriers) were compared in terms of the anatomical classification features (cortical thickness and surface area). We used the analysis of covariance (ANCOVA) to determine whether COMT genotype explained the variances in cortical thickness and surface area between groups, with age, FSIQ, and SES as covariates. Post hoc analyses for COMT-genotype group comparisons were carried out only when statistical significance emerged from the ANCOVA. The accepted value for significance was P ≤ 0.05. Statistical comparisons of the data were carried out using SPSS software (SPSS Inc., Chicago, IL, USA).
Brain–Behavior Relationship Analyses
We performed correlation analyses to investigate the relationship between group differences observed during classification feature selection and symptom severity scores (ADHD Rating Scale [ADHD-RS] scores and working memory index scores) separately for each group (ADHD and TD) while controlling for the effects of age, FSIQ, and SES using partial correlations. Path analysis was also performed to investigate the multiple relationships among the COMT gene polymorphism, ADHD group classification features, and the effects of working memory, a deficit associated with ADHD. The measures used were the goodness-of-fit index (GFI) (a measure of the overall model fit), the adjusted GFI, and the Akaike information criterion. The fitness of residuals was assessed using the root-mean-square error of approximation (RMSEA). Details of the method for ADHD classification is described in Figure 1.
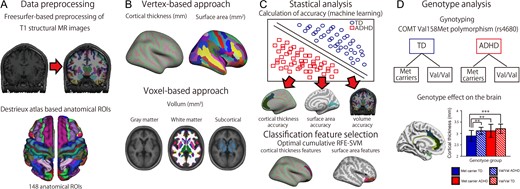
A flowchart for investigating the effects of COMT on cortical thickness and surface area in children with ADHD. (A) Preprocessing of T1-weighted anatomical images using Freesurfer and the Desikan–Killiany parcellation atlas. (B) The vertex-based and voxel-based approaches. (C) Statistical analysis used to assess classification accuracy and the classification features based on support vector machine-recursive feature elimination. (D) Genotype-wise analysis of effects on the brain.
Results
Demographic and Clinical Characteristics
There were no significant differences between the ADHD and TD groups in average age (P = 0.1), FSIQ (P = 0.12), or the SES score (P = 0.21) (Table 1). There were significant differences in the ADHD-RS total score, ADHD-RS inattention score, and ADHD-RS hyperactivity–impulsivity score (all P’s < 0.001) between the 2 groups.
Participant demographics
| TD | ADHD | Difference (P-value) | |
|---|---|---|---|
| TD-ADHD | |||
| P | |||
| Subjects (n) | 34 | 39 | |
| Age (years) | 11.2 (2.2) | 10.5 (1.8) | 0.1 |
| Handedness (right/left) | 32/2 | 33/6 | 0.37 |
| SES (SD) | 31.7 (16.4) | 36.0 (13.5) | 0.21 |
| FSIQ (SD) | 104.2 (9.8) | 98.7 (13.6) | 0.12 |
| WMI (SD) | 102.3 (10.7) | 95.3 (15.7) | 0.03 |
| ADHD-RS total (SD) | 3.7 (5.1) | 22.9 (9.8) | <0.0001 |
| ADHD-RS IN (SD) | 2.8 (3.3) | 14.3 (5.9) | <0.0001 |
| ADHD-RS HI (SD) | 0.9 (2.4) | 8.5 (5.5) | <0.0001 |
| Genotpye | |||
| COMT genotype | |||
| Met carriers/Val/Val | 15/19 | 22/17 | 0.29 |
| Brain Volume | |||
| Gray matter volume (SD) | 759 949.0 (45 901.4) | 751 637.8 (58 860.3) | 0.51 |
| White matter volume (SD) | 439 912.4 (41 846.9) | 429 438.4 (57 012.9) | 0.38 |
| Subcortical volume (SD) | 61 520.0 (4232.9) | 60 390.8 (4649.8) | 0.28 |
Note: HY, hyperactivity/impulsivity; IN, inattention; SD, standard deviation; WMI, working memory index.
Classification Feature Selection to Distinguish TD from ADHD Using Machine Learning
The cortical thickness classification feature had the highest and most robust classification accuracy for all cortical features, with 79% accuracy, 88% sensitivity, and 74% specificity. The surface area classification feature had 74% accuracy, 65% sensitivity, and 69% specificity. The volume classification feature had 66% accuracy, 53% sensitivity, and 56% specificity. A classification analysis of cortical thickness measured in the ADHD and TD groups revealed 16 cortical thickness features (Fig. 2 and Supplementary Table S1). When compared with the TD group, the ADHD group had increased cortical thickness in the bilateral anterior cingulate cortex (ACC), bilateral middle cingulate cortex (MCC), bilateral orbital cortex sulcus (OrbS), left frontomarginal cortex (FMC), left orbital inferior frontal cortex (oIFC), left triangular inferior frontal cortex (tIFG), left insular cortex (INSG), left superior temporal cortex, left superior insular cortex (sINS), left pericallosal cortex (PerIC), right superior occipital cortex (OCG), right middle frontal cortex (MFG), and right suborbital cortex (sOrb). There was no decreased cortical thickness in the ADHD group when compared with the TD group. The classification analysis of the measured surface area in the 2 groups revealed 11 surface area features (Fig. 3 and Supplementary Table S1). When compared with the TD group, the ADHD group had decreased surface area in the bilateral orbital cortex gyrus (OrbG), bilateral anterior insular cortex, left subcentral cortex, left precentral cortex, left middle temporal cortex, left temporal pole cortex, left sINS, and right calcarine cortex. There were no regions with increased surface area in the ADHD group when compared with the TD group. To investigate the effects of comorbid disorders (6 participants), we used an ANCOVA to examine cortical thickness and surface area differences between subjects with ADHD without comorbid disorders and those with ADHD with comorbid disorders, with age, FSIQ, and SES as covariates. There were no significant differences between the 2 groups (Supplementary Table S1). To examine whether medication status affected differences in cortical thickness and surface area, we performed a t-test between the current medication group and the medication-naïve group. There were no significant differences between the different groups any of all cortical features (P > 0.12). Table 2 list classification performance for cortical thickness, surface area and volume, respectively.
Machine learning results
| Method | Accuracy (%) | Sensitivity (%) | Specificity (%) |
|---|---|---|---|
| Cortical thickness (mm) | 79.4 | 88.2 | 74.3 |
| Surface area (mm2) | 73.9 | 64.7 | 69.2 |
| Gray matter volume (mm3) | 65.7 | 52.9 | 56.4 |
| Method | Accuracy (%) | Sensitivity (%) | Specificity (%) |
|---|---|---|---|
| Cortical thickness (mm) | 79.4 | 88.2 | 74.3 |
| Surface area (mm2) | 73.9 | 64.7 | 69.2 |
| Gray matter volume (mm3) | 65.7 | 52.9 | 56.4 |
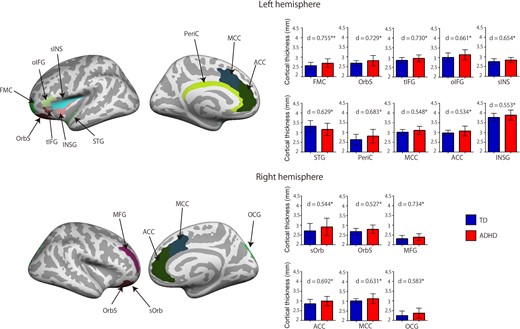
Cortical thickness classification features. The ADHD group had increased cortical thickness in the bilateral ACC, MCC, OrbS, left FMC, oIFC, tIFG, INSG, STG, sINS, PerIC, right superior OCG, MFG, and sOrb. The red bar indicates the ADHD group and the blue bar indicates the TD group. Error bars represent standard errors of the mean. d indicates effect size. **P < 0.01, *P < 0.05, 2-tailed.
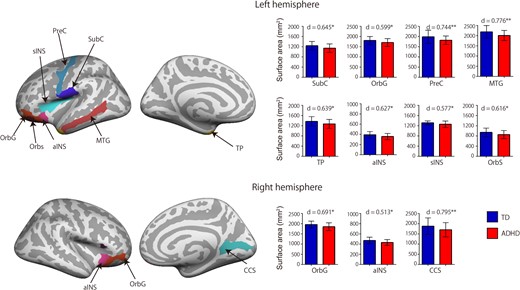
Surface area classification feature. The ADHD group had decreased surface area in the bilateral OrbG, aINS, left SubC, PreC, MTG, temporal pole cortex (TP), sINS, OrbS, and right calcarine cortex (CCS). The red bar indicates the ADHD group and the blue bar indicates the TD group. Error bars represent standard errors of the mean. d indicates effect size. **P < 0.01, *P < 0.05, 2-tailed.
We tested the generalizability of the classifier using an independent dataset available from the ADHD-200 sample imaging database. From the ADHD-200 data pool, we selected a final dataset comprising data from 83 boys with ADHD (11.2 ± 1.8 years old, FIQ: 109.9 ± 13.1) and 115 age-matched TD boys (10.9 ± 1.5 years old, FIQ: 111.7 ± 9.7) (Supplementary Table S2). Sixty-one boys with ADHD and all of the TD boys were psychotropic medication-naïve. The present cortical thickness classifier achieved an accuracy of 73% (area under the curve = 0.731). The present surface area classifier achieved an accuracy of 69% (area under the curve = 0.688).
Hub and Degree Distribution
Hubs in the TD group were located within the frontal and parietal cortices. In contrast, hubs in the ADHD group were located within the temporal and parietal cortices. Hubs common to the 2 groups were located within frontal and parietal cortices (Supplementary Fig. S1). There were 11 cortical thickness features with significant degree distribution differences between the 2 groups. Compared with TD participants, ADHD participants showed decreased degree distributions in the left FMC, left sINS, left PeriC, left INSG, right MFG, and right ACC (all q’s < 0.05; FDR correction) and increased degree distributions in the left tIFG, right sOrb, right OCG, and bilateral MCCs (all q’s < 0.05; FDR correction) (Supplementary Fig. S2).
The Influence of COMT Genotype on Classification Features
To investigate the effects of COMT polymorphism on the cortical classification features, we compared 4 genotype subset groups: Val–Val genotype with ADHD (VV-ADHD), Met carrier genotype with ADHD (M-ADHD), TD with Val–Val genotype (VV-TD), and TD with Met carrier genotype (M-TD). We used ANCOVA to determine whether COMT genotype explained the variances in cortical thickness and surface area between the TD and ADHD groups. There were significant cortical thickness differences in the left oIFG (P = 0.005, covarying for age, FSIQ, and SES) and surface area differences in the left OrbS (P = 0.008, covarying for age, FSIQ, and SES) between participants with ADHD and the TD subjects (Fig. 4A). The M-TD group had decreased cortical thickness in the left oIFG when compared with the VV-ADHD (P < 0.001), M-ADHD (P = 0.005), and VV-TD groups (P = 0.006) (Fig. 4B). The M-ADHD group had decreased surface area in left OrbS when compared to the VV-ADHD (P < 0.015), VV-TD (P = 0.009), and M-TD groups (P = 0.004) (Fig. 4C).
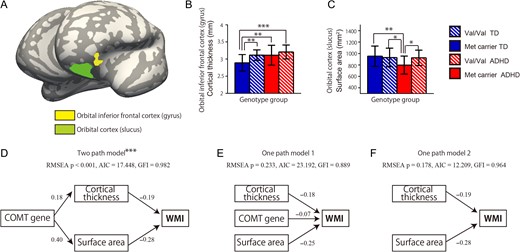
The effects of COMT genotype on classification features. (A) Brain map showing the left orbital inferior frontal cortex (yellow) and left orbital cortex (green). ANCOVA was used to examine the ability of the COMT genotype to explain the differences in cortical thickness and surface area between the groups. (B) Bar graph indicating that the typically developing (TD) Met carrier group had decreased cortical thickness in the left orbital inferior frontal cortex when compared with the Val/Val-genotype ADHD, Met carrier ADHD, and Val/Val-genotype TD groups. (C) Bar graph indicating that the Met carrier ADHD group had decreased surface area in the left orbital cortex when compared with the Val/Val-genotype ADHD, Met carrier TD, and Val/Val TD-genotype groups. Error bars represent standard errors of the mean. (D) A 2-path model revealed the relationship between participant COMT polymorphism status, brain features, and working memory scores (RMSEA P < 0.001, AIC = 17.448, GFI = 0.982). (E) One-path model (RMSEA P < 0.001, AIC = 17.448, GFI = 0.982). (F) A second one-path model revealed the relationship between brain features and working memory scores (RMSEA P = 0.178, AIC = 12.209, GFI = 0.964). ***P < 0.001, **P < 0.005, *P < 0.01, 2-tailed. Path values are standardized regression coefficients.
Brain–Behavior Association Analysis
There were significant associations between working memory scores and cortical thickness in the left oIFG (r = −0.582, P = 0.009; Supplementary Fig. S3A) and left OrbS (r = −0.590, P = 0.008; Supplementary Fig. S3B) in subjects in the M-ADHD group. Pathway analysis revealed that the 2-path model had satisfactory GFI indices (RMSEA P < 0.001, Akaike information criterion [AIC] = 17.448, GFI = 0.982; Fig. 4D), and that the one-path model did not have satisfactory indices (one-path model 1: RMSEA P = 0.233, AIC = 23.192, GFI = 0.889; Fig. 4E; one-path model 2: RMSEA P = 0.178, AIC = 12.209, GFI = 0.964; Fig. 4F). These results suggest that the 2-path model provided the best fit. However, there were no significant associations between ADHD-RS scores and cortical features (P > 0.1).
Discussion
In the present study, we investigated the effects of a COMT gene polymorphism (SNP) on cortical thickness and surface area in children with ADHD. Classification accuracy based on cortical thickness (79%) was higher than that based on cortical surface area (74%) or volume (66%). The COMT gene polymorphism affected cortical thickness and surface area in the oIFG and OrbS, features that were significantly different between the ADHD and TD groups. Further, these brain regions were found to be associated with the working memory index in children with ADHD. Specifically, cortical thickness in the oIFG and the surface area of the OrbS in Met allele carriers in the ADHD group were negatively associated with the working memory index. These findings highlight the role of the COMT gene in brain structure and behavior in children with ADHD.
Previous studies have reported that abnormal developmental patterns in cortical thickness and surface area are associated with neurodevelopmental disorders (Jiao et al. 2010; Hyatt et al. 2012; Ecker, Ginestet, et al. 2013; Bethlehem et al. 2017). For example, Jiao et al. (2010) found that vertex-based classification accuracy outperformed volume-based classification accuracy for autism spectrum disorder (ASD) (cortical thickness: 76%, volume: 71%). Consistent with this finding, we found that vertex-based classification had higher accuracy than volume-based classification (cortical thickness: 79%, surface area: 74%, volume: 66%) using a machine learning method. Moreover, our cortical thickness classifier achieved a high performance with an accuracy of 73% in an independent validation cohort. These findings suggest that cortical thickness may serve as a better structural predictor of neurodevelopmental disorders than volume.
In the present study, we also found that children with ADHD had abnormal cortical thickness and surface area in frontal cortex regions including the ACC, OrbS, FMC, oIFC, tIFG, sOrb, and the OrbG when compared with TD children. Abnormal cortical thickness in ADHD was most prominent in the orbitofrontal cortex, consistent with previous studies reporting abnormal cortical thickness in the frontal cortex in children and adults with ADHD (Makris et al. 2007; Shaw et al. 2007; Almeida et al. 2010; Yang et al. 2015). The orbitofrontal cortex is involved in executive functions such as decision-making (Bechara 2000; Wallis 2012), reinforcement learning (Wilson et al. 2014), and working memory (Yuan and Raz 2014). Taken together, these results suggest that abnormal cortical development in the frontal cortex may underlie some of the executive function deficits associated with ADHD. Nonetheless, our finding of increased cortical thickness in the frontal cortex in patients with ADHD may appear inconsistent with the findings of other brain imaging studies (Shaw et al. 2007; Yang et al. 2015) indicating that patients with ADHD have decreased cortical thickness in the medial prefrontal cortex, prefrontal cortex, and ACC when compared with TD subjects. These conflicting findings may be due to inconsistency in the age ranges of the ADHD sample populations. For instance, Shaw et al. (2007) used mixed-model regression analysis to model developmental changes within the age range of 5–20 years. Yang et al. (2015) also only included participants within the age range of 5.9–10.8 years. These discrepancies illustrate the importance of combining information from regional differences at the age in which cortical thickness peaks.
Children with ADHD had complex hub distributions in the cortical thickness classification feature. While these hubs in children with ADHD were mainly located in the temporal and parietal cortices, hubs in TD children were located in the frontal and parietal cortices. Moreover, we found differences in hub distribution based on right and left cortical thickness classification features. A previous study similarly indicated that children with ADHD have different hub locations and altered hub distribution across the brain when compared with TD children (Bethlehem et al. 2017). This imbalance in hub development may indicate and/or be functionally related to abnormal cortical maturation over local networks in children with ADHD.
We discovered here that the Met allele affected cortical thickness in the oIFG and the surface area of the Orbs. A mouse and human study (Sannino et al. 2015) reported increased cortical thickness in the inferior frontal sulcus among men with the Met allele of COMT, but not in women with the same genotype. Convergent findings from VBM studies also indicate that the Val/Met variant alleles of the COMT gene affect gray matter development in the frontal cortex (Kates et al. 2006; Caldú et al. 2007; Honea et al. 2009), a region that is consistently reported to be altered in children with ADHD (Shaw et al. 2007; Almeida et al. 2010; Yang et al. 2015). Moreover, some studies have reported an association between the Met allele of COMT and ADHD and other psychiatric disorders (Barr et al. 2001; Sun et al. 2014). Taken together, these findings indicate that Met allele of COMT affects cortical thickness and surface area in the frontal cortex, providing further evidence for the biological impact of variations within COMT on cortical maturation. Furthermore, a meta-analysis demonstrated the influence of COMT on the degradation of dopamine, executive functioning, and frontal cortex development (Sun et al. 2014), suggesting possible mechanistic links underlying our findings. Given the previously reported role of COMT in regulating synaptic dopamine levels in the frontal cortex (Mier et al. 2010), we speculate that our findings may be due to the modulation of cortical thickness and surface area development in this dopamine-rich brain region.
We also report here that carrying the Met allele influenced working memory performance in the M-ADHD group. Association studies of COMT genotype and working memory in neurotypical adults have suggested that COMT is related to working memory performance, as assessed via the N-Back task (Tunbridge et al. 2006; Mier et al. 2010; Sannino et al. 2015). A further meta-analysis reported that specific COMT genotypes are significantly associated with ADHD, and that the Met allele may be especially critical (Sun et al. 2014). In addition, our pathway analysis suggested that a 2-path model conformed best to 3 variables (COMT genotype, brain structure changes, and working memory changes) as compared with a one-path model, which assumes that brain structure changes and COMT genotype together induced working memory changes. Taken together, our findings indicate that the Met allele of COMT may result in abnormal development of the frontal cortex, which is further linked to working memory deficits in children with ADHD.
The present study had several limitations that should be addressed in future studies. First, a specific effect of a COMT polymorphism may not have been detected, as they may have been dissociated from specific risk factors for ADHD. Future studies should confirm associations between the effects of the COMT polymorphism and ADHD risk using a more sophisticated analysis method, such as by considering multiple genetic interactions and gene–brain feature interactions in a larger sample size. Second, it is important to note that the interpretation of these results is limited to a structural, rather than functional, MRI context. We cannot rule out the possibility that some of the difference in cortical thickness and surface area identified here are related to ADHD subtype (combined vs. predominantly inattentive). This issue extends to behavior and MRI results. Further studies are needed to identify how varied COMT genotypes, as well as ADHD-linked behaviors and brain structure, effect ADHD presentations. Third, a previous study reported that ADHD is often accompanied by ASD, and that even patients with only ADHD presented with higher parent ratings of autistic traits (Grzadzinski et al. 2011). Although we assessed ADHD symptom scores in both children with ADHD and TD children, we did not obtain ASD symptom scores. To capture the optimal association between alterations in neuroanatomical features and the core symptoms of ADHD, future studies should focus on interactions between ADHD and ASD symptoms in patients with both disorders. Fourth, the present study included only young male participants. Future studies are needed to clarify whether sex and/or age effects drive brain structure alterations in patients with ADHD. Finally, although all participants were medication-free prior to MRI scanning for at least 5 times half-lives, a study has reported that psychotropic medication usage may have an effect on increased neurostructural characteristics (e.g., surface area and gyrification) (Wallace et al. 2013). Future studies should study the link between psychotropic medication usage and brain structure in subjects with ADHD to further explore the age-dependence of the atypical above-described increase in neurostructural characteristics.
In conclusion, our results provide the first neuroimaging evidence that the COMT gene is associated with cortical thickness and surface area abnormalities in children with ADHD. Our findings suggest that the COMT genotype affects frontal cortex development, a region critically implicated in working memory, which is also disrupted in ADHD. These results may help to improve the present understanding of the neuroanatomic and genetic basis, as well as interactions between these domains, in ADHD.
Funding
Scientific Research (B) (#15H03106 to A.T.), Challenging Exploratory Research (#17K19898 to A.T.), and a Grant-in-Aid for Young Scientists (#18K15481 to M.J., #18K13106 to Y.M.) from the Japanese Ministry of Education, Culture, Sports, Science, and Technology (MEXT) of Japan. A Grant-in-Aid for “Creating a Safe and Secure Living Environment in the Changing Public and Private Spheres” (to A.T.) from the Japan Science and Technology Corporation (JST)/Research Institute of Science and Technology for Society (RISTEX) and a research grant from the Takeda Science Foundation (to A.T.).
Notes
The authors would like to express our sincere appreciation to the participants and their families, who generously and courageously participated in this research. Conflict of Interest: None declared.
References
Author notes
Minyoung Jung and Yoshifumi Mizuno are contributed equally to this work