


Abstract
The cognitive and neural bases of the ability to focus attention on information in one sensory modality while ignoring information in another remain poorly understood. We hypothesized that bimodal selective attention results from increased activity in corresponding sensory cortices with a suppression of activity in non-corresponding sensory cortices. In a functional magnetic resonance imaging (fMRI) study, we presented melodies and shapes alone (unimodal) or simultaneously (bimodal). Subjects monitored for changes in an attended modality while ignoring the other. Subsequently, memory for both attended and unattended stimuli was tested. Subjects remembered attended stimuli equally well in unimodal and bimodal conditions, and significantly better than ignored stimuli in bimodal conditions. When a subject focused on a stimulus, the blood-oxygen-level-dependent (BOLD) response increased in sensory cortices corresponding to that modality in both unimodal and bimodal conditions. Additionally, the BOLD response decreased in sensory cortices corresponding to the non-presented modality in unimodal conditions and the unattended modality in bimodal conditions. We conclude that top-down attentional effects modulate the interaction of sensory cortical areas by gating sensory input. This interaction between sensory cortices enhances processing of one modality at the expense of the other during selective attention, and subsequently affects memory encoding.
Introduction
In everyday life simultaneous information constantly bombards all of our senses. Attention is, in part, a mechanism for selecting behaviorally relevant information while simultaneously filtering irrelevant information. While the ability to select among and divide attention between simultaneous sensory inputs is an important part of everyday cognitive processes, the sensory systems have traditionally been studied in isolation. Recent neuroscience exploration of the interaction of sensory systems has focused on the integration of multimodal information (for a review, see Calvert, 2001; Stein and Meredith, 1993). Integrating complementary multisensory information leads to perceptual facilitation and a superadditive response in corresponding sensory cortices (Calvert et al., 2000). However, multimodal information from the outside world is not always complementary and is not always meant to be integrated into a unitary percept. Often information received by the different sensory modalities needs to be filtered, such that information reaching one modality is attended to while information reaching another modality is ignored. Cognitive researchers have shown that bimodal selective attentive is more difficult than simply attending to a single stimulus in one modality (Tulving and Lindsay, 1967). While the behavior associated with bimodal selective attention is generally understood, its neural correlates are not. Therefore, our current aim is to explore the neural basis of how the sensory systems interact during bimodal selective attention to unrelated events.
Cognitive models of selective attention are primarily based on within-modality selective attention paradigms. All models presuppose that selection of behaviorally relevant information is possible, whether selection is early (Broadbent, 1957), attenuated (Treisman, 1964) or late (Deutsch and Deutsch, 1963) in the information processing stream, and whether perceptual load (Lavie, 1995) plays a role. Recent imaging studies show that modulations of activity in sensory cortex accompany within-modality selective attention. For example, focusing attention to one ear in a dichotic listening task leads to increased activity in auditory cortices contralateral to the attended ear (Alho et al., 1999; Jäncke et al., 1999, 2001). In visual search paradigms, attention to one spatial location (Kaster et al., 1998), to one of two superimposed objects (O'Craven et al., 1999), or to one stimulus feature among many such as motion, color or shape (Corbetta et al., 1991; Barrett et al., 2003; Liu et al., 2003) enhances information processing of the attended features and increases neural response in visual cortices which process those features. Heteromodal areas (i.e. frontal and parietal cortices) are also often recruited during unimodal auditory (Jäncke and Shah, 2002) and visual (Corbetta and Shulman, 2002) attention tasks.
Fewer behavioral and neuroimaging studies have examined bimodal selective attention. Behaviorally, between-modality selection of information is easier than within-modality selection (Treisman and Davies, 1973; Duncan et al., 1997; Rees et al., 2001). However, imaging studies show rather inconsistent results; some show that attention modulates activity in sensory cortices, while others do not. For example, with presentation of visual and heard numbers, attending to one modality while ignoring the other led to increased blood-oxygen-level-dependent (BOLD) signal in sensory cortices subserving the attended modality (Woodruff et al., 1996). However, these results are inconclusive because selective attention conditions were compared with each other rather than a baseline condition. Without a baseline condition, it is unclear whether the change in BOLD signal was accompanied, or was caused, by decreased BOLD signals in sensory cortices subserving the unattended modalities. In a study of bimodal spatial attention (O'Leary et al., 1997), activity in sensory cortices varied with attention to the left or right ear, and left or right visual field. However, these changes were inconsistent, with contralateral increases in left auditory areas along the superior temporal gyrus (STG) greater than in right, and contralateral activation of visual cortices only with spatial attention directed to the right visual field. Again, due to limited baseline measures, it is unclear if the changes reflect only enhancement in contralateral areas, or simultaneous inhibition of ipsilateral areas. A recent study compared stimulus-dependent and attention-dependent modulations in the auditory cortices with auditory and visual input (Petkov et al., 2004). Attending to the visual modality with bimodal presentation (stimulus-dependent) recruited mostly medial auditory areas, while attending to the auditory modality with bimodal presentation (attention-dependent) recruited more lateral auditory cortices. However, their design lacks a behavioral measure for the amount of processing occurring when the auditory stimuli are unattended (i.e. stimulus-dependent).
Not all studies find attention modulates activity of sensory areas. For example, activity in visual cortices was not changed by an instruction to ignore the visual stimuli when attention was directed to auditory words with simultaneously displayed visual motion (Rees et al., 2001). Also, a monitoring task requiring a response to changes in either the frequency of a buzzing sound or the movement of a simple visual stimulus showed no modulation in sensory cortices. However, the task did elicit activations in heteromodal regions, such as the temporoparietal junction (Downar et al., 2001). Attention tasks elicit many other multimodal areas, such as the dorsolateral prefrontal cortex (DLPFC), cingulate cortex and parietal cortices (Corbetta et al., 1991; D'Esposito et al., 1995; Corbetta and Shulman, 2002; Faw, 2003). During bimodal attention these multimodal areas may be vital in modulating crosstalk between sensory cortices.
Interaction of the auditory and visual sensory cortices occurs not only in the presence of bimodal information, but also with unimodal information. Presentation of a unimodal stimulus can effect changes in other sensory cortices, often in the form of crossmodal inhibition of sensory cortices subserving the non-presented modality (Haxby et al., 1994; Zatorre et al., 1999; Lewis et al., 2000). Recently, crossmodal suppression was investigated with bimodal presentation of auditory and visual events, compared with unimodal presentation (Laurienti et al., 2002). The unimodal conditions confirmed previous accounts of crossmodal suppression, while the bimodal condition showed no suppression response. However, this crossmodal suppression effect is not consistently demonstrated in all studies with unimodal presentation (Shulman et al., 1997), and therefore warrants further investigation.
Our present goal is to understand how attention modulates the interaction between the auditory and visual sensory cortices. Primarily we hypothesized that increased attention to a modality would be accompanied by increased activity in sensory cortices subserving that modality, with both unimodal and bimodal presentation. Furthermore, we expected attention to increase any crossmodal suppression effect observed during both unimodal presentation and bimodal selective attention conditions. To address these hypotheses, we implemented a unique paradigm that combined monitoring and memory tasks. Vigilance and monitoring tasks, in which subjects attend to and respond to changes in a particular modality, are among the most common paradigms for studying bimodal selective attention. However, such paradigms fail to verify the fate of unattended stimuli, as there is no behavioral response to the to-be-ignored information. Selective attention, therefore, cannot be wholly confirmed, as people may be capable of monitoring for changes in one modality while processing information in both modalities. To avoid this confound, we implemented a post-presentation forced-choice recognition memory test for both attended and unattended stimuli, thereby providing a dependent measure for both to-be-attended and to-be-ignored stimuli. This paradigm was tested in two separate experiments: one purely behavioral and the other combining the behavioral task and functional magnetic resonance imaging (fMRI). During both studies, participants were asked to attend to one modality, perform a monitoring task on that modality and ignore the other modality during an encoding phase. The purpose of the monitoring task was to have an on-line, continuous measure of attention, and to direct attention explicitly to one modality or the other. Because the monitoring task was chosen to be easy, we did not predict any differences in accuracy of performance across conditions. Following the presentation of a series of stimuli in the encoding phase, a recognition task measured memory for attended and unattended information. The number of stimuli remembered was the index of attention, as it is well established that attention is necessary for long-lasting explicit memories (Craik and Lockhart, 1972). Therefore, in our study, we expected information in attended modalities to be remembered better than information in to-be-ignored modalities, which would then validate the attentional instruction. Additionally, in contrast to the majority of bimodal attention studies, the auditory and visual stimuli used in this experiment were complex, novel, not easily verbalized and unrelated, in that they were not meant to be integrated into a unitary percept. Specifically, the stimuli were created to not have overlapping properties or concurrent temporal changes, in order to avoid the integration of the bimodal stimuli into a single object or event.
Materials and Methods
Behavioral Experiment
Subjects
Fourteen healthy volunteers with normal hearing and corrected-to-normal vision participated in the experiment after giving informed written consent for a protocol approved by the McGill Research Ethics Board. The participants were English-speaking, McGill University undergraduate students ranging in age from 18 to 31 years (mean = 25 years). In an attempt to model the normal population, we sampled a wide range of musical experience (0–12 years of musical training).
Stimuli
Auditory stimuli were 7000 ms novel tonal melodies comprising pitches drawn from the Western musical scale centered around the mid-range of the piano from F3 (175 Hz) to G6 (784 Hz). Individual melodies spanned a range no greater than one and a half octaves. All melodies were in major mode and were composed of half and eighth notes. Half of the melodies were 12 beats long, presented at a tempo of 102.85 beats/min such that the duration of a half note was 1168 ms and the duration of an eighth note was 292 ms. The other half of the melodies were 13 beats long, presented at a tempo of 111.42 beats/min such that half notes were 1076 ms and eighth notes were 269 ms. Melodies were rendered in midi file format using SONAR 2 and presented in a piano timbre. The stimuli were presented binaurally at a comfortable listening level for each subject.
Visual stimuli were novel, abstract, closed, two-dimensional shapes comprising 14 black line segments, each of which appeared sequentially to form the shape ‘drawn’ on a white background. Shape segments were presented sequentially to mimic the temporal evolution of the melodies. Individual shapes had the same starting point on the white background. Every 500 ms a new line segment was presented and kept in view. Each line segment was of equal length and was aligned either horizontally or vertically. After 6500 ms a fully formed abstract shape remained in view for 500 ms, unlike the auditory stimuli, which disappeared over time. The shapes were displayed on a computer monitor at a comfortable viewing distance for each subject. When presented simultaneously, the auditory and visual stimuli started and stopped at exactly the same time but the individual elements of the two stimuli never synchronized. Stimuli were presented using Media Control Functions (MCF, Digivox, Montreal, Canada).
Task Design
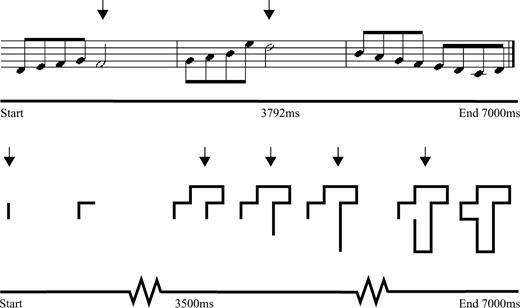
Each subject completed two runs of six conditions, four of which are of interest in this report. Conditions and stimuli were counterbalanced across subjects. Each condition commenced with instructions presented on the monitor, followed by an encoding phase with a block of six trials, and ended with a forced-choice recognition memory test for the previous six trials. During the encoding phase, a one-second pause followed each stimulus presentation. Participants were required to perform an on-line continuous response task while attempting to remember the six stimuli. The purpose of the continuous response task was to direct attention to one modality and to have a measure of on-line performance. The continuous task in the auditory condition was to press a mouse button with the right index finger upon hearing a long note (half note), which was four times the duration of a short note (eighth note). The continuous task in the visual condition was to press a mouse button with the right index finger upon viewing a vertical line segment as opposed to a horizontal line segment as the shape unfolded over time (Fig. 1). To test subjects' memory for shapes at the end of the presentation phase, two fully formed shapes, one target and one foil, were presented on the screen and subjects pressed a mouse button corresponding to the previously seen shape. The recognition memory test for melodies was similar except melodies were presented sequentially with a 1 s pause between them.
Time-course of stimulus presentation. During bimodal conditions melodies and shapes were presented simultaneously, starting and ending at the same time. The novel melodies consisted of half notes (long) and eighth notes (short). During the monitoring task, mouse button presses were required in response to long notes (indicated with arrows). The abstract shape comprised horizontal and vertical line segments which unfolded over time, one line segment every 500 ms. During the monitoring task, mouse button presses were required in response to vertical line segments (indicated with arrows).
Of the four conditions, two were unimodal presentation and two were bimodal presentation (Table 1, Active conditions). In the unimodal auditory active condition, melodies were presented alone, subjects performed the continuous task, and memory for melodies only was tested. In the unimodal visual active condition, shapes were presented alone, subjects performed the continuous response task, and memory for shapes only was tested. In the bimodal auditory active condition, melodies and shapes were simultaneously presented, attention was directed to the melodies through instruction, the continuous task was performed on melodies only, and memory for shapes and melodies was tested. In the bimodal visual active condition, melodies and shapes were simultaneously presented, attention was directed to the shapes through instruction, the continuous task was performed on shapes only, and memory for shapes and melodies was tested. In bimodal active conditions, subjects were aware they would be tested for both attended and unattended stimuli. During the encoding phase, they were instructed to concentrate on remembering only the to-be-attended stimuli. In the memory test, participants were then asked to recognize the previously ignored information as best they could.
Conditions
| Stimuli presented in encoding phase | Task performed during encoding phase | Stimuli Tested in Retrieval Phase | |
|---|---|---|---|
| Active conditions | |||
| Unimodal auditory active | melodies alone | YES | melodies only |
| Unimodal visual active | shapes alone | YES | shapes only |
| Bimodal auditory active | melodies and shapes | YES, only melodies | melodies and shapes |
| Bimodal visual active | melodies and shapes | YES, only shapes | melodies and shapes |
| Passive conditions | |||
| Unimodal auditory passive | melodies alone | NO | none |
| Unimodal visual passive | shapes alone | NO | none |
| Bimodal passive | melodies and shapes | NO | none |
The behavioral experiment included only the active conditions, while the fMRI experiment included the active and passive conditions.
fMRI Experiment
Subjects
Twelve (seven female) healthy, right-handed volunteers with normal hearing and corrected-to-normal vision participated in the experiment after giving informed written consent for a protocol approved by the Montreal Neurological Institute Ethics Review Board. None had participated in the behavioral study. All participants were English-speaking McGill University graduate students who ranged in age from 22 to 35 years (mean = 25 years). Musical experience varied in the sample from 0 to 15 years of musical training.
Stimuli
Auditory and visual stimuli were the same as those used in the behavioral study. Melodies were presented binaurally at a level of ∼80 dB sound pressure level via Siemens MR-compatible pneumatic sound transmission headphones. The visual stimuli subtended a vertical visual angle between 4.5 and 6° and a horizontal visual angle between 3 and 6°. Shapes were projected onto a screen at the foot of the scanner bed using a projector. Subjects viewed the screen through an angled mirror placed on the head coil.
Task Design
Nine participants completed three runs and three participants completed two runs (due to technical difficulties) of seven conditions. Each condition commenced with a silence/blank screen acquisition, then instructions for that condition, followed by an encoding phase with a block of six trials, and finally a forced-choice recognition memory test for the previous six trials. Conditions and stimuli were counterbalanced across subjects; however, all runs started with an active condition, followed by passive and active conditions interleaved. Active conditions were equivalent to those described in the behavioral study (Table 1, Active conditions), except that shapes were presented over time during the forced-choice memory test, exactly as they were presented in the encoding phase, instead of in full form as they were presented in the memory phase of the behavioral study. Passive conditions were used as baseline measures, during which participants were simply asked to listen to and/or view the stimuli. In the unimodal auditory passive condition, melodies were presented alone, no continuous response task was required, and memory was not tested. In the unimodal visual passive condition, shapes were presented alone, no continuous response task was required, and memory was not tested. Finally, in the bimodal passive condition, melodies and shapes were simultaneously presented, no continuous response task was required, and memory was not tested (Table 1, Passive conditions).
fMRI Parameters and Analysis
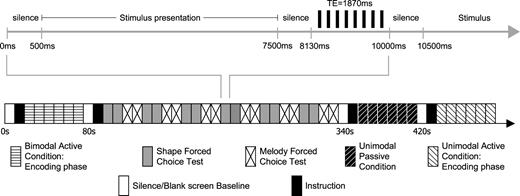
Scanning was performed on a 1.5 T Siemens Sonata imager. A high resolution T1-weighted anatomical scan was obtained for each subject (voxel size: 1 × 1 × 1 mm3, matrix size: 256 × 256). Then three series of 132 T2*-weighted gradient-echo planar images of the BOLD signal, an indirect index of neural activity, were acquired. A headcoil was used to obtain 22 interleaved slices oriented with the Sylvian fissure and covering the entire brain (TE = 1.87 s, TR = 10 s, matrix size: 64 × 64 × 22, voxel size: 5 × 5 × 5 mm3). The long inter-acquisition time minimized the effects of scanner noise on participants' ability to hear the auditory stimuli and avoided contaminating the BOLD signal response to the stimuli in the auditory cortices (Fig. 2) (Belin et al., 1999).
Representation of fMRI protocol. Each trial comprised 10 s: 7000 ms for stimulus presentation, 1130 ms of silence flanking stimulus presentation and 1870 ms for scan acquisition. Although the design is event-related, trials were blocked into encoding and retrieval phases.
BOLD signal images were smoothed using a 12 mm Gaussian kernel, corrected for motion and transformed into standard stereotaxic space using in-house software (Collins et al., 1994). The statistical analysis of the fMRI data was based on a linear model with correlated errors and implemented in a suite of Matlab programs (Worsley et al., 2001). First, the stimulus conditions were set up in a design matrix corresponding to each acquisition. Second, the linear model was solved for, yielding the effects, standard deviations and t-statistics for each run and for each contrast. The three runs for each subject were then combined using the effects and standard deviations from the previous analysis. In a final step, these results were combined yielding the group statistical maps (all 12 subjects) for each contrast. The threshold for significance was set at t = 4.87 for a whole-brain search, based on 90 degrees of freedom, and a corrected significance level of P < 0.05.
Results
Behavioral Experiment
One index of attention was accuracy of continuous response task performance, or the percent of correct responses to long notes in the melodies and vertical line segments in the shapes. Using the formula [(hits – false alarms)/correct number of possible hits] × 100 showed overall near ceiling continuous task performance (mean = 96.4%). However, a 2 (modality) by 2 (presentation) repeated measures analysis of variance (ANOVA) showed a main effect of modality [F(1,13) = 14.4, P < 0.002], with melody performance (mean = 97.4%) better than shape (mean = 95.3%). There was also a main effect of presentation [F(1,13) = 14.3, P < 0.002], with unimodal condition accuracy (mean = 97%) better than bimodal active accuracy (mean = 96%).
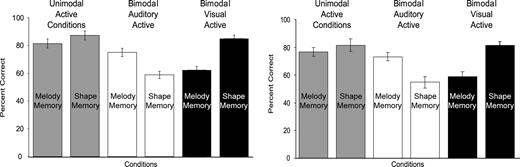
The clearest index of subjects' attention was forced-choice recognition memory test performance, considered to be related to the quality of encoding. The dependent measure was percent correctly remembered out of 12 trials (2 runs with 6 trials in each run). A 2 (modality) by 3 (presentation) ANOVA showed a main effect of presentation [F(2,26) = 12.7, P < 0.001] and an interaction effect [F(2,26) = 15.7, P < 0.001]. Planned comparisons showed that memory in unimodal active conditions was equivalent to memory for to-be-attended information in bimodal active conditions. Most importantly, a planned comparison for an interaction effect between modality and presentation found memory for attended information was better than memory for unattended information in both bimodal active conditions [F(1,26) = 33.0, P < 0.001]. That is, melodies were better recognized than shapes when attention was directed to the auditory modality, while shapes were better recognized than melodies when attention was directed to the visual modality. Overall, the a priori predictions were confirmed (Fig. 3, left graph).
Forced-choice recognition memory results from behavioral (left) and fMRI (right) studies. Melody memory in the unimodal active condition (left gray bar in both graphs) is statistically equivalent to melody memory in the bimodal auditory active condition (left white bar in both graphs), and shape memory in the unimodal active condition (right gray bar in both) is statistically equivalent to shape memory in the bimodal visual active condition (right black bar in both). The interaction effect, shape memory significantly lower than melody memory in the bimodal auditory active condition (white bars in both) and melody memory significantly lower than shape memory in the bimodal visual active condition (black bars in both), is significant in both studies. Data reported as means ± SE.
fMRI Experiment: Behavioral Results
Continuous response task performance was near ceiling (mean = 97.8%), similar to the behavioral experiment. A 2 (modality) by 2 (presentation) repeated measures ANOVA showed a main effect of modality [F(1,11) = 12.6, P = 0.005], with melody performance again (mean = 98.5%) better than shape (mean = 97%). There was also a main effect of presentation [F(1,11) = 11.6, P = 0.006]; however, this time bimodal active condition accuracy (mean = 98.1%) was better than unimodal active condition accuracy (mean = 97.5%). While the data were slightly negatively skewed, a Friedman's nonparametric test confirmed the parametric results.
Forced-choice recognition memory test performance was similar to that observed in the behavioral experiment (Fig. 3, right graph). The dependent measure in this case was percent correct out of 18 trials (three runs with six trials in each run). A 2 (modality) × 3 (presentation) ANOVA showed a main effect of memory modality [F(1,22) = 8.1, P = 0.016), with shapes remembered better than melodies. There was also a main effect of presentation [F(2,22) = 32.4, P < 0.001]. Planned comparisons showed memory in unimodal active conditions was equivalent to memory for to-be-attended information in bimodal active conditions. Again, a planned comparison for an interaction effect between modality and presentation found memory for attended information was better than memory for unattended information in both bimodal active conditions [F(1,22) = 71, P < 0.001]. Therefore, attention directed to the auditory modality led to better recognition of melodies than shapes, and attention directed to the visual modality led to better recognition of shapes than melodies (Fig. 3, right graph).
fMRI Experiment: Imaging Results
Sensory Area Modulations in Auditory Conditions
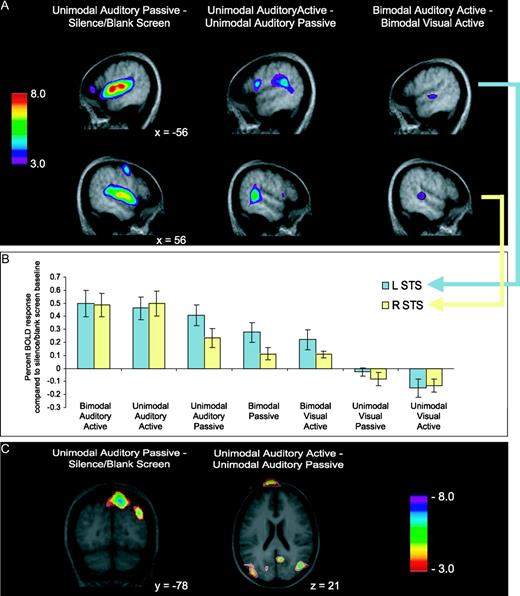
Unimodal passive conditions served as a baseline measure of cortical activity during stimulus presentation without the explicit instruction to attend. Comparing unimodal auditory passive presentation to a silence/blank screen baseline showed bilateral activation of Heschl's gyri as determined from anatomical probability maps (Penhune et al., 1996), and also extensive bilateral activation of secondary auditory areas throughout the superior temporal gyri, as expected. (Table 2; Fig. 4A, left). The same contrast also showed subthreshold decreased BOLD signal across visual and parietal areas, with negative peaks in the right precuneus and right superior occipital gyrus (Fig. 4C, left).
Auditory fMRI results. (A) BOLD response increases across three contrasts. Upper images are sagittal views of the left hemisphere (x = −56 for all images); lower images are of the right hemisphere (x = 56 for all images). Auditory passive minus baseline (left) shows widespread bilateral auditory activity. Auditory active minus passive (middle) shows posterolateral peaks (right STG; bilateral STS). Bimodal auditory active minus bimodal visual active (right) demonstrates bilateral peaks lateral and posterior to Heschl's gyrus along the STS. (B) Trend of decreasing relevance of auditory modality (left to right) and decreasing percent BOLD response in two voxels of interest in STS. (C) Decreases in BOLD response, crossmodal suppression, across two unimodal contrasts. Auditory passive minus baseline (left) shows decreased activity in right precuneus and right superior occipital gyrus. Unimodal auditory active minus passive (right) shows decreased activity in right inferior parietal lobe and right precuneus. See Table 2 for all coordinates. STG, superior temporal gyrys; STS, superior temporal sulcus.
Auditory contrasts
| Contrast | Region of peak | BA | x | y | z | t |
|---|---|---|---|---|---|---|
| Unimodal auditory passive− silence/blank screen baseline | ||||||
| BOLD Increases | L Heschl's gyrus | 41 | −48 | −18 | 8 | 9.1 |
| R Heschl's gyrus | 41 | 50 | −20 | 6 | 7.0 | |
| L anterior STG | 42 | −52 | −6 | 2 | 8.3 | |
| R anterior STG | 42 | 52 | −2 | 0 | 7.1 | |
| BOLD Decreases | R precuneus | 7 | 10 | −78 | 50 | −5.0 |
| R superior occipital gyrus | 19 | 38 | −80 | 34 | −4.7 | |
| Unimodal auditory active− unimodal auditory passive | ||||||
| BOLD Increases | R posterior STS | 21/22 | 56 | −44 | 10 | 6.2 |
| L STG | 22/41 | −50 | −42 | 18 | 5.6 | |
| L posterior STS | 21/22 | −52 | −52 | 6 | 4.7 | |
| BOLD Decreases | R inferior parietal lobe | 39 | 46 | −70 | 24 | −5.1 |
| R precuneus | 31 | 8 | −58 | 18 | −4.8 | |
| Bimodal auditory active− bimodal visual active | ||||||
| BOLD Increases | L mid-STS | 21/22 | −56 | −24 | 0 | 4.2 |
| R mid-STS | 21/22 | 50 | −34 | 2 | 4.2 |
Peaks of increased and decreased BOLD response in three auditory contrasts. The stereotaxic coordinates of the peak of the activation are given according to Talairach/MNI space along with the peak t-value (P < .05, corrected). L, left; R, right; STG, superior temporal gyrus; STS, superior temporal sulcus; BA, Brodmann's Area.
During the unimodal auditory active condition subjects were instructed to attend to the melodies. The contrast, auditory active minus passive, revealed increased BOLD signal in the left planum temporale (STG) as determined from anatomical probability maps (Westbury et al., 1999), and also bilaterally by the superior temporal sulci (STS) (Fig. 4A, middle). The same contrast also showed decreased BOLD signal across areas related to visual processing. Significant negative peaks were noted in the right precuneus, and right inferior parietal lobe (Fig. 4C, middle).
Selectively attending to melodies and ignoring shapes, compared with selectively attending to shapes and ignoring melodies, revealed increased BOLD signal bilaterally in the superior temporal sulcus (Fig. 4A, right). These activations are slightly below the set threshold; however, the results reflect our predictions and occur bilaterally. We selected a peak voxel in both of these regions to investigate the BOLD signal across conditions relative to the silence/blank screen baseline. The analysis showed a trend of decreasing activity with decreasing relevance of the auditory modality (Fig. 4B). In unimodal and bimodal auditory active conditions the BOLD signal is equivalent bilaterally in the STS, yet the BOLD signal response progressively decreases through unimodal auditory passive, bimodal passive and bimodal visual active conditions. Furthermore, activity is equivalent in the silence/blank screen baseline and the unimodal visual passive conditions, but shows a slight decrease in the unimodal visual active condition. Additionally, comparing the BOLD response in those peak voxels with melody memory for each subject revealed a positive correlation in the right STS (r = 0.48, t = 1.73, P = 0.055) but not the left STS (r = −0.03, t = −0.1, P = 0.92). Extracting one outlier with a negative BOLD response in the right STS reveals an even stronger positive correlation between BOLD signal and melody memory (r = 0.79, t = 4.1, P = 0.002).
Sensory Area Modulations in Visual Conditions
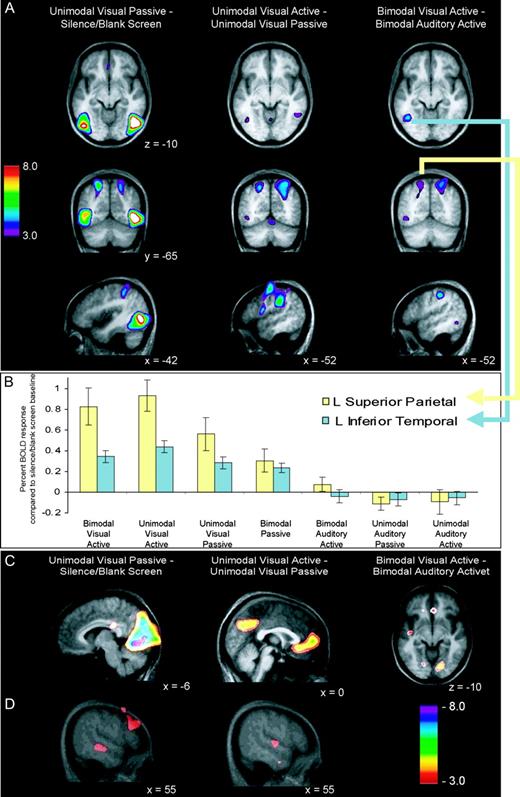
Comparing unimodal visual passive presentation to a silence/blank screen baseline revealed bilaterally increased BOLD signal in the lateral occipital complex and the inferior and superior parietal lobes, as expected (Table 3; Fig. 5A, left). The contrast also revealed decreased BOLD signal in primary and secondary visual areas [Brodmann's area (BA) 17 and 18] (Fig. 5C, left). Additionally, auditory cortices showed subthreshold decreased BOLD signal, with a subthreshold negative peak in the right superior temporal sulcus (Fig. 5D, left).
Visual fMRI results. (A) BOLD response increases across three contrasts. Upper images are horizontal views of the LOC and inferior temporal cortex (z = −10 for all images); middle images are coronal views of the superior parietal cortex (y = −65 for all images); lower images are sagittal views of the left inferior parietal cortex. Visual passive minus baseline (left) shows widespread bilateral visual activity. Visual active minus passive (middle) shows bilateral inferior temporal, superior parietal and inferior parietal peaks. Bimodal visual active minus bimodal auditory active (right) shows left lateralized inferior temporal, bilateral superior parietal, and left lateralize inferior parietal peaks. (B) Trend of decreasing relevance of visual modality (left to right) and decreasing percent BOLD response in two voxels of interest in left inferior temporal and left superior parietal regions. (C) Decreases in BOLD response, within-modality suppression. Visual passive minus baseline (left) shows primary visual decreases; visual active minus passive (middle) demonstrates extrastriate cortex decreases; bimodal visual active minus bimodal auditory active (right) shows secondary visual area decreases. (D) Decreases in BOLD response, crossmodal suppression. Visual passive minus baseline (left) shows decreased activity in the right STS. Unimodal visual active minus passive (right) shows decreased activity in the right STG. See Table 3 for all coordinates. LOC, lateral occipital complex; STS, superior temporal sulcus; STG, superior temporal gyrus.
Visual contrasts
| Contrast | Region of peak | BA | x | y | z | t |
|---|---|---|---|---|---|---|
| Unimodal visual passive− silence/blank screen baseline | ||||||
| BOLD Increases | R lateral occipital complex | 20 | 46 | −68 | −4 | 10.3 |
| L lateral occipital complex | 20 | −42 | −72 | 2 | 8.9 | |
| R inferior parietal | 40 | 44 | −34 | 44 | 6.9 | |
| L inferior parietal | 40 | −40 | −44 | 52 | 5.1 | |
| R superior parietal | 7 | 26 | −54 | 52 | 6.2 | |
| L superior parietal | 7 | −20 | −66 | 54 | 6.1 | |
| BOLD Decreases | L primary visual | 17 | −6 | −76 | −6 | −7.6 |
| R primary visual | 17 | 6 | −76 | −6 | −6.3 | |
| L cuneus | 18 | −6 | −82 | 30 | −7.1 | |
| R cunueus | 18 | 4 | −68 | 14 | −5.6 | |
| R STS | 21/22 | 55 | −29 | −6 | −4.4 | |
| Unimodal visual active− unimodal visual passive | ||||||
| BOLD Increases | L inferior parietal | 40 | −52 | −30 | 30 | 6.2 |
| R inferior parietal | 40 | 48 | −46 | 52 | 5.3 | |
| R superior parietal | 7 | 28 | −66 | 58 | 5.0 | |
| R superior parietal | 7 | 26 | −68 | 40 | 4.9 | |
| L superior parietal | 7 | −18 | −68 | 50 | 5.0 | |
| R inferior temporal | 20 | 53 | −56 | −11 | 3.8 | |
| L inferior temporal | 20 | −44 | −63 | −6 | 3.7 | |
| BOLD Decreases | precuneus | 7 | 0 | −72 | 34 | −5.3 |
| orbitofrontal cortex | 11 | 12 | 28 | −8 | −5.2 | |
| precuneus | 7 | 0 | −52 | 36 | −5.1 | |
| R anterior STG | 42 | 51 | −13 | 3 | −3.9 | |
| R Heschl's gyrus | 41 | 42 | −21 | 11 | −3.6 | |
| Bimodal visual active− bimodal auditory active | ||||||
| BOLD Increases | L inferior temporal | 37 | −42 | −58 | −8 | 5.2 |
| R superior parietal | 7 | 24 | −60 | 56 | 4.75 | |
| L superior parietal | 7 | −16 | −69 | 54 | 4.2 | |
| L inferior parietal | 40 | −50 | −30 | 46 | 5.5 | |
| BOLD Decreases | R secondary visual | 18 | 16 | −78 | −10 | −5.2 |
| L secondary visual | 18 | −17 | −73 | −6 | −3.7 |
Peaks of increased and decreased BOLD response in three visual contrasts. The stereotaxic coordinates of the peak of the activation are given according to Talairach/ MNI space, along with the peak t-value (P < .05, corrected). L, left; R, right; STS, superior temporal sulcus; STG, superior temporal gyrus; BA Brodmann's area.
The contrast between unimodal visual active and passive conditions showed increased BOLD signal bilaterally in the inferior and superior parietal cortices, with subthreshold increases bilaterally in inferior temporal cortices (Fig. 5A, middle). The same contrast also showed decreased BOLD signal in early visual areas, including the precuneus (Fig. 5C, middle). Additionally, the contrast showed decreased BOLD signal in the right primary auditory area as determined from an anatomical probability map (Penhune et al., 1996), and in the right anterior STG (Fig. 5D, middle).
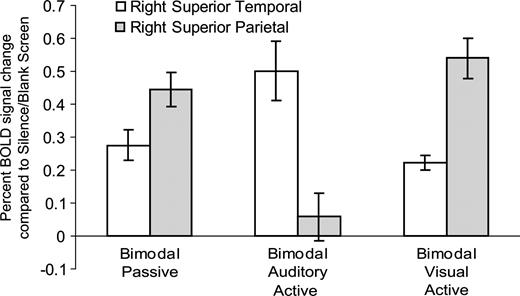
Selectively attending to shapes and ignoring melodies, compared with selectively attending to melodies and ignoring shapes, showed increased BOLD signal bilaterally in the superior parietal lobe, and left lateralized in the inferior temporal and inferior parietal cortices (Fig. 5A, right). Additionally, a large area of decreased BOLD signal was noticed in early visual areas, particularly in secondary areas (BA 18) lateral to primary cortex (Fig. 5C, right). Analogous to the trend noticed in the auditory cortices, the BOLD signal decreased in visual cortices as the relevance of the visual modality decreased (Fig. 5B). We selected a peak voxel in both the left superior parietal and inferior temporal regions to investigate this trend. In unimodal and bimodal visual active conditions, the relative BOLD signal was highest. The BOLD response progressively decreased through unimodal visual passive and bimodal passive conditions. In the bimodal auditory active condition the BOLD signal was near silence/blank screen baseline. Finally, activity was slightly suppressed compared with the silence/blank screen baseline in the unimodal auditory passive and unimodal visual active conditions. Figure 6 shows the BOLD signal in a peak voxel of both the right superior temporal and right superior parietal regions. These voxels of interest were chosen to demonstrate the interaction between auditory and visual cortices as a function of attention during bimodal conditions.
Interaction between attention condition and percent BOLD signal change in peak voxels of the right superior parietal lobe (x = 24 y = −60 z = 56) and right superior temporal sulcus (STS) (x = 50 y = −34 z = 2). BOLD signal increased in the right STS and decreased in the right superior parietal lobe from bimodal passive to bimodal auditory active conditions. BOLD signal decreased slightly in the right STS and increased in the right superior parietal lobe from bimodal passive to bimodal visual active conditions. Data reported as means ± SE.
Additional Findings
To determine if bimodal presentation of the stimuli led to a superadditive response in sensory cortices, we performed the following contrast (cf. Calvert, 2001): [bimodal passive – baseline] – [(auditory passive – baseline) + (visual passive – baseline)]. Activation of sensory cortices was nearly equivalent in the comparison. Significant differences included a greater deactivation in the combined unimodal conditions of the early visual cortices including BA 18 (x = 0 y = −84 z = 20, t = 5.4) and the left lingual gyrus (BA 18/19 x = −14 y = −64 z = 4, t = 5.9).
In the comparison of active and passive unimodal conditions, the continuous response task, which involved a mouse button press, recruited left supplementary, left pre-motor and left primary motor cortices, as tapping was executed with the right hand (Table 4). Additionally, areas within the frontal cortices showed increased BOLD response during active conditions compared with passive (Table 4). While motor and supramodal area activations were expected due to the demands of the continuous response task, they are not the focus of this study. Furthermore, in bimodal active conditions, it is likely that both the continuous response task and the selective attention task would have recruited these motor and supramodal areas. The interaction between these two tasks likely prevented the isolation of heteromodal areas specifically recruited for the bimodal selective attention task.
Additional findings
| Contrast | Region of peak | BA | x | y | z | t |
|---|---|---|---|---|---|---|
| Unimodal auditory active− unimodal auditory passive | ||||||
| BOLD Increases | L SMA | 6 | −6 | 2 | 46 | 6.5 |
| R precentral gyrus | 6 | 40 | −2 | 40 | 5.1 | |
| L precentral gyrus | 6 | −54 | 4 | 16 | 5.0 | |
| L postcentral gyrus | 4 | −44 | −12 | 52 | 5.0 | |
| L inferior frontal gyrus | 44 | −46 | 4 | 4 | 4.7 | |
| BOLD Decreases | frontopolar | 10 | −10 | 46 | −6 | −5.3 |
| Unimodal visual passive− silence/blank screen baseline | ||||||
| BOLD Increases | R precentral gyrus | 6 | 26 | −14 | 54 | 7.3 |
| R precentral gyrus | 6 | −24 | −16 | 56 | 6.8 | |
| R precentral gyrus | 6 | 56 | 2 | 34 | 5.6 | |
| L precentral gyrus | 6 | −54 | 0 | 38 | 5.1 | |
| BOLD Decreases | R inferior frontal gyrus | 45/47 | 42 | 24 | −2 | −5.0 |
| Unimodal visual active− unimodal visual passive | ||||||
| BOLD Increases | L postcentral gyrus | 4 | −32 | −14 | 54 | 6.9 |
| L SMA | 6 | −4 | −2 | 56 | 6.8 | |
| L insula | – | −34 | 12 | 12 | 6.3 | |
| L pulvinar of thalamus | – | −14 | −22 | 10 | 6.0 | |
| L putamen | – | 22 | 10 | 8 | 5.8 | |
| L precentral gyrus | 6 | −44 | 4 | 10 | 5.8 | |
| L precentral gyrus | 6 | −50 | 2 | 16 | 5.0 | |
| R inferior frontal gyrus | 45/47 | 46 | 18 | 2 | 4.9 | |
| BOLD Decreases | L DLPFC | 9/46 | −14 | 60 | 20 | −5.2 |
| medial prefrontal cortex | 10 | 0 | 54 | 4 | −5.3 | |
| Bimodal visual active− bimodal auditory active | ||||||
| BOLD Increases | R postcentral gyrus | 4 | 24 | −6 | 56 | 5.9 |
| L postcentral gyrus | 4 | −24 | −10 | 58 | 5.7 | |
| L pulvinar of thalamus | – | −16 | −22 | 10 | 5.0 |
Peaks of increased and decreased BOLD response in areas outside of auditory and visual sensory cortices. The stereotaxic coordinates of the peak of the activation are given according to Talairach/MNI space along with the peak t-value (P < .05, corrected). L, left; R, right; SMA, supplementary motor area; DLPFC, dorsolateral prefrontal cortex; BA, Brodmann Area.
Discussion
Cognitive Effects of Attention
While continuous response task accuracy was better in unimodal conditions in the behavioral study, and better in bimodal conditions in the fMRI study, the near-ceiling performance overall suggests that subjects were effectively monitoring for perceptual changes in the instructed modality. The high performance suggests subjects attended to the instructed modality, but could also suggest that the task was too easy, thereby leaving extra capacity to process the to-be-ignored stimuli in the bimodal active conditions. To resolve this question, we included an additional dependent measure of recognition memory for to-be-attended and to-be-ignored stimuli. The memory results of both experiments showed subjects could attend to a behaviorally relevant modality but were unable to attend fully to the irrelevant modality. Therefore, attentional instruction altered encoding of information and subsequent memory for that information. The analogous results in the two experiments validate this paradigm.
Modulations of Activity in Auditory Cortices Due to Attention
Passively listening to the novel melodies led to widespread bilateral activation of primary and secondary auditory areas, including Heschl's gyri and portions of the planum temporale — areas known to be recruited for processing complex auditory information such as music (Zatorre et al., 2002). While stimulus presentation in the unimodal auditory active and passive conditions was identical, the addition of the attention instruction led to bilateral increases in posterior areas of the superior temporal sulci (STS) and a left lateralized increase in a posterior part of the superior temporal gyrus. Moreover, the instruction to selectively attend to melodies and ignore shapes revealed activations in the STS when compared with conditions of equivalent stimulus presentation (bimodal passive and bimodal visual active conditions).
Others have reported increased activation and additional recruitment of auditory cortices due to attention. For example, covert target detection among aurally presented words compared with a no search condition led to increased activity in, and broader recruitment of, secondary auditory areas (Grady et al., 1997). Increased activity in both primary and secondary auditory areas occurred during detection of targets among single spoken syllables compared with an attentive listening condition (Jäncke et al., 1999). In our study, primary auditory area activation did not vary with attention. Jäncke et al. (1999) suggest that the simple nature of their stimuli may have led to primary area modulations under the assumption that primary cortices predominantly process basic stimulus features, while secondary cortices are largely responsible for more complex feature processing. The active condition in our experiment likely required additional higher-order processing compared with the passive condition, thereby recruiting and activating more posterior secondary auditory cortices. For example, the upper banks of the posterior STS were recruited during the unimodal active condition and the upper banks of the mid-STS were recruited during the bimodal auditory active condition. The exact functional role of these secondary auditory regions, lateral and dorsal to the primary auditory cortex, is still under debate. One model of auditory processing, based on the visual model of ventral and dorsal processing streams, suggests that areas dorsal and posterior to the primary auditory cortex are part of a stream that processes spatial features of acoustic information (Rauschecker, 1998; Rauschecker and Tian, 2000), while areas ventral and anterior to the primary auditory cortex are part of a stream that processes object features of acoustic information (Zatorre et al., 2004). Another model (Zatorre and Belin, 2005) proposes that areas lateral and posterior to Heschl's gyri along the STG and the upper bank of the STS are important for auditory pattern processing. In our study, active conditions required encoding of melodies for a subsequent memory test. The most salient cue for distinguishing one melody from another in the memory test was the melodic pattern. Since active conditions led to increased activity in posterolateral auditory regions, we conclude that these areas were best suited for processing the melodic pattern in accord with the latter model.
Modulations of Activity in Visual Cortices Due to Attention
Passively viewing abstract shapes led to the expected activation of the ventral and dorsal visual streams. The ventral stream is traditionally viewed as processing the identity of visual information for recognition, while the dorsal stream processes spatial features (Mishkin et al., 1983; Haxby et al., 1994). In this study, we suggest that the overall form of the shape engaged the ventral stream, while the presentation of the line segments over time and in a cascade of spatial locations probably required visuospatial processing and recruited the dorsal stream. Others have shown form processing to require ventral areas of the visual system. For example, in an fMRI adaptation paradigm, the lateral occipital complex showed decreased response with repeated presentation of visual objects, suggesting this area is sensitive to visual form (Grill-Spector et al., 1999). In an fMRI study of healthy normals, fully formed objects activated regions of the ventral stream to a greater extent than scrambled images (James et al., 2003). The dorsal stream, on the other hand, is often required for shifts of visuospatial attention. Such shifts, similar to those required with the presentation of the line segments in our paradigm, have previously been found to engage the parietal cortex (Corbetta et al., 1993; Coull and Frith, 1998; Ng et al., 2000).
While stimulus presentation in the unimodal visual active and passive conditions was identical, the addition of the attention instruction led to increased activation of higher-level visual cortices, particularly within the superior and inferior parietal lobes bilaterally. Bilateral inferior temporal cortical increases in activity were also noticed, but were of lower magnitude. Moreover, the instruction to selectively attend to shapes and ignore melodies revealed activations in the parietal and inferior temporal cortices when compared with conditions of equivalent stimulus presentation (bimodal passive and bimodal auditory active conditions).
Attention to visual stimuli increases cortical response not only in primary visual cortex (for a review, see Treue, 2003) but also in later visual areas, such as in area V4 in monkeys when contrasting an easy and a difficult task (Spitzer et al., 1988) and in the middle temporal and ventral intraparietal areas (Cook et al., 2002). These cortical changes likely occur in areas best suited for the requirements of the task and may lead to suppression of activity in areas not related to the task. For example, attention to a particular location enhanced response in a particular portion of the visual system, but also suppressed activity in other areas of the visual cortices (Smith et al., 2000). In our paradigm, higher-level visual areas were likely recruited due to the task demands of our paradigm, while early visual areas showed suppressed activity. In fact, bilateral deactivation of early visual cortices was noticed in the passive condition, but was even greater in the active conditions, countering the traditional view that virtually all visual processing requires the activation of early visual cortex. It is known that nearly all feed-forward visual projections from low- to high-level visual areas are accompanied by feedback projections from high- to low-level visual areas. These feedback projections may be operating to either increase or decrease activity in early visual cortices. For example, a second enhanced activation of V1, following an initial V1 response and late visual area response, was found using event-related potentials (Noesselt et al., 2002). They concluded that later areas sent feedback to primary areas to enhance processing at that earlier stage. Deactivation of early visual cortices with activation of higher-level visual areas has also been demonstrated. Murray et al. (2002) showed this using a shape perception task and suggested that higher-level areas accomplished the goals of processing and thereby projected signals of inhibition back to the lower levels. Other researchers have reported fast feedback mechanisms in the visual system from MT to V1 (Pascual-Leone and Walsh, 2001), in opposition to the traditional view that visual cortices are a predominantly feed-forward system. In our study, greater deactivation of early visual cortices during the active than the passive condition suggests that attention can modulate this interaction between early and late visual cortices.
Interaction of the Auditory and Visual Systems: Unimodal Presentation
Overall, attention to unimodally presented melodies increased activity in secondary auditory areas, while attention to unimodally presented shapes increased activity in higher-level visual areas while decreasing activity in lower-level visual areas. In addition, BOLD signal decreased in sensory cortices subserving the non-presented modality in both unimodal conditions. In unimodal auditory conditions, BOLD signal decreased in primary and secondary visual areas, while in unimodal visual conditions BOLD signal decreased in primary and secondary auditory areas. These results demonstrate crossmodal inhibition between the visual and auditory cortices. This effect has been demonstrated by others (Haxby et al., 1994) but is inconsistently demonstrated across studies presenting only one modality (for a review, see Shulman et al., 1997). This may be due to insufficient baseline measures and the tendency for researchers to look for increases rather than decreases in activity (Laurienti et al., 2002). The effect, in our study, was larger in the auditory cortices with visual presentation than in the visual cortices with auditory presentation. Although areas of peak increased and decreased BOLD signal did not directly correspond, portions of the regions overlapped and were in the same vicinities, results corroborating those of Laurienti et al. (2002). Overall, the results suggest that even under unimodal conditions, the auditory and visual systems do not necessarily operate in isolation; instead, the systems exert mutual influences.
Interaction of the Auditory and Visual Systems: Bimodal Presentation
Complementary bimodal information, such as moving lips and speech sounds, can be integrated into a unitary percept. Compared with unimodal presentation of the visual and auditory components separately, bimodal presentation of complementary information often leads to more effective perceptual identification and a superadditive response in sensory cortices subserving the component modalities (Calvert et al., 1999, 2000; Molholm et al., 2004). However, when bimodal information is not complementary but presented simultaneously, such as listening to white noise and viewing a checkerboard with congruent onset and offset times, no such superadditive response is achieved (Laurienti et al., 2002). In the current study, the lack of a superadditive response when comparing unimodal passive conditions to the bimodal passive condition suggests that people were indeed treating the melodies and shapes as non-complementary, unrelated events, as intended given their asynchronous presentation.
In bimodal active conditions, attention was directed to one of two unrelated events. A memory test confirmed selective attention: to-be-attended stimuli were remembered significantly better than to-be-ignored stimuli. In bimodal active conditions, BOLD signal in sensory cortices subserving the attended modality was equal to the responses in the unimodal active condition, yet concurrent activity in sensory cortices subserving the unattended modality was significantly less. For example, in the bimodal auditory active condition compared with the bimodal passive condition, BOLD signal decreased in visual cortices. Similarly, selective attention to shapes led to decreased BOLD signal in auditory cortices. Overall, stimulus presentation was identical in the bimodal passive and bimodal active conditions, yet selectively attending to one modality led to increased activity in cortices subserving that modality and decreased BOLD response in areas subserving the ignored modality. The suppression of activity in sensory cortices subserving the to-be-ignored modality likely interrupts processing of the to-be-ignored input. This may facilitate the processing of to-be-attended information. The coupling of the enhancement in cortices subserving the attended and suppression in cortices subserving the ignored stimuli seems linked to the memory behavior we observed. Indeed, in the case of the melodic stimuli, memory recall was significantly correlated with STS BOLD activity. These pieces of evidence taken together show that the top-down influence of attentional instruction can effect changes in activity at the level of the sensory cortices and subsequently alter memory traces for attended and unattended information.
Traditionally, the auditory and visual sensory cortices were not only thought to operate in isolation of one another, but few, if any, cortico-cortical projections were thought to exist between them. Recent research using retrograde tracers in monkeys showed the existence of projections between peripheral primary visual cortices and auditory primary and secondary areas (Falchier et al., 2002). While primary visual cortical response in our study was modulated by attention instruction, primary auditory cortical response was largely independent of attention instruction. The complex nature of our stimuli may account for the majority of modulations due to attention occurring at higher-level sensory areas. It may be possible, although speculative, that connections between primary auditory and visual areas drive the higher-level interactions we witnessed in our study. However, little evidence of direct projections between the auditory and visual sensory cortices exists, and therefore crossmodal interactions are also likely mediated by supramodal areas, such as the dorsolateral prefrontal cortex, cingulate cortex, parietal lobe and temporoparietal junction (Pashler, 1998; Corbetta and Shulman, 2002). The implication of supramodal areas as necessary for attention is based largely on vigilance paradigms, in which the detection of changes to simple stimuli across modalities is required. Our study was not sensitive to supramodal areas specifically recruited for bimodal attention, most likely because the cortices activated during the continuous response task overlapped with those expected during bimodal selective attention. Sustained attention to complex crossmodal stimuli, as is required in our paradigm, may recruit similar neural substrates as those witnessed in simple vigilance paradigms but this hypothesis needs testing. A recent study of bimodal selective attention showed increased activity in posterior parietal and superior frontal cortices when shifting attention between modalities (Shomstein and Yantis, 2004). Additionally, the pattern of modulation they found in sensory cortices was similar to our findings, supporting our conclusions. However, as mentioned of other studies in the introduction (Woodruff et al., 1996; O'Leary et al., 1997; Petkov et al., 2004), their paradigm included no behavioral index for ignored stimuli, and attention conditions were compared with each other rather than with baseline conditions.
Conclusions
Overall, the results show that increasing the behavioral relevance of a modality via an attentional instruction increases recruitment of sensory cortices subserving that modality, while decreasing the relevance of a modality decreases the response in those sensory cortices regardless of unimodal or bimodal presentation. We suggest that crossmodal attentional effects are mediated by gating of sensory input through modulation of sensory cortical areas. This modulation enhances processing of one modality at the expense of the other, and affects memory encoding.
We thank M. Bouffard and P. Ahad for their technical expertise, and the personnel of the McConnell Brain Imaging Center for their assistance. Supported by a grant from the Canadian Institutes for Health Research.
References
Alho K, Medvedev SV, Pakhomov SV, Roudas MS, Tervaniemi M, Reinikainen K, Zeffiro T, Näätänen R (
Barrett NA, Large MM, Smith GL, Karayanidis F, Michie PT, Kavanagh DJ, Fawdry R, Henderson D, O'Sullivan BT (
Belin P, Zatorre RJ, Hoge R, Evans AC, Pike B (
Broadbent, DE (
Calvert GA (
Calvert GA, Campbell R, Brammer MJ (
Calvert GA, Brammer MJ, Bullmore ET, Campbell R, Iverson SD, David A (
Collins D, Neelin P, Peters T, Evans A (
Cook EP, Maunsell JHR (
Corbetta M, Shulman GL (
Corbetta M, Miezin FM, Dobmeyer S, Shulman GL, Peterson SE (
Corbetta M, Miezin FM, Shulman GL, Petersen SE (
Coull JT, Frith CD (
Craik FIM, Lockhart RS (
D'Esposito M, Detre JA, Alsop DC, Shin RK, Atlas S, Grossman M (
Downar J, Crawley AP, Mikulis DJ, Davis KD (
Duncan J, Martens S, Ward R (
Falchier, A, Clavagnier S, Barone P, Kennedy H (
Faw B (
Grady CL, Van Meter JW, Maisog JM, Pietrini P, Krasuski J, Rauschecker JP (
Grill-Spector K, Kushnir T, Edelman S, Avidan G, Itzchak Y, Malach R (
Haxby JV, Horwitz B, Ungerleider LG, Maisog JM, Pietrini P, Grady C (
James TW, Culham J, Humphrey K, Milner AD, Goodale MA (
Jäncke L, Mirzazade S, Shah NJ (
Jäncke L, Buchanan TW, Lutz K, Shah NJ (
Kaster S, De Weerd P, Desimone R, Ungerleider LG (
Laurienti PJ, Burdette JH, Wallace MT, Yen Y, Field AS, Stein BE (
Lavie N (
Lewis JW, Beauchamp MS, DeYoe EA (
Liu T, Slotnick SD, Serences JT, Yantis S (
Mishkin M, Ungerleider LG, Macko KA (
Molholm S, Ritter W, Javitt DC, Foe JJ (
Murray SO, Kersten D, Olshausen BA, Schrater P, Woods DL (
Ng VWK, Eslinger PJ, Williams SCR, Brammer MJ, Bullmore ET, Andrew CM, Suckling J, Morris RG, Benton AL (
Noesselt T, Hillyard SA, Woldorff MG, Schoenfeld A, Hagner T, Jänke L, Templemann C, Hinrichs H, Heinze H (
O'Craven KM, Downing PE, Kanwisher N (
O'Leary DS, Andreasen NC, Hurtig RR, Torres IJ, Flashman LA, Kesler ML, Arndt SV, Cizadlo TJ, Ponto LLB, Watkins GL, Hichwa RD (
Pascual-Leone A, Walsh V (
Penhune VB, Zatorre RJ, MacDonald JD, Evans AC (
Petkov CI, Kang X, Alho K, Bertrand O, Yund EW, Woods DL (
Rauschecker JP, Tian B (
Rees G, Frith C, Lavie N (
Shomstein S, Yantis S (
Shulman GL, Corbetta M, Buckner RL, Raichle ME, Fiez JA, Miezin FM, Peterson SE (
Smith AT, Singh KD, Greenlee MW (
Spitzer H, Desimone R, Moran J (
Treue S (
Treisman A (
Treisman A, Davies A (
Tulving E, Lindsay PH (
Westbury CF, Zatorre RJ, Evans AC (
Woodruff P, Benson R, Bandettini P, Kwong K, Howard R, Talavage T, Belliveau J, Rosen B (
Worsley KJ, Liao CH, Aston J, Petre V, Duncan GH, Morales F, Evans AC (
Zatorre RJ, Belin P (
Zatorre RJ, Mondor TA, Evans AC (
Zatorre RJ, Belin P, Penhune VB (