


Abstract
In the present study, we aimed to investigate the effects of repetitive transcranial magnetic stimulation (rTMS) on memory performance and brain activity in elders presenting with subjective memory complaints and a memory performance within the low normal range. Forty participants underwent 2 functional magnetic resonance imaging (fMRI) sessions, in which they were administered 2 equivalent face–name memory tasks. Following each fMRI, subjects were asked to pair faces with their corresponding proper name. In-between, high-frequency rTMS was applied randomly using real or sham stimulation in a double-blind design. Only subjects who received active rTMS improved in associative memory significantly. This was accompanied by additional recruitment of right prefrontal and bilaterial posterior cortical regions at the second fMRI session, relative to baseline scanning. Our findings reflect a potentiality of rTMS to recruit compensatory networks, which participate during the memory-encoding process. Present results represent the first evidence that rTMS is capable of transitorily and positively influencing brain function and cognition among elders with memory complaints.
Introduction
Transcranial magnetic stimulation (TMS) is a noninvasive technique, which delivers magnetic pulses reaching the cerebral cortex through the scalp. It is generally accepted that high-frequency (>1 Hz) repetitive transcranial magnetic stimulation (rTMS) induces an increase in cortical excitability, whereas low-frequency (≤1 Hz) rTMS reduces it (Pascual-Leone and others 1994; Chen 2000; Gorsler and others 2003), although these assumptions have been challenged by recent neuroimaging studies in nonmotor areas investigating functional connectivity (Speer and others 2000). Previous studies have demonstrated that rTMS is able to modulate the activity of a particular cortical region, resulting in transsynaptic effects on other distant areas (Paus and others 1997). Furthermore, applying rTMS simultaneously with functional imaging techniques allows the study of brain-behavior relationship (Mottaghy and others 2000, 2003; Sack and Linden 2003). The potential effects of rTMS in modulating human cognitive functions, including memory, have been manifested in a number of studies (Grafman and Wassermann 1999; Pascual-Leone and others 1999, 2000; Jahanshahi and Rothwell 2000). In this regard, most published reports showed interferences on neuropsychological performance, but recent evidence is now available indicating a positive effect of rTMS on several cognitive domains, such as short-term memory (Pascual-Leone and others 1993; Wassermann and others 1996), analogic reasoning (Boroojerdi and others 2001), picture naming (Topper and others 1998; Mottaghy and others 1999), and language identification tasks (Andoh and others 2005). Whereas these findings have been mainly described in young and healthy subjects, little is known about the putative cognitive effects of rTMS in the elder population. Nonetheless, in a study by Moser and others (2002), a beneficial effect of high-frequency rTMS was observed in executive function among depressive adults with a mean age of 60 years.
In the present report, we sought to investigate whether the above-mentioned positive effects of rTMS can also be observed in a group of otherwise healthy elders presenting with subjective memory complaints and low memory performance. Should these effects be evidenced in a memory task, a second aim was to determine if such cognitive improvement was accompanied by concomitant changes in brain activity measured by functional magnetic resonance imaging (fMRI).
Materials and Methods
Subjects
Forty adults with memory complaints enduring at least 1 year and above 50 years of age were recruited from 2 health centers and 1 hospital in Barcelona. Participants did not meet criteria for dementia according to Diagnostic and Statistical Manual fourth edition criteria and a neuropsychological assessment, including measures of global cognitive function (mini-mental state examination ≥ 24), language (Token test, Boston Naming Test), praxis (imitation and performance to command), gnosis (Poppelreuter's embedded figures and Luria's watches), and abstract reasoning (Wechsler Adults Intelligence Scale III Similarities subtest). None of the participants suffered from other psychiatric or neurological disease based on medical evaluation. Moreover, possible cases of clinically depressive mood were ruled out through a Hamilton Depression Scale cutoff score of 15. Besides memory complaints and normal performance in the remaining cognitive areas, our subjects exhibited a performance in the low normal range (−1 standard deviation [SD] below standardized age-matched norms) in at least one of the following secondary memory tests: Rey Auditory Verbal Learning Test, Visual Reproduction (Wechsler Memory Scale Revised), or Benton Visual Retention Test.
Magnetic Resonance Imaging Acquisition
Scans were obtained on a GE Signa 1.5T (General Electric, Milwaukee, Wisconsin). High-resolution T1-weighted images were acquired for anatomical identification with a Fast Spoiled Gradient-Recalled Echo three-dimensional sequence (Digital Imaging and Communications in Medicine) format: Repetition time [TR]/Echo time [TE] = 12/5.2, Inversion time = 300, Number of Exitations = 1, FOV = 24 × 24 cm, 256 × 256 matrix). Whole-brain volumes were acquired in an axial plane yielding contiguous slices with slice thickness of 1.5 mm. Functional images were acquired using a T2*-weighted gradient echo planar imaging (TR = 2000 ms, TE = 40 ms, FOV = 24 × 24 cm, flip angle of 90°). Twenty axial slices were obtained for each brain volume with a slice thickness of 5 mm and a gap of 1.5 mm.
Baseline fMRI Session and Memory Assessment
We used a 10-block design task with alternating “repeated” and “experimental” conditions (5 blocks each). The whole experiment had a duration of 300 s (30 s per block). The task started with a repeated block, which consisted of the presentation of 2 face–name pairs that were learned before the fMRI session. These 2 stimuli were presented five times each in an alternating way (presentation time: 2 s and interstimuli period: 1 s). Following this block, participants were presented 10 face–name pairs previously unfamiliar to the subjects (experimental block). The presentation time and interstimuli period for these 10 stimuli were equivalent to those presented during the repeated block. The same repeated and experimental blocks were thereafter presented in an alternating way until the total duration of the experiment (10 blocks, 300 s) was reached. During the repeated blocks, subjects were asked to keep their attention on the displayed face–name pairs even though they were already known. On the other hand, in the experimental blocks individuals were given explicit instructions to try to remember which name was associated with which face for later testing. Following the fMRI session, participants were assessed using an associative memory procedure, where they had to match the names and faces given separately. For this purpose, individuals were shown 10 printed photographs as well as 10 written names and were instructed to pair each name with the corresponding face as they remembered from the fMRI session. Only the stimuli used in the experimental blocks were presented during the associative memory task, and thus, only correct/incorrect face–name matches were recorded as responses. The maximum score for this task was 10 (all names correctly matched with the corresponding face).
Repetitive Transcranial Magnetic Stimulation
Individuals were randomly assigned to 2 groups: an active rTMS (n = 20) and a sham rTMS (n = 20). One subject initially belonging to the placebo condition had to be excluded from the whole study due to visual problems that precluded her to accomplish the fMRI task. Hence, the study finally enrolled 39 subjects in a double-blind design, in which neither the participants nor the researcher in charge of the memory assessment knew who received real or sham stimulation.
rTMS was applied using the so-called “off-line” paradigm (Robertson and others 2003) because magnetic pulses were administered during a rest period set between the first and second fMRI examinations. A MAGSTIM SUPER stimulator and a double-cone coil were employed. The intensity of TMS pulses was determined at 80% of motor threshold, which corresponded to the lowest intensity able to elicit a visible twitch of the first dorsal interosseus muscle of the right hand in at least 5 out of 10 trials. For this purpose, the intersection of the double-cone coil was positioned over the left primary motor cortex. For the active rTMS session, it was slightly diverted to the plane of the interhemispheric cissure and moved anteriorly approximately 5 cm to reach the prefrontal cortex.
Ten rTMS trains lasting 10 s each were delivered during a 5-min period at a frequency of 5 Hz. Specifically, every 30 s, subjects were given 10 s of TMS followed by a 20-s rest period. For the sham condition, the coil was positioned tangentially to the head, with its edge resting on the scalp.
Post-rTMS fMRI Session and Memory Assessment
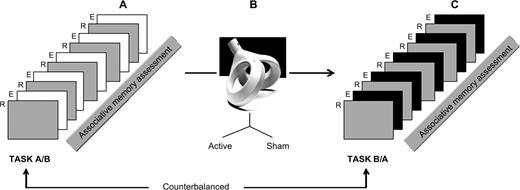
Immediately after the rTMS, patients underwent a second fMRI examination. The time elapsed in-between was in minutes: 10.07 (mean), 2.30 (SD). The characteristics of this second fMRI session were exactly the same as those described earlier for the baseline session with the exception that during the 5 experimental blocks we used 10 new unfamiliar face–name pairs. Once the scanning procedure was finished, participants were retested for associative memory as explained earlier. The order of presentation of the fMRI sessions (baseline and post-rTMS) was counterbalanced across subjects. Figure 1 illustrates the experimental procedure in 3 stages.
Experimental design. (A) Baseline fMRI session: alternating 5 repeated (R) and 5 experimental (E) blocks. The former consisted of the presentation of 2 previously learned face–name pairs, whereas the latter included 10 unfamiliar face–name pairs. This was followed by an associative memory assessment. (B) rTMS session applied either in an active (n = 20) or a sham (n = 19) condition. (C) Post-rTMS fMRI session: the E blocks comprised 10 new unfamiliar face–name pairs, whereas the R blocks remained the same learned items as in the first. fMRI session: the post-rTMS fMRI session was accompanied by a memory assessment analogous to the first one.
Data Analysis
fMRI Data
Images were processed with SPM2 (Statistical Parametric Mapping) running in Matlab 6.5 (MathWorks, www.mathworks.com). Original magnetic resonance images registered in format GE-advanced (1 two-dimensional file per slice) were organized into three-dimensional files (150 volumes per subject) by means of MRICro software (University of Nottingham, UK) and saved in ANALYZE 7.5 format compatible with SPM2. Following alignment along the anterior commissure–posterior commissure line and realignment of the scans to remove the effects of head movement, images were transferred into a standardized coordinate system. Normalized images were smoothed with an isotropic Gaussian kernel (full width half maximum) of 8 mm. Individual analyses were carried out for each subject to evaluate the increased activation observed during the experimental condition compared with that seen during the rest condition. Except when specifically stated, results derived from group analyses were examined at the voxelwise threshold of P < 0.001 (uncorrected for multiple comparisons) and at P < 0.05 threshold on the extent of clusters or with more than 20 contiguous voxels.
Neuropsychological Data
Scores for the associative memory task for different groups and conditions were analyzed using two-way analysis of variance (ANOVA) and Student's t-tests with the statistical program SPSS v.11.5.1.
The study was approved by the local ethics committee, and all the participants gave informed consent for their participation.
Results
Active and sham groups were comparable in terms of age, cognitive status, gender distribution, and educational attainment (Table 1).
Demographic and global cognitive characteristics of the participants
| Active rTMS (n = 20) | Sham rTMS (n = 19) | Statistical values | P values | |
|---|---|---|---|---|
| Age | 66.95 (9.43) | 68.68 (7.78) | t = 0.63 | 0.54 |
| MMSEa | 26.50 (2.06) | 26.16 (1.92) | t = 0.51 | 0.61 |
| Educational attainmentb | 4/12/4/0 | 2/9/7/1 | χ2 = 2.89 | 0.41 |
| Genderc (M/F) | 5/15 | 6/13 | χ2 = 0.21 | 0.65 |
Note: Values are given in mean (SD).
MMSE, mini-mental state examination.
No studies/primary/secondary/superior.
M, male; F, female.
Baseline Whole-Group fMRI Activations
Our analyses at baseline for the entire sample of subjects during the encoding memory condition relative to the resting condition revealed significant activations in several clusters including frontal and parietal regions, visual associative areas, cingulate gyrus, and cerebellum (Table 2). Further, second-level analyses attempting to correlate the behavioral data with patterns of fMRI activity revealed positive correlations (uncorrected P < 0.005) in the right middle frontal gyrus (Brodmann's Area [BA] 45/46, coordinates [x, y, z]: 42, 28, 12; cluster size: 0.24 cm3; t = 3.14, P = 0.002) and bilaterally in parietooccipital regions (BA 7, coordinates: −60, −46, 40; cluster size: 1.24 cm3; t = 3.66, P = 0.001, and BA, 19/40—coordinates: 22, −70, 46; cluster size: 0.37; t = 3.48, P = 0.001).
Brain pattern activation for the whole group (n = 39) during baseline fMRI
| Talairach coordinates [x, y, z] | Region | BA | Volume (cm3) | t Values | P values |
|---|---|---|---|---|---|
| [−36, 16, 24] | Left inferior frontal gyrus | 44, 45 | 26.30 | 6.55 | <0.001 |
| [−38, −76, −12] | Left cerebellum | — | 5.86 | 6.02 | <0.001 |
| [42, −50, −16] | Right fusiform gyrus | 17 | 3.86 | 5.64 | <0.001 |
| [36, −14, 26] | Right supramarginal gyrus | 40 | 4.06 | 5.51 | <0.001 |
| [−24, −66, 40] | Left superior occipital gyrus | 19 | 4.74 | 5.29 | <0.001 |
| [−2, 8, 46] | Left cingulate gyrus | 24 | 2.46 | 4.58 | <0.001 |
| [36, 16, 24] | Right middle/inferior frontal gyrus | 6, 44 | 1.07 | 4.57 | 0.02 |
Effects of rTMS on Memory Performance
No major side effects of rTMS administration including seizures were reported by any patient. Associative memory scores did not differ between active and sham groups for both sessions (baseline associative memory: t = 0.88, df = 37, P = 0.39; post-rTMS examination: t = 1.45, df = 37, P = 0.14). Interaction between rTMS conditions (active vs. sham) and pre- versus postmemory performance was tested by a two-way repeated-measures ANOVA. A significant interaction between both factors was seen, evidencing that pre- and postmemory performance was different across rTMS groups (F = 7.15, df = 1, P = 0.01). To investigate a possible amelioration in the active group relative to the sham condition, a t-test for independent samples was conducted on a new variable (rate of change), which was created by subtracting the value of the associative memory task achieved in the first assessment from the score obtained in the second memory task. Significant differences in the t-test showed that the active group improved as compared with the sham condition, as reflected by positive values in the rate of change variable in the former (Table 3). Even though the mean value of the new created variable was slightly negative for the placebo condition (indicating better performance in the first memory evaluation), a related-samples t-test revealed no statistical differences in the 2 time evaluations (t = −1.39, df = 18, P = 0.18).
Associative memory task performance for the active and sham groups before and after rTMS as well as the rate of change between the 2 assessments
| Associative memory at baselinea | Associative memory at follow-upa | Rate of change (improvement)a | Confidence interval 95% | t Values | P values | |
|---|---|---|---|---|---|---|
| Active rTMS (n = 20) | 4.15 (2.94) | 5.75 (2.99) | 1.60 (3.08) | 0.16–3.04 | ||
| Sham rTMS (n = 19) | 5.00 (3.11) | 4.37 (2.97) | −0.63 (1.98) | −1.58–0.32 | −2.67b | 0.01 |
Mean (SD). Rate of change variable (improvement) reflects follow-up minus baseline associative memory. Positive values (active group) indicate increased memory performance at the second memory evaluation.
t-Test for independent samples conducted for the improvement variable showing significant amelioration in the associative memory task following real rTMS group compared with the sham condition.
rTMS Effects on Brain Activity
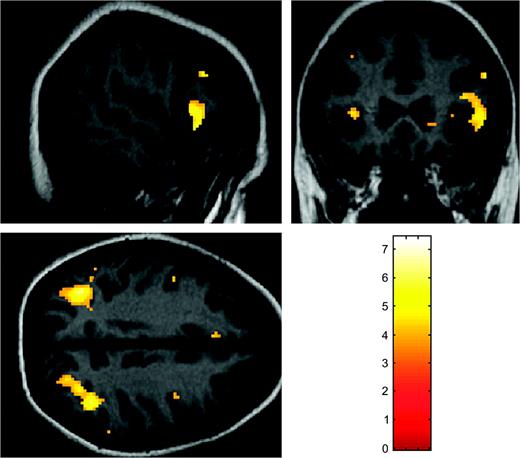
Brain activation patterns were not different when comparing active and sham groups at baseline examination. However, the comparison between both groups at follow-up did show significant changes in terms of higher activation among the active group in the left anterior cingulate (BA 24—Talairach coordinates [x, y, z]: −6, 30, 34; cluster size: 3.07 cm3; t = 4.73, P = 0.001) and right middle and superior frontal gyrus (BA 9—Talairach coordinates [x, y, z]: 42, 10, 38; cluster size: 0.84 cm3; t = 4.00, P = 0.03). To address whether the brain activity in the active group was different from that of the placebo condition across the 2 fMRI sessions, a mixed ANOVA was conducted with rTMS condition as the intersubject factor and fMRI session as the intrasubject factor. This analysis showed a significant interaction affecting the right middle frontal gyrus (BA 8—Talairach coordinates [x, y, z]: 36, 36, 40; cluster size: 2.04 cm3; F = 15.18, P < 0.001) and the right medial frontal lobe (BA 8—Talairach coordinates [x, y, z]: 6, 28, 44; cluster size: 1.48 cm3; F = 14.36, P < 0.001). To further investigate the direction of the interaction, subsequent two-sample t-tests were undertaken. A first analysis showed that when contrasting the active group across the 2 fMRI sessions, the right inferior and middle frontal gyri together with middle and superior occipital gyri were additionally activated in the second fMRI acquisition (Fig. 2 and Table 4). These data indicate that such changes are rTMS related because no significant modifications could be evidenced within the group of subjects receiving sham stimulation.
Images depict increased brain activation following rTMS relative to baseline within the active group (for precise anatomical localization of the significant regions, see Table 4).
Brain regions significantly activated among the active group following rTMS session, relative to baseline
| Talairach coordinates [x, y, z] | Region | BA | Volume (cm3) | t Values | P values |
|---|---|---|---|---|---|
| [−36, −62, 34] | Left middle/superior occipital gyrus | 39, 19 | 3.64 | 7.40 | <0.001 |
| [38, −52, 40] | Right superior occipital gyrus | 19 | 3.07 | 6.01 | <0.001 |
| [52, 20, −4] | Right inferior frontal gyrus | 45, 47 | 2.11 | 5.99 | <0.001 |
| [42, 40, 14] | Right middle frontal gyrus | 46 | 1.05 | 5.12 | 0.001 |
Discussion
To our knowledge, the present study provides first evidence of rTMS ability to induce transient ameliorations in associative memory assessed immediately after stimulation as well as measurable concurrent cerebral changes among elders with memory complaints and low performance in neuropsychological tests of secondary memory. Present results are in line with several studies now available demonstrating cognitive enhancement during (Mottaghy and others 1999; Boroojerdi and others 2001; Cappa and others 2002; Andoh and others 2005) and after rTMS administration (Pascual-Leone and others 1993; Hilgetag and others 2001; Moser and others 2002; Brighina and others 2003).
Using a face–name learning task, we obtained a whole-group activation pattern including the fusiform and cingulate gyri as well as the inferior parietal lobe, which is in accordance with previous findings using a similar task on healthy elder subjects, individuals with mild cognitive impairment, and mild Alzheimer's disease patients (Sperling and others 2003). Additional brain areas such as the inferior frontal lobe and secondary visual areas have also been related to learning of faces in healthy young subjects (Sperling and others 2001, 2003). Face perception involves recruitment of multiple and bilateral cerebral regions, including the extrastriate cortices (Haxby and others 2000). Likewise, secondary visual regions have been seen highly activated in a series of studies employing picture-encoding tasks (Grady and others 1999; Reber and others 2002). Accordingly, our results evidencing increased blood oxygen level dependent (BOLD) signal bilaterally in the middle and superior occipital gyri among the active group following rTMS administration suggest that activation of such regions may play a role in successful face encoding and eventual memory performance.
Along with visual areas, other regions that showed contrasted brain response following rTMS between sham and active groups were the left anterior cingulate gyrus and bilateral regions of the dorsolateral prefrontal cortex. Interestingly, supplementary recruitment in the right inferior and middle frontal gyri as well as in the left middle/superior occipital gyrus was observed only in the active group during the second fMRI acquisition. The relevance of these left parietooccipital and right prefrontal regions relative to the memory task is highlighted by our results showing positive correlations between BOLD signal and behavioral measures. Despite these considerations, these latter findings should be interpreted with caution because the statistical threshold had to be lessened to observe significant results. The most probable explanation relates to the fact that BOLD measurements within the scanner reflected brain regions activated during a face–name learning task, whereas behavioral measures were related to an associative memory task. Hence, the weak associations found might be explained by the fact that encoding and retrieval semantic memory tasks might not share the exact neurofunctional correlates (Cabeza and Nyberg 2000; Fletcher and others 2001). Specifically, retrieval of information of face processing seems to rely on more anterior prefrontal areas than those observed in the present study during memory encoding (Ranganath and others 2003). To overcome this limitation, future studies possibly using event-related designs should be able to record direct behavioral responses during the scanning sessions.
Several lines of evidence suggest that the cognitive effect induced by rTMS in our study might be principally mediated by the additional recruitment of right prefrontal regions that were highlighted in our mixed ANOVA model as well as in the paired t-test comparison within the active group. First, encoding of faces and scenes has demonstrated a common area of activation within the right inferior frontal gyrus (Golby and others 2001). Second, studies with aged and young populations demonstrated that increased activity of prefrontal regions during semantic encoding correlated with the likelihood of eventual memory performance (Wagner and others 1998; Grady, McIntosh, and others 2001; Stebbins and others 2002; Gutchess and others 2005). Finally, former studies comparing young and older adults during encoding memory tasks have pointed out a more unilateral prefrontal cortex (PFC) activity in the former ones, but a bilateral pattern in the latter (Backman and others 1997; Grady, Furey, and others 2001; Gutchess and others 2005), which is in accordance with the brain activity pattern observed following rTMS in our active group. The different encoding network proposed for older subjects has been interpreted as compensatory. Consistent with this hypothesis, several studies have demonstrated that a bilateral recruitment of PFC regions is related to facilitation in memory tasks (Reuter-Lorenz and others 2000; Cabeza and others 2002; Rosen and others 2002). Notably, direct evidence of a compensatory role of the right dorsolateral frontal lobe among healthy elders has been recently reported in an rTMS study (Rossi and others 2004).
Despite being encouraging, further research is merited in order to corroborate these results. Of particular interest would be the study of brain-behavior relationships following rTMS in elders without any cognitive dysfunction. To the best of our knowledge, there are no studies of cognitive enhancement following TMS among normal aging, but there is some evidence that memory training within these individuals causes a reliable improvement even in a 2-year follow-up period (Ball and others 2002). Assuming that older adults may be benefited from cognitive rehabilitation and given the positive effects of rTMS found in previous and present report, an intriguing issue for ulterior studies might be to determine to what extent this technique is useful as an add-on instrument in cognitive training programs for this population. Despite these putative potential applications, in its current state, present findings must be interpreted solely as showing experimental evidence of rTMS ability to transiently influence brain function and not as indicating rTMS as a therapeutic tool for subjects with memory complaints and low performance in neuropsychological tests.
Several limitations or specific particularities of the present study influencing the interpretation of results should be considered. First, and regarding the characteristics of our patients, reported results should be set in the proper context. Due to the presence of a continuum of memory impairment from normal aging to dementia (Petersen and others 2001), the problem of a high heterogeneity within our sample might be an important issue to bear in mind. Thus, although setting our memory cutoff to −1 SD below age-matched norms allowed us to exclude normal memory performing elders, we cannot reject the possibility that our sample included a variety of cases ranging from elders showing only mild memory dysfunction to preclinical stages of Alzheimer's disease. Studies in more homogeneous groups are needed to precisely interpret the rTMS effects in distinct elder populations.
Second, previous studies have shown cognitive facilitation after rTMS ranging from minutes up to several days (Pascual-Leone and others 1993; Hilgetag and others 2001; Brighina and others 2003). Notwithstanding, in the current study, we have not assessed the duration of rTMS effects on cognition. There is evidence that with increased number of sessions of rTMS at high frequency, stronger effects on cortical excitability can be observed (Maeda and others 2000). Although speculative, it might occur that increasing cerebral activity from additional rTMS sessions is associated with more significant changes in cognitive performance. This possibility was, however, not addressed in the present report.
Finally, in the present report, we did not use any available neural navigation or frameless stereotaxic device systems as has been performed in recent cognitive studies combining rTMS with functional neuroimaging techniques (e.g., Andoh and others 2005). Thus, despite the coil being placed over the prefrontal region, we were unable to identify the specific anatomical localization of the site of rTMS. In the same line, the coil used in our study probably causes diffuse effects under the stimulated cortex and nearby functionally connected areas (Maccabee and others 1990). These 2 observations prevent from identifying a single cerebral area targeted by rTMS and directly related with the observed cognitive results. Another aspect to bear in mind regarding the double-cone coil relates to its magnetic proprieties. Stimulation elicited by smaller coils, like the figure-of-eight shaped, produces weaker magnetic fields (Weber and Eisen 2002). Conversely, the double-cone coil is considered the best tool for stimulation of deep brain structures up to 3–4 cm in depth (Maccabee and others 1990; Terao and others 1994, 2000) and produces stronger and more distributed magnetic field (Roth and others 2002). These unique characteristics might affect cerebral excitability or transsynaptic connections, resulting in particular cognitive effects. Despite this, we cannot resolve with certainty that there is a relationship between coil characteristics and reported results because they have not been contrasted with alternative coils. In any case, our results encourage further investigations employing the double-cone coil in cognitive studies.
In summary, our study provides a first step evidencing the feasibility of rTMS to transiently improve memory performance with concurrent cerebral changes among elders with memory complaints and performance within the low normal range. Ongoing investigations in homogeneous samples designed to acquire direct correlations between behavioral data and brain activity as well as combining larger amount of rTMS sessions with a neural navigation device adapted to TMS are required to explore in depth the beneficial effects of magnetic stimulation on cognitive aging.
Funding to pay the Open Access publication charges for this article was provided by the Spanish Ministerio de Educación y Cultura (research grant SEJ2004-06710/PSIC to DB-F).
The authors would like to thank Dr Pere Vendrell (Psychiatry and Psychobiology Department, University of Barcelona) and Dr Begoña Campos (Biostatistics Department, University of Barcelona) for their useful comments on statistical analyses. This work was funded by a Spanish Ministerio de Educación y Culutra research project award (SEJ2004-06710/PSIC) to DB-F and partially funded by grants from the University of Barcelona to CS-P and by the Spanish Ministry of Science and Technology (Ramón y Cajal Program) to DB-F. This work was supported by the Generalitat de Catalunya (2001SGR 00139).
References
Andoh J, Artiges E, Pallier C, Rivière D, Mangin JF, Cachia A, Plaze M, Paillère-Martinot ML, Martinot JL.
Backman L, Almkvist O, Andersson J, Nordberg A, Winblad B, Reineck R, Långstrom B.
Ball K, Berch DB, Helmers KF, Jobe JB, Leveck MD, Marsiske M, Morris JN, Rebok GW, Smith DM, Tennstedt SL, Unverzagt FW, Willis SL.
Boroojerdi B, Phipps M, Kopylev L, Wharton CM, Cohen LG, Grafman J.
Brighina F, Bisiach E, Oliveri M, Piazza A, La Bua V, Daniele O, Fierro B.
Cabeza R, Anderson ND, Locantore JK, McIntosh AR.
Cabeza R, Nyberg L.
Cappa SF, Sandrini M, Rossini PM, Sosta K, Miniussi C.
Chen R.
Fletcher PC, Henson RN.
Golby AJ, Poldrack RA, Brewer JB, Spencer D, Desmond JE, Aron AP, Gabrieli JD.
Gorsler A, Baumer T, Weiller C, Munchau A, Liepert J.
Grady CL, Furey ML, Pietrini P, Horwitz B, Rapoport SI.
Grady CL, McIntosh AR, Beig S, Craik FI.
Grady CL, McIntosh AR, Rajah MN, Beig S, Craik FI.
Grafman J, Wassermann E.
Gutchess AH, Welsh RC, Hedden T, Bangert A, Minear M, Liu LL, Park DC.
Haxby JV, Hoffman EA, Gobbini MI.
Hilgetag CC, Theoret H, Pascual-Leone A.
Jahanshahi M, Rothwell J.
Maccabee PJ, Eberle L, Amassian VE, Cracco RQ, Rudell A, Jayachandra M.
Maeda F, Keenan JP, Tormos JM, Topka H, Pascual-Leone A.
Moser DJ, Jorge RE, Manes F, Paradiso S, Benjamin ML, Robinson RG.
Mottaghy FM, Hungs M, Brugmann M, Sparing R, Boroojerdi B, Foltys H, Huber W, Topper R.
Mottaghy FM, Krause BJ, Kemna LJ, Topper R, Tellmann L, Beu M, Pascual-Leone A, Muller-Gartner HW.
Mottaghy FM, Pascual-Leone A, Kemna LJ, Topper R, Herzog H, Muller-Gartner HW, Krause BJ.
Pascual-Leone A, Bartres-Faz D, Keenan JP.
Pascual-Leone A, Houser CM, Reese K, Shotland LI, Grafman J, Sato S, Valls-Solé J, Brasil-Neto JP, Wassermann EM, Cohen LG, Hallett M.
Pascual-Leone A, Valls-Sole J, Wassermann EM, Hallett M.
Pascual-Leone A, Walsh V, Rothwell J.
Paus T, Jech R, Thompson CJ, Comeau R, Peters T, Evans AC.
Petersen RC, Doody R, Kurz A, Mohs RC, Morris JC, Rabins PV, Ritchie K, Rossor M, Thal L, Winblad B.
Ranganath C, Johnson M, D'Esposito M.
Reber PJ, Wong EC, Buxton RB.
Reuter-Lorenz PA, Jonides J, Smith EE, Hartley A, Miller A, Marshuetz C, Koeppe RA.
Robertson EM, Theoret H, Pascual-Leone A.
Rosen AC, Prull MW, O'Hara R, Race EA, Desmond JE, Glover GH, Yesavage JA, Gabrieli JD.
Rossi S, Miniussi C, Pasqualetti P, Babiloni C, Rossini PM, Cappa SF.
Roth Y, Zangen A, Hallett M.
Sack AT, Linden DE.
Speer AM, Kimbrell TA, Wassermann EM, D Repella J, Willis MW, Herscovitch P, Post RM.
Sperling RA, Bates JF, Chua EF, Cocchiarella AJ, Rentz DM, Rosen BR, Schacter DL, Albert MS.
Sperling RA, Bates JF, Cocchiarella AJ, Schacter DL, Rosen BR, Albert MS.
Stebbins GT, Carrillo MC, Dorfman J, Dirksen C, Desmond JE, Turner DA, Bennett DA, Wilson RS, Glover G, Gabrieli JD.
Terao Y, Ugawa Y, Hanajima R, Machii K, Furubayashi T, Mochizuki H, Enomoto H, Shiio Y, Uesugi H, Iwata NK, Kanazawa I.
Terao Y, Ugawa Y, Sakai K, Uesaka Y, Kohara N, Kanazawa I.
Topper R, Mottaghy FM, Brugmann M, Noth J, Huber W.
Wagner AD, Schacter DL, Rotte M, Koutstaal W, Maril A, Dale AM, Rosen BR, Buckner RL.
Wassermann EM, Grafman J, Berry C, Hollnagel C, Wild K, Clark K, Hallett M.
Author notes
1Department de Psiquiatria i Psicobiologia Clínica, Universitat de Barcelona, 08036 Barcelona, Spain, 2Institut d'Investigacions Biomèdiques August Pi i Sunyer, Universitat de Barcelona, 08036 Barcelona, Spain, 3Servei de Neurologia, Hospital Clinic de Barcelona, 08036 Barcelona, Spain, 4Servei de Radiologia, Hospital Clínic de Barcelona, 08036 Barcelona, Spain, 5Escola Universitària Gimbernat, Universitat Autònoma de Barcelona, 08174 Sant Cugat del Vallés, Barcelona, Spain, 6Departament de Biofísica Mèdica, Universitat de Barcelona, 08036 Barcelona, Spain and 7Laboratori d'Exploracions Neurofuncionals, Servei de Neurologia, Hospital Clínic de Barcelona, 08036 Barcelona, Spain