


Abstract
Auditory spatial tasks induce functional activation in the occipital—visual—cortex of early blind humans. Less is known about the effects of blindness on auditory spatial processing in the temporal—auditory—cortex. Here, we investigated spatial (azimuth) processing in congenitally and early blind humans with a phase-encoding functional magnetic resonance imaging (fMRI) paradigm. Our results show that functional activation in response to sounds in general—independent of sound location—was stronger in the occipital cortex but reduced in the medial temporal cortex of blind participants in comparison with sighted participants. Additionally, activation patterns for binaural spatial processing were different for sighted and blind participants in planum temporale. Finally, fMRI responses in the auditory cortex of blind individuals carried less information on sound azimuth position than those in sighted individuals, as assessed with a 2-channel, opponent coding model for the cortical representation of sound azimuth. These results indicate that early visual deprivation results in reorganization of binaural spatial processing in the auditory cortex and that blind individuals may rely on alternative mechanisms for processing azimuth position.
Introduction
Early-onset blindness is associated with superior spatial hearing skills in the azimuthal plane. Specifically, several behavioral studies reported enhanced localization acuity in blind humans and other mammals. This behavioral advantage is observed mostly in the auditory periphery, possibly because sighted individuals also perform very well at central locations (Rauschecker and Kniepert 1994; King and Parsons 1999; Röder et al. 1999; Voss et al. 2004). In addition, blind participants tend to exhibit more accurate monaural sound localization (Lessard et al. 1998; Gougoux et al. 2005; Voss et al. 2015), although there are also studies that did not find such enhanced azimuthal spatial audition in blind participants (Zwiers et al. 2001a, 2001b; Lewald 2002a). Short-term visual deprivation in sighted humans also induces reversible improvements in horizontal sound localization accuracy (Lewald 2007). In addition, auditory motion perception is superior in early blind humans (Lewald 2013). On a neurophysiological level, early visual deprivation induces widespread cross-modal cortical reorganization. In particular, early blind humans recruit dorsal extrastriate areas during sound localization tasks (Weeks et al. 2000; Renier et al. 2010; Collignon et al. 2011), and some studies suggest that the activity in these areas is correlated to monaural sound localization performance (Gougoux et al. 2005). A virtual lesion study supports the notion that occipital cortical regions may be functionally relevant for auditory localization in blind individuals (Collignon et al. 2007). Finally, neuroimaging results indicate that the visual motion area hMT+ is involved in auditory motion processing in blind humans (Jiang et al. 2014, 2016).
Visual deprivation also affects sound processing in the primary and secondary auditory areas in the superior temporal plane: The absence of vision results in plasticity in the intact auditory sensory system. Early blind humans show, for instance, an expansion of tonotopic areas in the auditory cortex (AC) (Elbert et al. 2002), shorter latencies of early evoked potentials (Röder et al. 1996), and a reduced hemodynamic response during low-demand listening conditions (Stevens and Weaver 2009). Additionally, early blind individuals exhibit differential neural processing of auditory motion in (right) planum temporale (PT) (Jiang et al. 2014, 2016, but see Poirier et al. 2006), as well as changes in functional connectivity between PT and occipital, frontal, and parietal cortices (Dormal et al. 2016). Sound location processing in the AC of blind individuals, however, is rarely studied. One study reported an increase in the percentage of spatially selective neurons in the AC of blind cats (Korte and Rauschecker 1993). Conceivably, neural plasticity could induce higher spatial selectivity in the AC of blind humans as well, leading—for instance—to more accurate location estimates based on the neuronal activity and a (opponent) population coding model, which has been shown to be an accurate representation of sound location in the AC of sighted humans (Derey et al. 2015; van der Heijden et al. 2018). Yet, whether this is indeed the case and how such auditory cortical plasticity relates to the recruitment of occipital areas remains unclear.
In the present study, we investigated functional plasticity in blind humans for binaural spatial (azimuth) processing in both the superior temporal plane and the occipital cortex. We compared blood oxygen level–dependent (BOLD) signals measured in 11 congenitally blind participants and 1 early blind participant (Table 1). We employed a phase-encoding functional magnetic resonance imaging (fMRI) paradigm in which participants listened to subject-specific binaural recordings of sounds moving smoothly through the horizontal plane (Derey et al. 2015). Data were analyzed with complementary univariate and multivariate statistical procedures to test for differences between sighted and blind participants in general auditory processing, as well as binaural spatial processing. That is, because some studies indicated different levels of auditory activation in blind individuals (as discussed above), we first investigated with univariate and multivariate analyses whether sound presentation induces different fMRI activation in sighted and blind individuals (independent of sound location processing). Next, we assessed differences in spatial auditory processing between sighted and blind individuals. Finally, we performed a sound location decoding analysis to investigate whether the cortical representation of sound location in blind humans is similar to that in sighted humans. Our results reveal a reorganization of binaural spatial processing in the AC of congenitally and early blind humans, suggesting that blind individuals rely on alternative neural mechanisms for spatial audition in comparison with sighted individuals. These results provide new insights in the adaptive potential of the human brain within the intact, remaining senses following sensory deprivation.
Clinical characteristics of blind participants
| Sex | Age | Cause | Onset | Residual vision |
|---|---|---|---|---|
| F | 35 | Unknown | At birth | None |
| F | 40 | ROP | At birth | None |
| F | 54 | ROP | At birth | None |
| M | 45 | ROP | At birth | None |
| M | 39 | LON | At birth | Minimal light sensitivity |
| M | 48 | LON | At birth | Minimal light sensitivity |
| M | 54 | ROP | At birth | Minimal light sensitivity |
| F | 29 | ROP | Age 2 | None |
| M | 27 | ROP | At birth | Minimal light sensitivity |
| Fa | 41 | LCA | At birth | None |
| M | 43 | ROP | At birth | None |
| F | 53 | ROP | At birth | Minimal light sensitivity |
Note: LON = Leber’s optic neuropathy; ROP = retinopathy of prematurity; LCA = Leber’s congenital amaurosis; M = male; F = female.
aLeft-handed.
Materials and Methods
Participants
Eleven congenitally blind participants and 1 early blind participant (mean age = 42.3, standard deviation [SD] = 9.1 years, range = 27–54 years; see Table 1 for further details) and a control group of 12 sighted participants (mean [SD] age = 39.4 years [8.8], range = 26–53 years) volunteered to participate in the study. Five blind participants had minimal residual light sensitivity but were not able to perceive shape, form, color, or any type of pattern vision. Hearing levels were screened for all participants with pure tone audiometry at 0.5, 1, 2, 4, and 6 kHz. All participants had normal hearing thresholds (i.e., thresholds were equal to or smaller than 25 dB for all frequencies tested), and there were no differences in hearing level between sighted and blind participants (independent samples t-test at each frequency, P > 0.05, Bonferroni corrected for multiple comparisons). Participants reported no history of neurological disorders. The ethical committee of the Faculty of Psychology and Neuroscience at Maastricht University granted approval for the study.
Stimuli
For each participant, we created stimuli by making binaural recordings of logarithmic frequency-modulated (FM) sweeps (duration = 450 ms, repetition rate = 2 Hz). FM sweeps either spanned a frequency range of 250–700 or 500–1400 Hz and decreased exponentially at a speed of 2.5 octaves/s. We included 2 different frequency ranges to investigate whether the cortical representation of sound location is frequency dependent. Further, we used FM sweeps to elicit robust activations in higher-order regions beyond the primary AC (i.e., higher-order regions respond most strongly to complex sounds; Rauschecker and Scott 2009).
We employed a phase-encoding stimulation paradigm (Derey et al. 2015) similar to those used to map the retinotopic organization in occipital cortex (Engel et al. 1997) and the tonotopic organization in AC (Striem-Amit et al. 2011). This enabled us to map the fMRI responses to sound at locations across the entire azimuth. Each stimulus started with a 10-s stationary period. After the stationary period, the sound moved smoothly through the horizontal plane, making a full circle around the head of the participant in 20 s (rotation speed = 18°/s). The stimulus was concluded with another 10-s stationary period at the same location as the starting location, resulting in a total stimulus duration of 40 s. The stationary periods at the beginning and end of each stimulus were added to account for the BOLD onset and offset response. We included 2 different starting positions (+90° and −90°) as well as 2 different motion directions (clockwise and counterclockwise) to ensure that the measurements of cortical location encoding were not confounded by other factors such as the direction of motion. Finally, sounds were presented at 3 different sound levels spaced 10 dB apart (soft, medium, and loud), resulting in a total of 24 conditions (2 frequency ranges, 2 rotation directions, 2 starting points, and 3 sound levels). Sounds were presented at different intensities to enable testing for level invariance of the neuronal spatial representation. That is, the spatial selectivity of individual neurons or populations of neurons decreases with increasing sound intensity (Stecker et al. 2005; King et al. 2007; Derey et al. 2015). Therefore, any potential location coding mechanism has to ensure that location coding remains constant despite varying sound levels.
For the binaural recordings, participants were seated in a chair and microphones were placed in their ear canals (OKM II Classic Microphone, Soundman; sampling rate = 44.1 kHz). The chair was positioned in the middle of a normal room (internal volume = 95 m3) with walls and ceiling of gypsum board and a floor of wood with a thin carpet on top. Sounds were played through a 3D sound system with 22 loudspeakers in a spherical setup in the far field (12 speakers in the horizontal plane at the elevation of the interaural axis and a distance of 2.4 m from the participant). We positioned sounds in the acoustic 3D environment with the virtual reality software Vizard (Worldviz). Participants were monitored with a video camera attached to the wall to ensure that no head movements were made during the recordings. Sounds were presented at 75 dB SPL.
We assessed the presence of binaural disparity cues and monaural spectral cues in the stimuli with a detailed analysis of the subject-specific binaural recordings. That is, for each participant, we calculated the magnitude and sign of the interaural level differences (ILDs) and interaural time differences (ITDs) across their binaural recordings at +90° and −90°. We computed ILD as the difference in sound level between the recordings in the left and right ear. In particular, we converted the differences in power between the 2 channels (measured as root mean square [RMS]) to decibels [dB]). To determine the ITD, we first computed the phase difference between the left and right channel of the recording (interaural phase difference) and subsequently converted this to time differences. Finally, we computed the spectrograms of the recordings at +90 and −90 to evaluate the presence of spectral cues. To ensure that spectral analyses were not confounded by the frequency modulation of the tones, we selected for each azimuth position the maximum power within a frequency band in a window of 225 ms before and after the time point associated to that azimuth location (the total duration of FM tone was 450 ms).
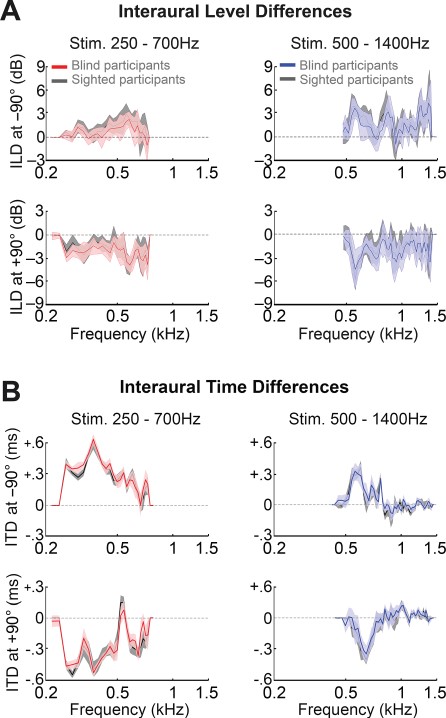
Figure 1 shows the ILDs and ITDs in the binaural recordings of sighted and blind participants. The average magnitude of ILDs and ITDs in the recordings was similar across participant groups. That is, we performed a nonparametric permutation analysis to test for differences in the presence of binaural spatial cues between the recordings of sighted and blind participants. Specifically, for each frequency bin, we permuted the subject labels (i.e., early blinds vs. sighted controls) and computed the mean difference in ITD and ILD between the permuted groups (5000 repetitions). We then calculated the P value of the observed mean difference as the ratio between the number of times the permuted mean difference was equal or exceeded the observed mean difference and the number of permutations, adding 1 to both the numerator and the denominator to avoid zero P values. There were no differences in ITDs at any frequency (q[FDR] > 0.05) and in ILDs only for 1 isolated frequency bin (~800 Hz, q[FDR] = 0.03) for one of the stimuli (see Supplementary Tables 1 and 2).
Interaural level and time differences (ILDs and ITDs, respectively) in the binaural recordings of sighted and blind participants. Plotted are the average ILD (A) and ITD (B), for the group of blind participants and the group of sighted participants. Red lines indicate the average for stimuli of blind participants in the range of 250–700 Hz; and blue lines, for stimuli of blind participants in the range of 500–1400 Hz. ILDs and ITDs for stimuli of the sighted participants are plotted in black. Shaded areas depict the SD.
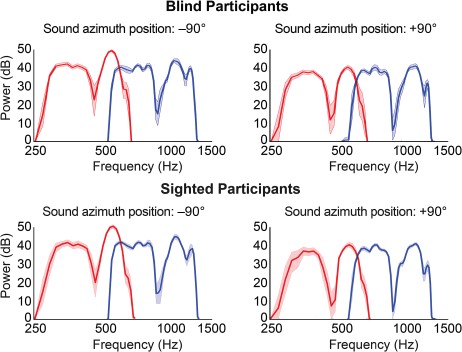
The recordings also contained spectral cues for sound location. Specifically, the spectral shape of the recordings varied as a function of azimuth (Fig. 2). There were no systematic differences in the average power per frequency between sighted and blind participants (nonparametric, permutation-based analysis, all qs[FDR] > 0.05; see Supplementary Tables 3 and 4).
Spectral variation in binaural recordings of sighted and blind participants as a function of azimuth position. Plotted are the spectrums derived from recordings in the left ear for stimuli at the left (−90°; left) and at the right (+90°; right) for sighted and blind participants (first and second rows, respectively). Red lines represent the average spectrum for stimuli in the range of 250–700 Hz; blue lines represent the average for stimuli in the range of 500–1400 Hz (averaged across participants within the group). Shaded areas indicate the 95% confidence interval as estimated with a bootstrapping procedure (10 000 repetitions). Note, for instance, the difference in the depth of the troughs between the sound at the 2 locations, as well as the difference in the peaks at ~ 500 and ~ 1300 Hz.
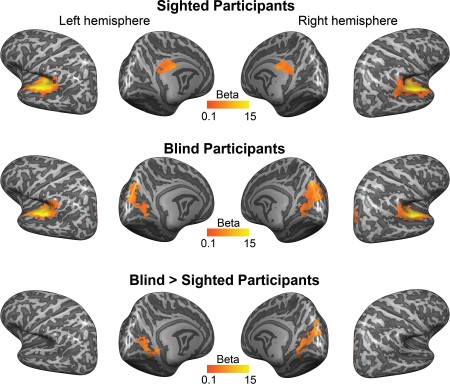
Functional activation in response to long-duration, sustained sounds. The first and second rows show the mean regression weights—that is, the average beta map—resulting from the within-group RFX GLM (contrast sustained + transient > baseline) projected on the group-averaged cortical surface. The third row shows the result of a mixed effects model testing for group differences in functional activation between blind and sighted participants. All maps were thresholded with a nonparametric permutation testing procedure at P < 0.05 and corrected for multiple comparisons with a local clusterwise inference (final threshold P < 0.05; see Methods).
Data Acquisition
Functional and anatomical data were collected with a Siemens whole-body 3.0-T MRI scanner (Siemens Prisma) at the Scannexus MRI scanning facilities (www.scannexus.nl) at 2- and 1-mm3 isotropic voxel resolutions, respectively. Functional data were recorded with a standard T2*-weighted echo planar imaging sequence covering the temporal cortex as well as parts of the parietal, occipital, and frontal cortices (time echo [TE] = 30 ms, time repetition [TR] = 2000 ms, flip angle = 90°, matrix size = 100 × 100, voxel size = 2 × 2 × 2 mm, number of slices = 32). Specifically, the acquisition slab was oriented along the Sylvian fissure, with the dorsal border extending from the inferior prefrontal cortex (anterior) to the inferior parietal lobule and finally the top of the parieto-occipital sulcus (POS) (posterior) and the ventral border from the anterior pole and anterior inferotemporal cortex to the dorsal bank of the calcarine sulcus (CS) (posterior), missing the most ventral parts of the occipital pole (depending on the subject-specific anatomy of the brain and brain size). In this way, we covered the entire temporal cortex and the visuospatial processing network (i.e., in sighted humans). Anatomical data were obtained with a T1-weighted magnetization prepared rapid gradient echo sequence with the following parameters: TE = 2.17 ms, TR = 2250 ms, voxel size 1 × 1 × 1 mm, and matrix size = 192 × 256 × 256.
Experimental Paradigm
During the fMRI session, binaural recordings were presented with Sensimetrics S14 MR-compatible earphones (flat response over 0.1 -- 8 kHz; Sensimetrics Corporation). All participants were instructed to listen attentively to the location of the sounds, and sighted participants were instructed to fixate on a white fixation cross presented on a black screen during sound presentation (note that we chose fixation over blindfolding for sighted participants to minimize the effects of eye movements, which are likely to occur for sighted individuals for this type of spatialized stimuli). Sound level was scaled individually for each participant such that the lowest intensity was comfortable and audible on top of the scanner noise. Sound intensity was furthermore equalized between the frequency ranges of 250–700 and 500–1400 Hz (subjective perception). Each condition was presented 3 times, resulting in 72 trials in total. Trials were presented in 6 runs of 12 trials each. Each run contained sounds of 1 intensity (soft, medium, or loud). The order of runs was randomized and counterbalanced across participants. Starting position and rotation direction of the sounds were counterbalanced and randomized both within and across runs.
Data Preprocessing
Data were preprocessed with BrainVoyager QX (Brain Innovations). Preprocessing of functional data consisted of head motion correction (trilinear/sinc interpolation, the first volume of the first run functioned as the reference volume for alignment), interscan slice-time correction (sinc interpolation), linear drifts removal, and temporal high-pass filtering (threshold at 7 cycles per run). Functional data were mildly smoothed (3-mm kernel). We coregistered functional data to the T1-weighted images of each individual and sinc-interpolated to 3D Talairach space at a 2-mm3 resolution (Talairach and Tournoux 1988). Gray/white matter borders were defined with the automatic segmentation procedure of BrainVoyager QX and complemented with manual improvements. Optimum coregistration of cortical surface across participants was achieved with cortex-based alignment (CBA) of the participants' cortical surface reconstructions (Goebel et al. 2006). For the detailed analysis of the AC in the context of the population coding model, we performed the CBA constrained by an anatomical mask of Heschl's gyrus (Kim et al. 2000). This procedure is similar to the functional CBA procedure (Frost and Goebel 2013): An anatomical definition of a region of interest (ROI) is used to optimize the local realignment of this region rather than globally realigning the entire cortex. Functional data were then projected from volume space to surface space by creating mesh time courses from volume time courses. A value was obtained for each vertex of the cortex mesh by sampling (trilinear interpolation) and computing the average value of that location in the volume time course from the gray/white matter boundary up to 4 mm into the gray matter (toward the pial surface).
Univariate Analysis
Data were analyzed with BrainVoyager QX (Brain Innovations) and customized MATLAB code (Mathworks, Inc.). We performed 2 univariate analyses: As a first step, we evaluated which brain regions exhibited increased activation during presentation of long-duration sounds. Next, we assessed the processing of spatialized sounds specifically.
To evaluate brain responses to long-duration sounds, we estimated an random effects general linear model (RFX GLM) on the normalized (percent signal change transformation) fMRI time series with 2 predictors: a predictor modeling a sustained response and an additional predictor modeling a phasic response. The addition of the phasic predictor was motivated by studies showing that the shape of fMRI responses in the AC varies for long-duration sound stimuli and includes phasic components. Therefore, including the phasic predictor in the GLM leads to greater sensitivity for detecting fMRI activation induced by long-duration sounds (Harms and Melcher 2002; Seifritz et al. 2002; Harms and Melcher 2003). We computed the sustained predictor by convolving a boxcar function for the entire duration of the auditory stimulus with a double-gamma hemodynamic response function (HRF) (Friston et al. 1995). The phasic predictor consisted of a transient response to the onset of the stimulus as well as a transient response to the offset of the stimulus, convolved with the HRF. Additionally, to investigate whether the response profile of areas active during sound presentation is mainly driven by a sustained response, a phasic response, or a combination of both, we computed the waveshape index (WI). The WI reflects the normalized difference between the beta weights of the sustained predictor and the phasic predictor (Eq. 1; Harms and Melcher 2003).
A positive WI indicates that the observed fMRI response is mainly driven by a sustained response. In contrast, a negative WI suggests that a transient component is driving the fMRI response. A WI close to zero indicates an fMRI response that contains both sustained and transient components.
Next, to assess the processing of spatialized sounds, we estimated an RFX GLM with orthogonal “binaural difference” and “binaural sum” regressors for each condition. The binaural difference regressor reflects the ILD, that is, the arithmetic difference in power between the left and right channels of the binaural recordings (quantified as the RMS). Note that we did not compute a regressor based on the ITD, as we previously showed that predictors based on the ITD and ILD information in these stimuli are highly correlated (Derey et al. 2015). The binaural sum was computed as the summed power in the left and right ear of the recording (i.e., the RMS) and reflects the overall response to sound. Both the binaural sum and the binaural difference regressor were then convolved with an HRF with a subject-specific time-to-peak (TTP). Specifically, for each participant, we estimated the TTP of the HRF (Derey et al. 2015) to ensure that interindividual differences in the shape of the HRF do not affect the results. We estimated 3 GLMs with double-gamma HRFs (Friston et al. 1995) for each functional run with TTPs ranging from 4 to 8 s, in steps of 2 s. The optimal TTP value for each participant was selected based on the number of significantly active voxels (sound on > baseline, P < 0.05, Bonferroni corrected) resulting from each TTP value and the average t value across these voxels. For most participants (11 sighted participants, 9 blind participants), the optimal TTP was 6 s; for some, this was 4 s (1 sighted participant, 2 blind participants) or 8 s (1 blind participant).
For both univariate analyses, to evaluate the within-group and between-group results with a noninflated false-positive rate, we performed a permutation-based, nonparametric group analysis (see also Eklund et al. 2016). Specifically, for each participant in a group, we retrieved the individual map of regression weights (i.e., the beta map). We then tested the contrast effect univariately per vertex with a permutation testing procedure in which we randomly changed the sign of the regression weight of each participant (exact permutation test, 4096 sign changes) to generate samples under the null distribution. We retained vertices with P < 0.05 and performed a cluster-extent–based thresholding to correct for multiple comparisons. For each permutation, we constructed a cortical map of false positives—that is, vertices with P < 0.05 in the permutation. For each of these maps, we then determined the maximum extent of false-positive clusters. We used the resulting distribution of maximum cluster sizes to threshold the clusters observed in the data at Pcluster < 0.05. To compare contrast effects between groups, we again performed a permutation testing procedure in which we randomly scrambled subject labels (5000 permutations). We corrected for multiple comparisons with the same cluster-extent–based thresholding setup.
Multivariate Analysis
We used a multivariate analysis procedure to decode subject group (i.e., sighted vs. blind participants) from subject-specific activation maps, that is, multivertex patterns of regression weights (betas) resulting from a GLM estimation. Beta maps were considered in 3 anatomically defined regions. The first region was a mask of the entire AC, including Heschl’s gyrus (HG), Heschl’s sulcus (HS), PT, planum polare (PP), and superior temporal gyrus (STG). The other 2 regions were smaller and covered specific auditory regions. Specifically, we defined a mask of PT, covering HS (starting from the posterior border of HG) and the remaining part of the superior temporal plane, bordered medially by the insular cortex and laterally by the STG (Kim et al. 2000). Finally, we delineated a mask covering HG only (see Fig. 6).
Within these anatomically defined ROIs, we examined whether a support vector machine (SVM; Vapnik 2013) learning model was able to classify the binaural sum and binaural difference beta maps as belonging to a blind or sighted participant. The classifier was trained on the labeled beta maps of 22 participants (11 in each participant group) and tested on the unlabeled beta maps of 2 left-out participants (one in each group). All voxels in the ROI were entered the multivariate analysis. This procedure was then repeated 12 times, changing the training–testing subdivision in such a way that each participant belonged to the test set only once. In addition, we iterated the entire cross-validation procedure 30 times—each time scrambling the order of participants within the groups—to reduce the variation in cross-validation accuracy due to randomness of the subject sampling within the groups. Classification accuracy was computed as the average percentage of successful classifications across the 30 iterations. Finally, to assess whether the classifier performed above chance level, we carried out a permutation testing procedure (2000 iterations) in which we scrambled the beta map labels. The same cross-validation classification procedure, including the 30 iterations scrambling subject order, was then repeated on the scrambled data labels. The P value was then calculated as the ratio between the number of times the permuted accuracy was equal or exceeded the observed accuracy and the number of permutations (adding 1 to both numerator and denominator to avoid zero P values).
To estimate the statistical power of the result obtained with the multivariate analysis, we performed post-hoc simulations based on an independent data set acquired with an identical experimental paradigm (Derey et al. 2015). The results of the simulations show that, for the present study, a power of 80% or more—with 12 participants per group—is achieved with a decoding accuracy of 78% (see Supplementary Materials and Supplementary Figure 1). Importantly, the actual accuracies that we observe in the present study range from ~ 80% to ~ 82%, corresponding to a power of around 90%.
Results
Responses to Long-Duration Sounds in Auditory and Visual Cortices
We measured 3-T fMRI responses while participants listened to spatialized stimuli that consisted of logarithmic FM sweeps moving smoothly through the horizontal plane. Specifically, stimuli were presented in a phase-encoding stimulation paradigm to map the cortical representation of sound at locations across the entire azimuth. Stimuli were spatialized with subject-specific binaural recordings to maximize the availability of spatial cues in the scanner, which resulted in realistic, well-localizable auditory stimuli (see Methods). Verbal reports confirmed that participants could accurately perceive the sound azimuth trajectory apart from some front–back reversals that are commonly observed in human sound localization (Oldfield and Parker 1984; Musicant and Butler 1985). There were no differences in the frequency of reversals between sighted and blind participants.
The auditory cortical responses to long-duration sounds such as the stimuli used in the present experiment can range from sustained to transient (Harms and Melcher 2003). Therefore, as a first step, we estimated a GLM on the measured BOLD time courses with 2 predictors per trial: one modeling a sustained BOLD response and one modeling a transient BOLD response (Harms and Melcher 2003; see Methods). We performed a permutation-based nonparametric group analysis with cluster-extent–based thresholding to correct for multiple comparisons (Eklund et al. 2016; see Methods). Figure 3 shows the resulting average regression weight—that is, beta—maps for sighted participants (first row) and blind participants (second row; contrast Sustained + Transient > Baseline, P < 0.05 corrected). Both participant groups exhibited a strong response to long-duration sounds in a wide expanse of the AC, including primary areas such as HG and secondary areas such as HS, PT, PP, and STG. Additional clusters of activation were observed in sighted participants in the posterior cingulate cortex (pCC), covering the cingulate gyrus and corpus callosum sulcus, and in blind participants in the parieto-POS, cuneus, and CS. A between-group comparison showed that the bilateral cuneus, bilateral CS, and right POS were activated more strongly in blind than in sighted participants (Fig. 3, third row; P < 0.05 corrected).
The shape of the BOLD signal in the occipital cortex of blind participants—in response to the long-duration sounds used here—was predominantly transient, while that in the temporal cortex of both sighted and blind participants had a stronger sustained component. Specifically, the average WI (Harms and Melcher 2003), which reflects the normalized difference between the regression weights for the sustained and phasic predictors (see Methods), was positive in the AC of both participant groups (average WIblind participants [SD] = 0.27 [0.22]; average WIsighted participants [SD] = 0.23 [0.22]) but lower and more variable in the occipital cortex of blind participants (average WI [SD] = 0.06 [1.11]; Fig. 4A). In addition, the between-group comparisons for the contrasts transient predictor > baseline and sustained predictor > baseline show that, for the transient predictor only, there is a significant increase in activation in the occipital cortex of blind participants compared with sighted participants (Fig. 4B).

Contribution of transient and sustained components to fMRI response in sighted and blind participants. (A) Average WI for vertices responding to long-duration sounds in sighted and blind participants. Plotted is, for each participant, the average WI across responsive vertices (fixed effects GLM, contrast sustained + transient > baseline; P < 0.005, cluster size corrected) in the AC of sighted indviduals (left column, n = 12), in the AC of blind individuals (middle column, n = 12), and in the occipital cortex of EB (right column, n = 6; other blind participants did not show active occipital clusters at the threshold mentioned above). (B) Transient and sustained functional activation in response to long-duration sounds. The first and second rows show the mean regression weights resulting from the within-group RFX GLM (left column: contrast transient > baseline; right column: contrast sustained > baseline) projected on the group-averaged cortical surface. The third row shows the result of a mixed effects model testing for group differences in functional activation between blind and sighted participants. All maps were thresholded with a nonparametric permutation testing procedure at P < 0.05 and corrected for multiple comparisons with a local clusterwise inference (final threshold P < 0.05).
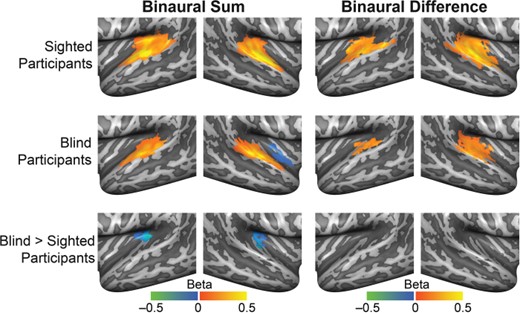
Univariate analysis of the processing of spatialized sounds in the AC. Mean beta maps resulting from within-group RFX GLMs for sighted and blind participants (upper 2 rows). The left column shows maps for the general auditory response independent of sound location (binaural sum > baseline); and the right column, for the location-specific response (binaural difference > baseline). The bottom row displays the beta weight map resulting from a mixed effects model testing for group differences in functional activation between blind and sighted participants. All maps were thresholded with a nonparametric permutation testing procedure at P < 0.05 and corrected for multiple comparisons with a local clusterwise inference (final threshold P < 0.05; see Methods).
Univariate Analysis of the Processing of Spatialized Sounds
To investigate the processing of spatialized sounds within the AC of sighted and blind individuals, we performed a univariate GLM analysis with regressors designed to identify cortical regions with BOLD time courses modulated by sound position. That is, the regression model included for each condition a binaural difference regressor representing the expected response of regions modulated by sound position and a binaural sum regressor to account for the general auditory response to sound independent of spatial processing. These predictors were constructed for each participant based on the subject-specific binaural recordings (see Methods).
Figure 5 shows for each participant group the average regression weight maps for the contrasts binaural sum > baseline (left column) and binaural difference > baseline (right column; P < 0.05 corrected). In both participant groups, the binaural sum contrast showed the expected activation clusters in the AC in primary and secondary areas. The binaural difference contrast showed a similar pattern of activation in sighted participants, but the spatial extent of activation appeared reduced in blind participants, especially in the left hemisphere. A between-group comparison for the binaural sum contrast (Fig. 5, third row) showed that, in blind participants, the bilateral medial temporal cortex was activated less in comparison with sighted participants (P < 0.05 corrected). This finding converges with clusters of reduced activation in the medial temporal cortex that we observed in the first GLM with sustained and transient predictors but that failed to reach statistical significance (Supplementary Figure 2). Between-group differences for the binaural difference contrast did not survive cluster size thresholding (Fig. 5).
Multivariate Analysis of Spatial Sensitivity in Sighted and Blind Participants
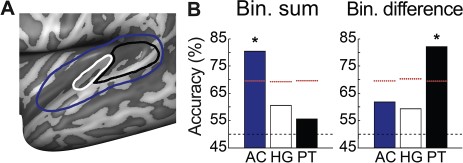
We complemented the univariate analysis of auditory spatial processing with a more sensitive multivariate pattern analysis (MVPA) approach, performing an across-subject classification. Specifically, we tested whether the subject-specific activation (regression weight) maps resulting from the binaural sum and binaural difference contrast described above can be accurately classified with an SVM decoder as belonging to either a blind or sighted participant. We considered activation maps in 3 anatomical regions: PT, HG, or the entire AC (Fig. 6A). These regions were selected based on prior neuroimaging studies in humans that show that PT is particularly relevant for sound location processing (Warren and Griffiths 2003; Brunetti et al. 2005; Deouell et al. 2007; van der Zwaag et al. 2011; Derey et al. 2015). Classification was done with a cross-validation procedure with 12 folds (equal to the number of participants in each group). Classification accuracy was determined as the average percentage of successful classifications and tested against chance level of performance with a permutation testing procedure (see Methods).
Multivariate analysis of differences in binaural spatial sensitivity between sighted and blind participants. (A) Schematic overview of the anatomical masks used for the multivariate analysis, overlaid on the inflated surface of the left hemisphere. Outlined in blue is the mask of the entire AC, outlined in white is the mask of HG, and outlined in black is the mask of PT. (B) Classification accuracies for the binaural sum activation maps, and the binaural difference activation maps, in AC, HG, and PT. The black dashed line indicates the chance level (50%), the red dashed lines indicate the 95% quantile of the null distribution, and the asterisks indicate accuracies significantly higher than chance (see text for detailed results of statistical testing). Bin. = binaural.
Figure 6B shows that, for the binaural sum contrast, classification performance reflected successful learning of subject class when considering the mask covering the entire AC (accuracy = 80.42%, P = 0.018; all P values reported here are Bonferroni corrected for multiple comparisons). This indicates that the overall sound response patterns in the AC of sighted and blind participants are different. Classification accuracies for this contrast were not above chance level when considering either just PT (accuracy = 55.56%, P = 1) or just HG (accuracy = 60.56%, P = 1). That successful classification was only possible when considering the mask of the entire AC—but not either HG or PT alone—signals that either there was a relatively small difference that was spread throughout the entire AC or there was a stronger difference but located predominantly outside HG and PT. The results of the univariate analysis—that is, clusters of differential activation in the medial temporal cortex—suggest that the effect is indeed located outside HG and PT. With an additional multivariate searchlight procedure, we confirmed that, in the left hemisphere, the group difference lies predominantly in auditory regions medially located with respect to HG, while in the right hemisphere, the effect is more distributed across AC (see Supplementary Materials and Supplementary Figure 6).
For the binaural difference contrast, the classifier was most successful in distinguishing subject group when considering activation maps in PT (accuracy = 82.08%, P = 0.027), but not in HG (accuracy = 59.31%, P = 1) or in the mask covering the entire AC (accuracy = 61.81%, P = 1). Thus, for binaural spatial processing, the pattern of regression weights in PT differs between sighted and blind participants.
Decoding Sound Azimuth Trajectory from Population Activity in the AC
Finally, having established with the MVPA that there is a between-group difference in the multivertex pattern of regression weights for spatial processing (i.e., in the beta maps for the binaural difference contrasts), we assessed the availability of information on sound azimuth position in the fMRI responses in the AC of blind and sighted individuals. Specifically, we decoded sound azimuth trajectory from population BOLD time courses of spatially sensitive, contralaterally tuned vertices in the AC, using an opponent coding model (Derey et al. 2015). First, we identified spatially sensitive vertices with the contrast binaural difference > baseline, as described above, selecting in each hemisphere the 1000 vertices with the highest regression weight. Note that, in order to have an independent measure of spatially sensitive regions as well as an independent data set for decoding to test the level invariance of the opponent coding model, we estimated the GLM and subsequent binaural difference contrast on the data of only 2 out of 3 sound intensity conditions. We then used the data of the left-out intensity condition to decode the sound azimuth trajectory from the population BOLD responses by deriving an opponent coding model. For the opponent coding model, we subtracted the average time course of the 1000 most spatially sensitive vertices in one hemisphere from the average time course of the 1000 most spatially sensitive vertices in the other hemisphere. This procedure was repeated 3 times, equal to the number of sound intensity conditions. Decoding accuracy was determined as the correlation between the actual sound azimuth trajectory and the decoded trajectory.
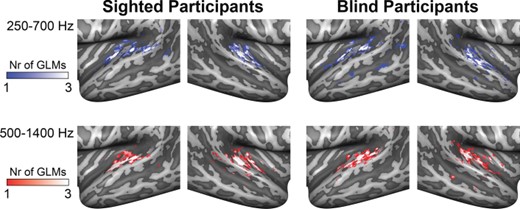
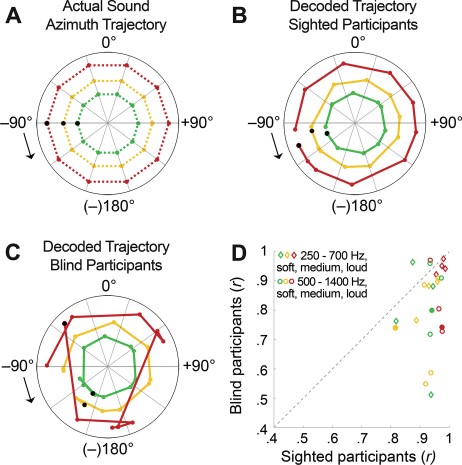
Figure 7 shows the maps of spatially sensitive vertices as identified by the contrast binaural difference > baseline for the 3 GLMs (i.e., one GLM including the loud and medium sound levels, one for the loud and soft sound levels, and one for the medium and soft sound levels). There was substantial overlap in the spatially sensitive vertices identified by each GLM. Figure 8 shows a representative example of an actual sound azimuth trajectory (Fig. 8A) and those reconstructed with the opponent coding model from the population BOLD time course in sighted (Fig. 8B) and blind (Fig. 8C) participants. For the condition displayed in Figure 8 (i.e., starting position: −90°, rotation direction: counterclockwise), the starting location was estimated less accurately for the blind than sighted participants: The position of the black dot is far removed from the left interaural axis for all sound levels in the group of blind participants (Fig. 8C), while for sighted participants, the estimated starting location is close to the actual starting location for all sound levels (black dots in Fig. 8B). Further, the trajectories for the blind participants contain one or more rotation direction reversals for all sound levels, and estimated locations are not evenly spaced throughout (i.e., some consecutive estimates lie directly next to each other, while others are far removed from each other; see Fig. 8C). In contrast, the trajectories for the sighted participants are spaced more evenly and do not contain rotation direction reversals (Fig. 8B, compare also with actual trajectories in Fig. 8A). Overall, decoding accuracy was significantly more accurate in sighted than in blind participants (Fig. 8D; one-sided independent samples t-test of Fisher-transformed correlation values [Fisher 1915]; t46 = −3.9029, P = 0.0002, Cohen’s d = 1.13; see also decoded trajectories for all conditions in Supplementary Figures 3 and 4). This indicates that the population fMRI responses in the AC of sighted participants carry more information on sound azimuth position based on binaural spatial cues than those in blind participants. There was no difference in decoding accuracy between the frequency ranges of 250–700 and 500–1400 Hz in either the sighted controls (2-sided paired samples t-test, t11 = −1.751, P = 0.11 [uncorrected]) or the blind participants (t11 = −0.347, P = 0.74 [uncorrected]).
Vertices in the AC modulated by binaural spatial cues. Maps show the results of the 3 within-group RFX GLMs estimated with the binaural sum and binaural difference predictors for the contrast binaural difference > baseline in sighted participants (left column) and blind participants (right column). Each GLM was estimated on the data of 2 sound intensity conditions. For each GLM, we color-coded the 1000 vertices in each hemisphere with the highest regression weight for the abovementioned contrast. Whiter colors indicate that a vertex was identified as spatially sensitive by multiple GLMs. Top row shows results for stimuli in the condition of 250–700 Hz; bottom row shows the results for stimuli in the condition of 500–1400 Hz. All vertices responded maximally to contralateral sound locations. Nr = number.
Decoding sound azimuth trajectory from BOLD population time courses in the AC with a 2-channel, opponent coding model. Polar plots show the actual sound azimuth trajectory of stimuli in the frequency range of 500–1400 Hz, starting at −90° and rotating counterclockwise (A), and the sound azimuth trajectories reconstructed from the fMRI responses of spatially sensitive vertices in the AC of sighted participants (B) and blind participants (C). Colors indicate the sound intensity condition: green = soft, yellow = medium, and red = loud (radius is arbitrarily selected for ease of visualization). Colored dots indicate the position of the sound at each measured time point (i.e., every 2 s). Black arrows signal the starting point and the motion direction of the sound azimuth trajectory; and black circles, the estimated starting point. (D) Raw correlation values between the decoded and actual sound azimuth trajectory for sighted participants (x-axis) and blind participants (y-axis). Each dot represents a condition (24 in total; e.g., soft intensity, starting left, rotating clockwise; diamonds indicate frequency range of 500–1400 Hz, and circles indicate frequency range of 250–700 Hz, with colors similar to polar plots). Higher correlation values correspond to higher decoding accuracies. Points below the diagonal indicate conditions for which the decoding accuracy was higher for sighted than blind participants. Filled points correspond to the examples included in panels B and C.
Discussion
We investigated the effects of congenital and early blindness on binaural spatial processing in the human brain. The key findings of this study are as follows: 1) Blind individuals exhibit a transient BOLD response to long-duration sounds in the occipital cortex; 2) the BOLD responses to sounds—independent of sound position—in the medial temporal cortex are lower for blind than sighted individuals; 3) the response patterns for binaural spatial processing in PT are different for sighted and blind participants; and 4) the population BOLD time courses in the AC of sighted individuals carry more information on sound azimuth location than those in blind individuals, as assessed with a 2-channel, opponent coding model.
Cross-modal Plasticity: fMRI Activations in the Occipital Cortex of Blind Humans
The univariate regression analysis revealed clusters in the occipital cortex, including the POS, cuneus, and CS that were activated more in blind than in sighted participants for general sound processing (independent of spatial location). The shape of these occipital fMRI responses in blind participants differed from that in the temporal cortex of both blind participants and sighted controls. That is, the fMRI response in occipital cortex had a stronger transient component (as evidenced by a lower WI; see Results). Such a transient response may reflect adaptation to the long-duration sounds used in the present study (Seifritz et al. 2002; Harms and Melcher 2003), but this cannot be ascertained with certainty for the present data set. Other studies of cross-modal plasticity in blindness mostly use short-duration stimuli or do not assess the shape of the occipital fMRI responses, making it difficult to compare the current findings.
Nevertheless, the transient nature of the occipital fMRI responses in blind participants triggers questions about the functional significance of these clusters of activation. This ambiguity is further strengthened by the observation that the occipital fMRI responses were not modulated by binaural spatial cues. What is the role of the fMRI activation in occipital cortex for spatial auditory processing? Interestingly, a substantial number of studies report cross-modal activations in regions that evidence preserved functional specialization. For instance, auditory spatial processing activates “visual” spatial processing areas in blind humans (Renier et al. 2010). However, as mentioned above, such studies either used short-duration stimuli or did not assess the shape of the fMRI response and do not test directly the functional significance of such cross-modal activations. More direct evidence for the functional involvement of occipital cortex for sensory processing in the remaining senses comes from studies disrupting neural processing in the occipital cortex of blind humans with transcranial magnetic stimulation (TMS), typically resulting in behavioral impairments. Examples include impaired Braille reading following TMS (Cohen et al. 1997) and impaired auditory location discrimination (Collignon et al. 2006). Such findings indicate that occipital regions are functionally relevant for auditory and tactile processing in blind humans. Yet, the underlying mechanisms for cross-modal occipital involvement during auditory processing in blindness (or for cross-modal neuroplasticity in general) are not well understood (Collignon et al. 2009; Merabet and Pascual-Leone 2010). Further empirical work is required to investigate the temporal dynamics of cross-modal activations for short- and long-duration stimuli, to test their functional significance for long-duration stimuli, and to relate this to candidate neural compensatory mechanisms such as changes in subcortical connectivity, cortico-cortical feedback from (multimodal) higher-order regions in parietal cortex, and cortico-cortical forward projections from the primary region of the remaining sense to the primary region of the deprived sense (Bavelier and Neville 2002; Collignon et al. 2009).
Further, note that we did not observe binaural spatial processing in area hMT+ even though this visual motion processing region is implicated in auditory motion direction processing in blind humans (Wolbers et al. 2011; Jiang et al. 2014; Jiang et al. 2016). That this area does not show binaural spatial sensitivity may be a result of distinct auditory processing mechanisms for static sound location and auditory motion, as was recently demonstrated in sighted primates (Poirier et al. 2017). In line with this, our results suggest that, although hMT+ may be involved in auditory motion processing in blind humans, this functional involvement does not extend to static binaural spatial processing.
fMRI Responses to Sound in the AC of Blind Humans
In temporal cortex, a bilateral medial region exhibited lower BOLD signal amplitudes in response to long-duration sounds in blind than in sighted participants (i.e., for general sound processing, irrespective of sound location processing). Such a reduction in BOLD signal amplitudes in the temporal cortex of blind participants is not often reported in studies of sound localization and auditory motion processing in blind humans (e.g., Weeks et al. 2000; Gougoux et al. 2005; Poirier et al. 2006; Renier et al. 2010; Jiang et al. 2014), although there are some studies that have made similar observations (Stevens and Weaver 2009; Watkins et al. 2013). In the present study, the long duration of the stimuli may have contributed to the between-group differences in activation of the temporal cortex. This study was also methodologically optimized to detect subtle between-group differences. In particular, we used a higher imaging resolution, as well as an optimized intersubject cortical alignment procedure, which is especially beneficial for the anatomically highly variable temporal cortex (Campain and Minckler 1976; Leonard et al. 1998; Shapleske et al. 1999).
The functional significance of this reduction in hemodynamic activity in the temporal cortex, however, is not clear. It has been suggested that reduced activations are a result of more efficient neural processing of sound by blind individuals as a consequence of their expertise (Röder et al. 1996; Manjunath et al. 1998; Stevens and Weaver 2009). In agreement with this hypothesis, studies of music and motor (i.e., sport) experts show that humans that have trained a skill over many years may show reduced BOLD responses compared with novices (e.g., Jäncke et al. 2000; Koeneke et al. 2004; Naito and Hirose 2014). However, it should be noted that there are also studies providing arguments for the opposite hypothesis, that is, that “expanded” activations reflect more efficient sound processing in blind individuals (e.g., Elbert et al. 2002). Thus, the exact nature of the neural mechanisms underlying the lower BOLD response in the temporal cortex that we observed here, their specificity to sound location processing, and their behavioral relevance remain open questions.
Processing of Sound Location in the AC of Blind Humans
In addition to the reduced response to sound in the medial temporal cortex of blind participants, the multivariate across-subject classification approach revealed that fMRI activation patterns in PT for spatial auditory processing were different for sighted and blind participants. Further, using a 2-channel, opponent coding model to decode the sound azimuth trajectory from the population BOLD activity, we showed that BOLD time courses in the AC of sighted individuals carry level-invariant representations of sound location, while the BOLD time courses in blind individuals conveyed less accurate information on sound azimuth position. These findings are in line with studies of auditory motion processing in blind individuals, which report reduced classification accuracies for the direction of motion based on activity in PT in blind individuals in comparison with sighted controls (Jiang et al. 2014; Dormal et al. 2016; Jiang et al. 2016).
Importantly, the reduced availability of spatial information in PT of blind individuals was not the result of a general lower signal-to-noise ratio in this participant group: The univariate analyses of the BOLD responses to sound—independent of sound location—confirm that the level of activation in the AC of sighted and blind individuals is comparable in the posterior AC (i.e., where we observed the differences in spatial sensitivity). An analysis of the binaural recordings of sighted and blind participants indicates that this finding is not caused by differences in the stimuli of the 2 groups either: ILDs, ITDs, and spectra are statistically similar for the binaural recordings of the 2 groups (Figs. 1 and 2; for detailed statistical results, see Supplementary Tables 1–4). Note that it is also unlikely that the presence of minimal light sensitivity in some of the blind participants underlies the observed differences between sighted and blind participants. Specifically, a multidimensional scaling analysis of the fMRI activity patterns shows that the patterns of sighted and blind participants are different (i.e., they form separate clusters; see Supplementary Materials and Supplementary Figure 5), confirming the results of the MVPA. In contrast, the activity patterns of blind participants with and without minimal light sensitivity cluster together, indicating that there is no major difference in the fMRI patterns of these groups. In addition, there is no theoretical reason to assume that the presence of minimal light sensitivity would be related to the processing of binaural information in AC as participants with minimal light perception cannot perceive shape, form, movement, or any type of pattern vision. For this reason, participants with minimal light sensitivity have been included in numerous auditory studies with blind participants (e.g., Gougoux et al. 2004; Gougoux et al. 2005; Collignon et al. 2011; Wolbers et al. 2011; Jiang et al. 2014; Dormal et al. 2016; Jiang et al. 2016).
Importantly, the reduced availability of information on sound azimuth position in the AC of blind participants does not necessarily imply that blind individuals localize sounds less accurately. In particular, several behavioral studies show that blind participants have a higher localization acuity in the horizontal plane (Rauschecker and Kniepert 1994; Lessard et al. 1998; King and Parsons 1999; Röder et al. 1999; Voss et al. 2004; Gougoux et al. 2005; Voss et al. 2015), although this is still debated (Zwiers et al. 2001a, 2001b; Lewald 2002a). Similarly, auditory motion perception is superior in blind humans (Lewald 2013) despite reduced motion processing in PT in this group, as described above (Jiang et al. 2014; Dormal et al. 2016; Jiang et al. 2016). Instead, one possible explanation for the observed difference between sighted and blind humans for sound azimuth processing based on binaural disparity cues is that blind humans may come to rely on different cues for sound localization. Voss et al. (2015), for instance, propose that (a subgroup of) blind humans utilize monaural, spectral cues—which are used for vertical sound localization by sighted humans—for horizontal sound localization. This hypothesis is based on studies showing that (some) blind humans have lower absolute localization acuity in the vertical plane than sighted humans (Zwiers et al. 2001a; Lewald 2002b; Voss et al. 2015). Moreover, Voss et al. (2015) demonstrate a trade-off between localization acuity in the horizontal plane and the vertical plane for blind participants. Specifically, in their study, a subgroup of blind individuals exhibited high localization performance in the horizontal plane when relying on monaural spectral cues but low localization performance in the vertical plane when utilizing these monaural cues. Other blind participants exhibited the opposite pattern. This indicates that a subgroup of the participants learned to localize sounds in the horizontal plane with the help of monaural spectral cues and that this process resulted in reduced use of these cues for vertical sound localization. Thus, the apparent reduction of processing of binaural spatial cues in PT may be caused by an increased reliance of (some of the) blind participants on spectral cues for localization in the horizontal plane. Note that the binaural recordings used in the present study indeed contained spectral variation as a function of azimuth (Fig. 2; see Methods).
However, an argument against the use of spectral cues for horizontal sound localization by blind individuals comes from studies testing sound location and auditory motion perception with band-pass filtered stimuli. That is, although narrowband sound limits the availability of spectral cues, studies using such sounds did not find a reduction in performance for blind participants in comparison with sighted participants (Lewald 2002a; Lewald 2013). Yet, this would be expected if blind humans do rely more on monaural spectral cues for horizontal localization than sighted humans. It is also conceivable that, instead of one set of cues replacing another set of cues, blind humans become adept at using a richer set of cues for horizontal localization, including both binaural and spectral cues. Based on the availability and reliability of each set of cues, it may be possible to “switch” between cues or to weigh a specific set of cues more than another. Alternatively, instead of reflecting the reliance on a different set of cues for sound localization, our findings might also reflect a difference in underlying neural mechanisms in the AC of blind participants. It has been shown, for instance, that visual deprivation leads to greater spatial selectivity in the AC of cats (Korte and Rauschecker 1993). Possibly, this resulted in different neural sound location encoding strategies that are not well described by the 2-channel, opponent coding model that we tested here. Future research combining psychophysics and neuroimaging methods are thus needed to test the validity of these hypotheses.
Engagement of Visuospatial Regions in Sighted Controls
Finally, there was a bilateral cluster of activation in pCC in sighted controls that was not present in blind individuals (but note that the between-group difference was not significant; see Fig. 3). pCC has been implicated in a number of functions that have a visual and (or) spatial component, including visual sensory processing, (spatial) memory retrieval, (spatial) mental imagery, monitoring of eye movements, and the allocation of spatial attention based on spatial predictive cues (e.g., Vogt et al. 1992; Small et al. 2003; Sugiura et al. 2005; Beckmann et al. 2009). Although it cannot be inferred with certainty from the present data, it is conceivable that the clusters of activation observed in the sighted controls reflect one or more of these visuospatial processes. For instance, sighted participants may be imagining a visual representation of the sound trajectory while listening to the moving sounds. Possibly, pCC is not activated strongly in blind participants due to the visual nature of the spatial processing taking place in this region.
The Effect of Minimal Visual Stimulation
A potential limitation of the present study is that sighted controls were not blindfolded. Instead, sighted participants fixated on a small, white fixation cross in the center of a black screen while lying in the MRI scanner with the light dimmed. This was done to minimize the influence of eye movements on the fMRI activity measured in the sighted participants. Since the stimuli are spatialized sounds that move through the horizontal plane, it is possible that sighted individuals would make spontaneous saccades toward the location of the sound source if not explicitly instructed not to do so. Such eye movements would be directly correlated with the presentation of the stimuli, making it near impossible to disambiguate their modulatory effect from the actual spatial auditory processing taking place. We therefore asked participants to fixate, while minimizing visual input as much as possible. Importantly, the visual input was stationary and continuous and had no spatial component.
As a consequence, the conditions were not completely identical between the groups, and it can be argued that this may have had an effect on the measured fMRI activity. If so, this effect would be expected most directly in the visual cortex. Yet, our results show that there was no significant activation in the occipital cortex of sighted participants (Fig. 3, top row), confirming the minimal nature of the visual stimulation. Moreover, our results indicate stronger activation in the occipital cortex in blind rather than in sighted participants (Fig. 3, bottom row), an effect in the opposite direction. These findings replicate the cross-modal activation of occipital cortex in blind participants that has been demonstrated a number of times (e.g., Weeks et al., 2000; Renier et al., 2010) and suggest that the influence of presenting a fixation cross on sighted controls was negligible.
It should furthermore be noted that the research question and main findings of the present study concern spatial auditory processing. To the best of our knowledge, there is no theoretical reason to assume that the presentation of a minimal visual stimulus without spatial component affects the neural encoding of sound location in the temporal cortex, and there is no direct link between the presentation of the fixation cross and any of the main findings. Thus, although the experimental conditions were not fully identical, we do not expect that this has a major impact on either the results regarding cross-modal activation of the visual cortex (as the pattern of results was in the opposite direction), or the results regarding spatial auditory processing (as there is no theoretical reason to assume a link between the presentation of a small fixation cross and sound location processing in the temporal cortex).
Conclusion
Taken together, our findings demonstrate that early visual deprivation in humans induces functional plasticity for general auditory processing in both the occipital and medial temporal cortices and specifically for binaural spatial processing in PT.
Funding
The European Research Council under the European Union’s Seventh Framework Programme (FP7/2007-2013; ERC grant agreement number 295673 to B.d.G.); the European Union’s Horizon 2020 Research and Innovation Programme (under grant agreement no. 645553; ICT DANCE (IA, 2015–2017; to B.d.G.); the Netherlands Organization for Scientific Research (NWO; grants 480-09-006 and 453-12-002 to E.F.); the Lundbeck Foundation, Denmark (R.K.).
Notes
Conflict of Interest: None declared.