


Abstract
Self-reported abnormal sensitivity, qualitative distortions and phantom sensations with respect to smell and taste was assessed with a longitudinal design, based on questions referring to gestational weeks 13–16 and 31–34 of pregnancy in comparison with 9–12 weeks post partum and with non-pregnant women with corresponding time durations and intervals. The results show that abnormal smell and/or taste perception was reported by 76% of the pregnant women, typically believed to be caused by their pregnancy. Increased smell sensitivity was found to be very common at the early stage of pregnancy (67% of all pregnant respondents) and occasionally accompanied by qualitative smell distortions (17%) and phantom smells (14%). The smell abnormalities were less common at the late pregnancy stage and almost absent post partum. Abnormal taste sensitivity was fairly commonly reported (26%), often described as increased bitter sensitivity and decreased salt sensitivity. These results, suggesting that abnormal smell and/or taste perception is experienced by a large majority of pregnant women, imply that further research is needed to understand to what extent these chemosensory changes may underlie food aversions and craving with implications for food intake during pregnancy.
Introduction
It was early documented that most women experience food cravings and food aversions during pregnancy, with rates ranging from ∼50–90% for reporting one or both conditions (Taggert, 1961; Dickens and Terthowan, 1971; Hook, 1978; Worthington-Roberts et al., 1989; Bayley et al., 2002). From a retrospective questionnaire study it was reported that dietary changes were related to olfactory perception, that 64% of the pregnant women claimed to have had changes in olfactory perception, typically an increased general responsiveness to odors and that 75% changed their dietary habits during pregnancy. The authors also reported a positive correlation between frequency of changes in olfactory perception and changes in dietary habits (Cantoni et al., 1999). Studies of odor hedonics have shown that pregnant women, compared to non-pregnant women, rate certain common odorants (e.g. alcohol, cigarette butt, coffee) as less pleasant, whereas other odors are more often classified as inedible (Gilbert and Wysocki, 1991; Laska et al., 1996; Cantoni et al., 1999; Kölble et al., 2001).
Although past research implies an association in pregnant women between abnormal odor perception and how they relate to food, it is less clear how olfaction changes during this course. For example, a longitudinal study with functional testing could not provide evidence of any systematic shift in olfactory function during pregnancy (Laska et al., 1996). Early cross-sectional psychophysical studies of olfaction in pregnancy favor the notion of hypersensitivity in the early stages of pregnancy and hyposensitivity in later stages (Henssge, 1930; Hansen and Glass, 1936; Noferi and Giudizi, 1946; Le Magnen, 1952; Luvara and Murizi, 1961), but the picture is not conclusive (Schmidt, 1925; Good et al., 1976). To overcome difficulties in integrating results from cross-sectional studies of different individuals, different test periods during pregnancy and different methodologies, it is necessary to apply a longitudinal design. With focus on the pregnant women’s experience of their sense of smell, one purpose of the present study was to assess self-reported smell abnormalities in these women over the course of pregnancy and post partum.
Previous research has also directed attention towards taste perception in pregnancy. It was reported from a cross-sectional questionnaire study that 93% of the pregnant women experienced some sort of change in taste perception during pregnancy, although the authors did not specify the kind of change. Among the women with taste changes, 98% reported having noticed the change during the first trimester (Kuga et al., 2002).
As for olfaction, results from, predominantly cross-sectional, functional testing of taste during pregnancy are not consistent. Increased detection sensitivity for bitter and sweet stimuli during the first trimester have been reported (Bhatia and Puri, 1991) as well as increased unpleasantness for bitter stimuli during the first trimester and that unpleasantness for sour stimuli increased as pregnancy proceeded (Duffy et al., 1998). In contrast, results from other studies suggest a decrease in taste sensitivity. Thus, poor detection sensitivity for bitter, sweet, salty and sour stimuli, in particular during the first trimester has been reported (Kuga et al., 2002). Moreover, salty foods have been rated as less salty in the third compared to the second trimester (Bowen, 1992) and poor salt intensity discrimination and preference for stronger salt concentrations have been found in pregnant women (Brown and Toma, 1986). Kölble et al. (2001) reported that women in the first trimester of pregnancy were poorer than non-pregnant women in identifying, in particular, bitter stimuli of various concentrations, but also sweet, salty and sour stimuli. Against this background it is clear that further longitudinal data is needed on abnormalities in taste during pregnancy and post partum.
By applying a longitudinal design, the objectives of the present study was to describe self-reported abnormal smell and taste perception, with respect to abnormal sensitivity, qualitative distortion and phantom sensations, as well as causes for these abnormalities given by the pregnant women at a relatively early (gestational weeks 13–16) and late (weeks 31–34) stage of pregnancy in comparison with 9–12 weeks post partum and in comparison with non-pregnant women at corresponding time durations and intervals. To obtain information about these specific time periods, the participants responded to questions that referred to conditions during the previous month at the gestational weeks of 16 (the earliest week that the pregnant women could be recruited) and 34, and 12 weeks post partum (chosen to obtain a constant time interval between assessments).
Materials and methods
Participants
One-hundred and eighty-seven pregnant women who were attending routine ultrasound examination at the Department of Obstetrics and Gynecology, Umeå University Hospital were invited to participate in the present study, of which 161 agreed to volunteer (13 dropped out due to miscarriage, three due to language difficulties, 10 for unknown reasons). Of these, 144 pregnant women responded to and returned the first questionnaire and 126 women (mean age = 29.7, SD = 4.6 years) were included in further data analysis for having remained pregnant over the first two assessments but not at the third and for having completed at least two of the three questionnaires. One-hundred fourteen pregnant women completed all three questionnaires, nine completed the first and second and three completed the first and third questionnaire. Thus, 126, 123 and 117 pregnant women completed the first, second and third questionnaire, respectively. Seventy-two of these pregnant women reported having previously been pregnant (mean = 1.88, SD = 1.29 times) and 54 of them had given birth earlier (mean = 1.54, SD = 0.74 times).
Eighty non-pregnant women were recruited, predominantly through newspaper advertisement and flyers, with the aim of being comparable to the group of pregnant women with respect to age and smoking habits. Seventy-six (mean age = 28.5, SD = 3.1 years) of them, included in further data analysis, remained non-pregnant throughout the study and completed at least two of the three questionnaires. Of these, 71 women completed all three questionnaires, four completed the first and second and one completed the first and third questionnaires. Thus, 76, 75 and 72 non-pregnant women completed the first, second and third questionnaires, respectively. Four of the non-pregnant women reported having previously been pregnant once, but none of them had given birth. The number of pregnant participants was larger than that of non-pregnant participants because the former group was expected to be more heterogeneous with respect to changes in smell and taste.
The validated Multi-Center Smell and Taste Questionnaire (MCSTQ; Nordin et al., 2003) was applied to assess the number of participants in the two groups who reported frequent or chronic conditions within the previous 2 years with potential effects on smell and taste functions. These conditions, presented in Table 1, were in general fairly low in prevalence and comparable between groups. The two groups are described further in Table 2 with respect to additional variables of relevance for smell and taste perception (MCSTQ), that were assessed at all three questionnaire assessments. The groups are in general very comparable with respect to these variables. However, abnormal saliva — also reported by Kuga et al. (2002) specifically as the feeling of dry mouth — and smoking were more commonly reported by the pregnant women, compared to the non-pregnant (all participants reported smoking <1 pack/day).
The study was conducted in accordance with the Declaration of Helsinki and approved by the Ethics Committee of the Faculty of Medicine and Odontology, Umeå University. All participants gave their informed consent to participate.
Questionnaire
Smell and taste perception was investigated by use of the MCSTQ (Nordin et al., 2003) with questions about the presence of abnormal sensitivity, qualitative distortions and phantom sensations within the previous month (response alternatives, yes/no), time since onset (0–3 months/4–6 months/7–12 months/>1 year), temporal development (suddenly/period of days/period of weeks) and fluctuations (yes/no) in these three conditions for both smell and taste. By asking how their smell and taste perception had been during the previous month at the gestational weeks of 16 and 34 and 12 weeks post partum, the responses were assumed to refer to the gestational week periods of 13–16 and 31–34 and 9–12 weeks post partum. The questionnaire also describes for the respondent the meaning of the terms smell sensitivity (‘How strong you perceive things to smell’), distorted smell (‘Certain things smell qualitatively different from what they usually do; for example, a perfectly normal orange smells like mud’), phantom odor (‘You perceive a smell although there is nothing to produce the smell’) and taste sensitivity, distorted taste and phantom taste in a similar manner.
Qualitative distortions and phantom sensations were further studied regarding strength (weak/moderate/strong), distortions also regarding pleasantness (pleasant/neutral/unpleasant) and phantom sensations also regarding length of a typical episode (fleeting/minutes/hours/all day) and quality (smell, infected tissue or mucus/smoky or burnt/fecal or rotten/musty/moldy/metallic; taste, salty/sweet/sour/bitter/metallic; several alternatives could be chosen). For more specific information about abnormal sensitivity within the previous month (no change/weaker-/stronger-than-normal sensations), questions were stated that refer to specific odorants and tastants (salt, sugar, lemon or similar sour, coffee, or similar bitter, metal). Finally, the participants were asked how the abnormalities started regarding smell (sinus infection, nasal polyps or tumor/allergy or hypersensitivity/upper respiratory infection/chemical exposure/other disease/head trauma/medication/congenital/pregnancy/surgery/stroke/other) and taste (mouth infection/chronic disease/head trauma/radiation treatment/dental problems or adjustments/chemical exposure/other disease/medication/congenital/pregnancy/surgery/stroke/other). The participants were mailed the questionnaires, instructed to respond to them during a certain week and to return the completed questionnaire by mail.
Results
Abnormal sensitivity
Table 3 presents percentages of participants who at the three assessments reported any abnormal smell and taste sensitivity within the previous month. For these individuals with abnormalities, the table also gives their distribution regarding time since onset, temporal development and fluctuations in sensitivity at each of the three assessments. The results show that ∼2/3 and 1/3 of the pregnant women reported abnormal smell sensitivity at gestational week 16 (covering to weeks 13–16) and 34 (covering weeks 31–34), respectively. In contrast, this prevalence was very low post partum and in non-pregnant women at all three assessments. Regarding taste, ∼1/4 and 1/8 of the pregnant women reported abnormal sensitivity at week 16 and 34, respectively. Again, the prevalence was very low post partum and in non-pregnant women at all assessments. Whereas a very large percentage of the pregnant women at gestational week 16 reported the time since onset of the abnormal smell (96.3%) and taste (90.1%) sensitivity to have been within the previous 3 months, the time of onset was distributed across longer time intervals at gestational week 34. The abnormalities in both smell and taste sensitivity were reported to have developed predominantly over a period of days and weeks and to fluctuate among a majority of the pregnant women. The low prevalences of abnormal smell and taste sensitivity post partum and in the non-pregnant women do not allow reliable descriptions regarding time since onset, temporal development or fluctuations.
Prevalence of stronger-than-normal smell sensation for various odorous substances is presented in Figure 1. In pregnant women at gestational week 16, these prevalences vary between 9.5 and 53.8%, depending on substance and between 6.6 and 26.2% at week 34, whereas they were zero or close to zero post partum and in non-pregnant women at all assessments (0–3.4%). In contrast, prevalences of weaker-than-normal smell sensation for the various substances were very low in both groups at all three assessments (0–2.6%).
Table 4 presents prevalences for stronger- and weaker-than-normal taste sensations. In comparison to non-pregnant women and post partum, the prevalences for stronger-than-normal sensation for bitter stimuli (coffee) and weaker-than-normal sensation for salt are relatively high, in particular at gestational week 16. Although less distinct, the prevalences at week 16 are somewhat elevated for stronger-than-normal sensation for sour stimuli (lemon), sugar and metal, as well as weaker-than-normal sensation for sour.
Qualitative distortions
Results on qualitative smell and taste distortions are presented in Table 5 for variables corresponding to those in Table 3 on abnormal sensitivity. In addition, the table contains results pertaining to strength and pleasantness. Smell distortions were reported by ∼1/6 of the pregnant women at gestational week 16, to be compared with considerably lower prevalences at gestational week 34 and post partum and in non-pregnant women. As opposed to smell, taste-distortion prevalences were fairly low at all three assessments in both pregnant and non-pregnant women. All pregnant women with smell distortions at gestational week 16 reported the time of onset to be within the previous 3 months and a majority of them reported that the distortions had developed over a period of days and weeks, to fluctuate in strength, to be moderate/strong in strength, and to be unpleasant.
Phantom sensations
Table 6 shows results for phantom sensations for variables corresponding to those in Table 5, with the addition of variables for length of typical episode and quality, but not including pleasantness. Phantom smells were reported by ∼1/7 of the pregnant women at gestational week 16, whereas this proportion was considerably lower at week 34 as well as post partum and in non-pregnant women. Prevalence of phantom taste was rather low at both week 16 and 34, although somewhat higher than at post partum and in non-pregnant women. All pregnant women who reported phantom smells at gestational week 16 stated that the time of onset was within the previous 3 months and a large percentage of them reported that the phantom smells had developed over a period of days and weeks, to fluctuate in strength, to be moderate in strength, to typically be fleeting in length and to have a sensation quality described as fecal or rotten.
Consistency of abnormalities across pregnancy
The number of pregnant women who at gestational week 34 reported abnormal smell sensitivity and who also had reported this condition at week 16 was 33 out of 40. This ratio was 4/9 for smell distortion, 3/9 for phantom smell, 11/16 for abnormal taste sensitivity, 3/7 for taste distortion and 3/8 for phantom smell.
Combinations of smell and taste abnormalities
Eighty-six (68.3%) of the pregnant women reported at least one of the three types of smell abnormality at gestational week 16, whereas 39 (31.7%) of them reported this at week 34 and six (5.1%) of them post partum. Corresponding numbers of non-pregnant women for the three assessments were nine (11.8%), four (5.3%) and three (4.2%), respectively. At least one type of taste abnormality was reported by 35 (27.8%) pregnant women at gestational week 16, 22 (17.9%) of them at week 34 and four (3.4%) post partum. For non-pregnant women, these numbers were seven (9.2%), zero and four (5.6%), respectively. Furthermore, 73.8% of the participating pregnant women and 14.5% of the non-pregnant women reported any type of smell abnormality during pregnancy or corresponding period (first and/or second assessment). Corresponding percentages for any type of taste abnormality are 36.5 and 10.5%, respectively. Overall, 76.2% of the pregnant women and 18.4% of the non-pregnant women reported any type of smell and/or taste abnormality during pregnancy or corresponding period.
With one exception for smell, none of the pregnant women reported neither quality distortions nor phantom sensations in smell or taste that was not accompanied by abnormal sensitivity for that sensory modality. At gestational week 16, 22.2% of the pregnant women had abnormal sensitivity in both smell and taste (with our without other abnormalities), which fell to 11.4% at week 34.
Associations between abnormalities and pregnancy
Thirty-seven pregnant women reported at gestational week 16 and 18 pregnant women at week 34 that their smell abnormalities had started with their pregnancy. These numbers for other self-reported causes for smell abnormalities were 2 and 0 for upper respiratory infection, 1 and 1 for allergy/hypersensitivity, 0 and 1 for medication and 3 and 0 for other reasons. None of the pregnant women reported that their smell abnormalities had started with sinus infection, nasal polyps or tumor, chemical exposure, other disease, head trauma, surgery, stroke, or that it was congenital.
Regarding taste abnormalities, 16 and 13 pregnant women reported at gestational weeks 16 and 34, respectively, that their abnormalities had started with their pregnancy. Corresponding numbers were 2 and 0 for mouth infection, 1 and 0 for chronic disease, 0 and 1 for other disease and 1 and 0 for other reasons, whereas none of the pregnant women reported head trauma, radiation treatment, dental problems or adjustments, chemical exposure, medication, surgery, stroke, or congenital condition as cause for the abnormalities.
Discussion
It was demonstrated in the present study of self-reported smell and taste perception during an early (covering gestational weeks 13–16) and a late (weeks 31–34) stage of pregnancy that abnormality in smell or taste of any kind (sensitivity, qualitative distortion and phantom sensation) is present in a considerable proportion of pregnant women (>3/4), but far less so in non-pregnant women (∼1/6 for corresponding period) and that this proportion is much larger for any kind of abnormality in smell (almost 3/4) than in taste (∼1/3). The self-reported prevalence for smell is similar to that obtained by Cantoni et al. (1999) of 68%, whereas that for taste is considerably lower than that reported by Kuga et al. (2002) of 93%. Because the latter authors have not described the question used to assess taste perception, it is difficult to explain this discrepancy for taste compared to our data.
More specifically, abnormal smell sensitivity was reported by a majority (∼2/3 of the women) at the early stage of pregnancy, which had decreased considerably at the late stage (∼1/3), and approached absence after pregnancy (9–12 weeks post partum). These findings of abnormal smell sensitivity predominantly early in pregnancy are in accordance with previous self-reported longitudinal (Cantoni et al., 1999) and cross-sectional perceptual studies (Henssge, 1930; Hansen and Glass, 1936; Noferi and Giudizi, 1946; Le Magnen, 1952; Luvara and Murizi, 1961).
As a further comparison, prevalence of abnormal smell sensitivity in non-pregnant women was found to be close to zero at all three corresponding time durations and intervals. This provides evidence that abnormality in smell sensitivity is very common early in pregnancy, that it declines in prevalence during the course of pregnancy and returns to normal after delivery.
The abnormal smell sensitivity was almost exclusively described as odorous substances being perceived as stronger than normal, rather than weaker than normal. The 14 specific substances that the participants were asked about can be considered to represent a rather broad range of chemosensory qualities, including floral, fruity, sweet, woody, spicy, minty and pungent. The latter quality is produced by nasal chemesthesis from stimuli such as smoke, perfume, ammonia and menthol (Doty and Cometto-Mu-iz, 2003). Despite this broad range in quality, hypersensitivity was quite commonly reported for all substances. The variability between substances may partly be referred to how commonly the women had been exposed to the substances. Thus, it is probably less likely that relatively uncommon substances (e.g. fire smoke) will be remembered as having been perceived as stronger than normal, compared to relatively common substances (e.g. cooking odors). Although results from perceptual studies are far from conclusive, they provide certain support for the notion that pregnant women perceive some odorous substances, but not all, as stronger or more unpleasant than do non-pregnant women (Gilbert and Wysocki, 1991; Laska et al., 1996; Kölble et al., 2001). Although further data are needed from studies with presented odorous substances before a more definite statement can be made, the present and past findings may suggest that those pregnant women who experience abnormal smell sensitivity are likely to be hypersensitive to odorous substances in general, but perhaps more sensitive to certain substances than to others.
Qualitative smell distortions (in ∼1/6 of the women) and phantom smells (∼1/7) were, compared to abnormal smell sensitivity, found to be far less commonly reported during early pregnancy, but can, nevertheless, be considered to constitute substantial proportions of these women. However, the proportions fell considerably during the late stage of pregnancy and were at post partum comparable with those obtained in non-pregnant women at all three assessments. It can be claimed that smell distortions and phantom smells are difficult concepts to respond to for most lay persons, which would contribute to poor validity and reliability in the prevalence data. However, previous comparisons of prevalences obtained from questionnaires and interviews (the latter enabling the interviewer to ensure that the respondent adequately understands the questions and that the interviewer understands the answers), suggests that the questionnaire-based questions about distortions and phantom smells are comprehensible, and have also been shown to have good test–retest reliability (Nordin et al., 1996, 2003).
Abnormal smell perception with respect to sensitivity, qualitative distortions and phantom smells were reported by the pregnant women to have developed over a period of days and weeks and to commonly fluctuate. The distortions were also found to be moderate or strong in strength and to be unpleasant and the phantom smells were typically fleeting in length and described as fecal or rotten. These findings imply that the gradually developing and fluctuating smell sensations are rather annoying in a substantial proportion of pregnant women.
An important question regards the biological meaning of changes in smell perception during pregnancy, in particular during the early stage. It has been proposed that nausea and vomiting during pregnancy serves a protective function for the embryo by inducing aversions (commonly induced by smells) against certain foods, causing pregnant women to physically expel and thereby avoid foods that contain teratogenic and abortifacient chemicals. Foods (in a broad sense) of this kind would according to the ‘embryo protection’ hypothesis include tobacco, alcohol, caffeinated beverages (Hook, 1978) and certain vegetables with bitter taste and pungent spices (Profet, 1992). A meta-analysis of studies of nausea, vomiting and aversions during pregnancy and temporal relations between nausea/vomiting and vulnerable periods for embryo development during early pregnancy provides strong evidence for embryo, but also maternal protection (Flaxman and Sherman, 2000). Bearing in mind that olfaction is considered an effective warning system for potentially toxic substances (Engen, 1986), an increase in perceived intensity would provide the pregnant women with better protection against toxic substances during the critical phase of fetal development. Indeed, in accordance with the protection hypothesis, the odors of cigarette smoke, alcohol, coffee and spices and the taste of bitter were in the present study commonly reported as being perceived as stronger than normal during early pregnancy.
Whereas it may be difficult to explain the meaning of phantom smells during pregnancy, it is possible that the distortions of smells from odorous substances provide further protection against toxic substances by generating unexpected smell qualities. Thus, it can be speculated whether unexpected smell qualities, known to increase both arousal and unpleasantness from the smell (Engen, 1982), may function as an additional warning signal during pregnancy.
As briefly mentioned above, results from the present investigation suggest that abnormal taste sensitivity is present in a certain proportion of pregnant women during early pregnancy (in ∼1/4), that it declines in prevalence at a late pregnancy stage (to ∼1/8) and that it returns to normal after delivery. A decline in prevalence of this kind over time was also reported by Kuga et al. (2002). However, it cannot be excluded that the decline in prevalence in both taste and smell abnormalities across the course of pregnancy partly is due to habituation to these conditions.
The results do further suggest that the bitter taste of coffee (or similar bitter tastants) is rather commonly perceived as stronger than normal in early pregnancy. This finding corresponds well with previous research suggesting increased detection sensitivity for bitter stimuli (PTC) during the first trimester of pregnancy (Bhatia and Puri, 1991). Duffy et al. (1998) found elevated ratings of intensity and disliking for bitter stimuli (QHCL) in the first trimester and in accordance with olfaction they suggested that an increase in bitter intensity during the first trimester helps pregnant women to avoid poisons during a critical phase of fetal development. We did also find that salt was reported as being weaker than normal during pregnancy. In accordance with this, Brown and Toma (1986) found poor intensity discrimination and increased preference for salt solutions during pregnancy, and Duffy et al. (1998) have obtained decreased intensity rating for salty stimuli. It is well documented from animal models that salt intake increases during pregnancy (Clarke and Bernstein, 2001), with also has been reported for pregnant women (Bowen, 1992) According to Duffy et al. (1998), a reduction in perceived intensity for salt during pregnancy may allow the pregnant women to ingest sufficient electrolytes to expand fluid volume and to ingest a varied diet to support weight gain. Coffee and lemon were chosen in our study to represent bitter and sour stimuli because these items they are commonly consumed. However, these representations call for certain caution as they, unlike salt and sugar, are not pure tastants. Thus, when taken orally they do also evoke smell sensations by means of retronasal passages to the nasal cavities. Not surprisingly, while patients at ear, nose and throat clinics often present with the complaint of taste loss, quantitative testing usually reveals only an olfactory problem (Burdach and Doty, 1987). Hence, it is quite possible that the reported stronger than normal taste sensations from coffee may to some extent be explained by hypersensitivity to the smell of coffee.
As for abnormal smell sensitivity, abnormal taste sensitivity appears to develop over a period of days and weeks and to commonly fluctuate during pregnancy. However, in contrast to smell, the pregnant women did not seem to experience qualitative taste distortions or phantom tastes.
Regarding consistency across the course of pregnancy, rather few pregnant women seem to develop abnormal smell and taste sensitivity at a late stage of pregnancy. In those cases these abnormalities in sensitivity are present late in pregnancy, they have typically been present also at an early stage. This consistency over time does not appear to be typical for smell distortions and phantom smells. Although these abnormalities were also most common early in pregnancy, those women who reported these conditions at a late stage had typically reported that they were not present at the early stage of pregnancy. The results do also clearly suggest that quality distortions and phantom sensations in smell and taste are almost exclusively accompanied by abnormal sensitivity in corresponding sensory modality.
There is strong reason to believe that the smell and taste abnormalities found in the present study can be tied to pregnancy. Apart from the general finding that these abnormalities are far more commonly reported by pregnant women than by non-pregnant women and post partum, the self-reported causes for these abnormalities and responses regarding time since onset provide further support for this conclusion. Although a limited number of the pregnant women with smell and taste abnormalities responded to the questions of how these abnormalities started (possibly due to these questions being difficult to respond to with certainty), a large majority of those who responded did indeed report that the abnormalities started because of their pregnancy. Further support for an association between smell/taste abnormalities and pregnancy is found in these women’s responses about time since onset of the abnormality. Almost all pregnant women who reported a smell abnormality at gestational week 16 did also report an onset within the previous 3 months. In a similar vein, 90% of the women with abnormal taste sensitivity in early pregnancy reported an onset within the previous 3 months. Furthermore, when asked at the late stage of pregnancy, all women, with one exception, reported an onset within the past 12 months.
The pregnant women in the present study can be considered to fairly well represent the population of pregnant women. Thus, a large proportion of those who never participated or terminated participation did so due to miscarriage. Furthermore, although the participants did not responded to all questions requested for, as can be observed in the tables, the response rates are in general very high. This implies that the results well represent the participating women’s experience with their smell and taste perception.
In conclusion, the present results suggest that abnormal smell and/or taste perception is experienced by a large majority of pregnant women. Increased sensitivity to odorous substances in general appears to be typical during an early stage of pregnancy and in some women accompanied by qualitative smell distortions and phantom smells. These smell abnormalities become less common at a late pregnancy stage and are absent in almost all pregnant women 2–3 months after delivery. Regarding taste perception, increased bitter sensitivity and decreased salt sensitivity was found to be fairly commonly reported, predominantly at an early stage of pregnancy, but not after delivery. In contrast, prevalences of taste distortions and phantom tastes were very low and similar to those for non-pregnant women. The pregnant women typically stated pregnancy as the cause for their smell and taste abnormalities and described that the abnormalities developed gradually, fluctuated in magnitude and were rather unpleasant. The abnormalities in smell and taste during pregnancy may be explained by feto-protective mechanisms to avoid poisons and by enhanced ingestion of sufficient salt level to expand fluid volume and to ingest a varied diet.
Acknowledgements
This study was supported by grants from the Swedish Research Council. We are grateful to Eva Bringlöv, Anette Jonsson and Kristin Lagerkrantz for excellent assistance.
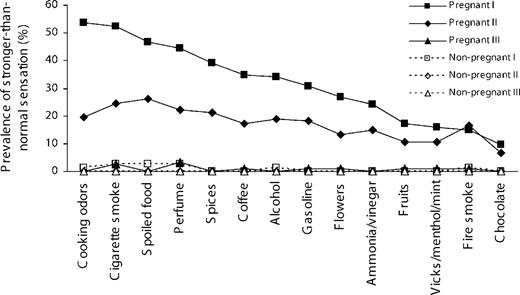
Figure 1 Percentage of pregnant women who at gestational week 16 (I) and 34 (II) and 12 weeks post partum (III) reported stronger-than-normal smell sensation for various odorants during the previous month.
Percentage (and number) of pregnant and non-pregnant women who in the first questionnaire reported various frequent or chronic conditions (within the past 2 years) with potential effects on smell and taste perception
| Pregnant (n = 126) | Non-pregnant (n = 76) | |
| Sinus infection | 4.0 (5) | 1.3 (1) |
| Problems breathing through nose | 6.3 (8) | 3.9 (3) |
| Nasal polyps | 0 | 0 |
| Deviated septum | 0 | 2.6 (2) |
| Allergy | ||
| Seasonal | 21.4 (27) | 18.4 (14) |
| Perennial | 17.5 (22) | 18.4 (14) |
| Medication | 4.8 (6) | 5.3 (4) |
| Allergic nasal symptoms | 11.1 (14) | 9.2 (7) |
| Chemical exposure | ||
| Herbicides/pesticides | 0 | 0 |
| Acid fumes | 0 | 1.3 (1) |
| Industrial solvents/cleaning products | 1.6 (2) | 1.3 (1) |
| Head trauma | 5.6 (7) | 6.6 (5) |
| Facial injury | 3.2 (4) | 0 |
| Epilepsy | 0 | 0 |
| Stroke | 0 | 0 |
| Diabetes mellitus | 0.8 (1) | 0 |
| Cystic fibrosis | 0 | 0 |
| Alcohol or drug abuse | 0 | 0 |
| Depression | 6.3 (8) | 9.2 (7) |
| Sjögren’s syndrome | 0 | 0 |
| Surgery | ||
| Nasal polypectomy | 0 | 0 |
| Deviated septum repair | 0 | 1.3 (1) |
| Mouth surgery | 1.6 (2) | 2.6 (2) |
Percentage (and number) of pregnant women who reported abnormal mouth sensations, abnormal saliva and being a smoker and distribution of levels of general health at gestational weeks 16 (I) and 34 (II) and 12 weeks post partum (III)
| Pregnant | Non-pregnant | ||||||
| I (n = 126) | II (n = 123) | III (n = 117) | I (n = 76) | II (n = 75) | III (n = 72) | ||
| Abnormal mouth sensations | 4.8 (6) | 5.7 (7) | 0 | 1.3 (1) | 1.3 (1) | 0 | |
| Abnormal saliva | 11.1 (14) | 9.8 (12) | 1.7 (2) | 1.3 (1) | 1.3 (1) | 0 | |
| Presently smoking | 6.3 (8) | 5.7 (7) | 7.7 (9) | 2.6 (2) | 2.7 (2) | 1.4 (1) | |
| General health | |||||||
| Poor | 4.9 (6) | 3.3 (4) | 0.9 (1) | 0 | 2.7 (2) | 2.9 (2) | |
| Not so good | 17.9 (22) | 16.4 (20) | 7.0 (8) | 17.1 (13) | 6.8 (5) | 7.4 (5) | |
| Fairly good | 36.6 (45) | 36.1 (44) | 25.2 (29) | 25.0 (19) | 24.3 (18) | 29.4 (20) | |
| Good | 25.2 (31) | 33.6 (41) | 40.0 (46) | 30.3 (23) | 47.3 (35) | 38.2 (26) | |
| Very good | 15.4 (19) | 10.6 (13) | 27.0 (31) | 27.6 (21) | 18.9 (14) | 22.1 (15) |
Corresponding data are given for non-pregnant women. Based on a gestational period of 40 weeks, the non-pregnant women followed the same intervals between assessments as the pregnant women
Percentage (and number) of pregnant women who at gestational week 16 (I) and 34 (II) and 12 weeks post partum (III) reported abnormal smell or taste sensitivity during the previous month
| Pregnant | Non-pregnant | ||||||
| I (n = 126) | II (n = 123) | III (n = 117) | I (n = 76) | II (n = 75) | III (n = 72) | ||
| Smell sensitivity | |||||||
| Any abnormality | 67.5 (85) | 32.5 (40) | 3.4 (4) | 6.6 (5) | 2.7 (2) | 0 | |
| Time since onset | |||||||
| ≤3 months | 96.3 (79) | 24.3 (9) | 25.0 (1) | 80.0 (4) | 100 (2) | – | |
| 4–6 months | 3.7 (3) | 24.3 (9) | 0 | 0 | 0 | – | |
| 7–12 months | 0 | 48.6 (18) | 75.0 (3) | 0 | 0 | – | |
| >1 year | 0 | 2.7 (1) | 0 | 20.0 (1) | 0 | – | |
| Temporal development | |||||||
| Suddenly | 26.8 (22) | 8.1 (3) | 25.0 (1) | 20.0 (1) | 50.0 (1) | – | |
| Period of days | 43.9 (36) | 29.7 (11) | 25.0 (2) | 60.0 (3) | 50.0 (1) | – | |
| Period of weeks | 29.3 (24) | 62.2 (23) | 50.0 (2) | 20.0 (1) | 0 | – | |
| Fluctuations in sensitivity | 61.0 (50) | 54.1 (20) | 75.0 (3) | 100 (5) | 100 (2) | – | |
| Taste sensitivity | |||||||
| Any abnormality | 26.2 (33) | 13.0 (16) | 3.4 (4) | 7.9 (6) | 0 | 1.4 (1) | |
| Time since onset | |||||||
| ≤3 months | 90.1 (30) | 31.2 (5) | 50.0 (1) | 100 (4) | – | 100 (1) | |
| 4–6 months | 9.1 (3) | 31.2 (5) | 0 | 0 | – | 0 | |
| 7–12 months | 0 | 37.5 (6) | 50.0 (1) | 0 | – | 0 | |
| >1 year | 0 | 0 | 0 | 0 | – | 0 | |
| Temporal development | |||||||
| Suddenly | 27.3 (9) | 12.5 (2) | 50.0 (1) | 75.0 (3) | – | 0 | |
| Period of days | 39.4 (13) | 12.5 (2) | 0 | 25.0 (1) | – | 100 (1) | |
| Period of weeks | 33.3 (11) | 75.0 (12) | 50.0 (1) | 0 | – | 0 | |
| Fluctuations in sensitivity | 66.7 (22) | 50.0 (8) | 100 (2) | 75.0 (3) | – | 100 (1) |
Percentage (and number) of pregnant women who at gestational weeks 16 (I) and 34 (II) and 12 weeks post partum (III) reported stronger- and weaker-than-normal taste sensations for various substances during the previous month
| Pregnant | Non-pregnant | ||||||
| I (n = 126) | II (n = 123) | III (n = 117) | I (n = 76) | II (n = 75) | III (n = 72) | ||
| Stronger-than normal taste sensation | |||||||
| Salt | 3.2 (4) | 2.4 (3) | 0 | 0 | 0 | 0 | |
| Sugar | 6.3 (8) | 4.9 (6) | 0 | 0 | 0 | 0 | |
| Lemon (or similar sour) | 7.9 (10) | 4.9 (6) | 0 | 0 | 0 | 0 | |
| Coffee (or similar bitter) | 18.3 (23) | 7.3 (9) | 0 | 0 | 0 | 0 | |
| Metal | 7.1 (9) | 4.9 (6) | 0 | 0 | 0 | 0 | |
| Weaker-than normal taste sensation | |||||||
| Salt | 9.5 (12) | 5.7 (7) | 1.7 (2) | 2.6 (2) | 0 | 1.4 (1) | |
| Sugar | 2.4 (3) | 2.4 (3) | 0.9 (1) | 2.6 (2) | 0 | 0 | |
| Lemon (or similar sour) | 5.6 (7) | 2.4 (3) | 0.9 (1) | 1.3 (1) | 0 | 0 | |
| Coffee (or similar bitter) | 0 | 1.6 (2) | 0.9 (1) | 1.3 (1) | 0 | 0 | |
| Metal | 0.8 (1) | 0 | 0.9 (1) | 0 | 0 | 0 |
Percentage (and number) of pregnant women who at gestational weeks 16 (I) and 34 (II) and 12 weeks post partum (III) reported qualitative smell or taste distortion during the previous month
| Pregnant | Non-pregnant | ||||||
| I (n = 126) | II (n = 123) | III (n = 117) | I (n = 76) | II (n = 75) | III (n = 72) | ||
| Smell distortion | |||||||
| Any abnormality | 17.5 (22) | 7.3 (9) | 0 | 5.3 (4) | 0 | 1.4 (1) | |
| Time since onset | |||||||
| ≤3 months | 100 (20) | 33.3 (3) | – | 50.0 (2) | – | 100 (1) | |
| 4–6 months | 0 | 11.1 (1) | – | 25.0 (1) | – | 0 | |
| 7–12 months | 0 | 55.6 (5) | – | 0 | – | 0 | |
| >1 year | 0 | 0 | – | 25.0 (1) | – | 0 | |
| Temporal development | |||||||
| Suddenly | 23.8 (5) | 11.1 (1) | – | 25.0 (1) | – | 100 (1) | |
| Period of days | 28.6 (6) | 33.3 (3) | – | 25.0 (1) | – | 0 | |
| Period of weeks | 47.6 (10) | 55.6 (4) | – | 50.0 (2) | – | 0 | |
| Fluctuations in strength | 66.6 (14) | 55.6 (4) | – | 75.0 (3) | – | 0 | |
| Strength | |||||||
| Weak | 4.8 (1) | 11.1 (1) | – | 0 | – | 0 | |
| Moderate | 38.1 (8) | 55.6 (5) | – | 100 (4) | – | 100 (1) | |
| Strong | 57.1 (12) | 33.3 (3) | – | 0 | – | 0 | |
| Pleasantness | |||||||
| Pleasant | 14.3 (3) | 11.1 (1) | – | 0 | – | 0 | |
| Neutral | 0 | 22.2 (2) | – | 0 | – | 0 | |
| Unpleasant | 85.7 (18) | 66.7 (6) | – | 100 (4) | – | 100 (1) | |
| Taste distortion | |||||||
| Any abnormality | 7.1 (9) | 5.7 (7) | 0 | 3.9 (3) | 0 | 4.2 (3) | |
| Time since onset | |||||||
| ≤3 months | 88.9 (8) | 42.9 (3) | – | 66.7 (2) | – | 66.7 (2) | |
| 4–6 months | 11.1 (1) | 28.6 (2) | – | 33.3 (1) | – | 0 | |
| 7–12 months | 0 | 28.6 (2) | – | 0 | – | 0 | |
| >1 year | 0 | 0 | – | 0 | – | 33.3 (1) | |
| Temporal development | |||||||
| Suddenly | 33.3 (3) | 42.9 (3) | – | 66.7 (2) | – | 66.7 (2) | |
| Period of days | 44.4 (4) | 14.3 (1) | – | 0 | – | 33.3 (1) | |
| Period of weeks | 22.2 (2) | 42.9 (3) | – | 33.3 (1) | – | 0 | |
| Fluctuations in strength | 55.6 (5) | 28.6 (2) | – | 66.7 (2) | – | 100 (3) | |
| Strength | |||||||
| Weak | 11.1 (1) | 0 | – | 0 | – | 0 | |
| Moderate | 66.7 (6) | 100 (7) | – | 66.7 (2) | – | 33.3 (1) | |
| Strong | 22.2 (2) | 0 | – | 33.3 (1) | – | 66.7 (2) | |
| Pleasantness | |||||||
| Pleasant | 11.1 (1) | 14.3 (1) | – | 0 | – | 0 | |
| Neutral | 11.1 (1) | 0 | – | 0 | – | 33.3 (1) | |
| Unpleasant | 77.8 (7) | 85.7 (6) | – | 100 (3) | – | 66.7 (2) |
Percentage (and number) of pregnant women who at gestational weeks 16 (I) and 34 (II) and 12 weeks post partum (III) reported phantom smell or phantom taste during the previous month
| Pregnant | Non-pregnant | ||||||
| I (n = 126) | II (n = 123) | III (n = 117) | I (n = 76) | II (n = 75) | III (n = 72) | ||
| Phantom smell | |||||||
| Any abnormality | 14.3 (18) | 7.3 (9) | 4.3 (5) | 5.3 (4) | 2.7 (2) | 4.2 (3) | |
| Time since onset | |||||||
| ≤3 months | 100 (17) | 66.7 (6) | 100 (4) | 33.3 (1) | 100 (2) | 100 (3) | |
| 4–6 months | 0 | 33.3 (2) | 0 | 0 | 0 | 0 | |
| 7–12 months | 0 | 33.3 (1) | 0 | 0 | 0 | 0 | |
| >1 year | 0 | 0 | 0 | 66.7 (2) | 0 | 0 | |
| Temporal development | |||||||
| Suddenly | 41.2 (7) | 44.4 (4) | 50.0 (2) | 66.7 (2) | 50.0 (1) | 66.7 (2) | |
| Period of days | 17.6 (3) | 33.3 (3) | 50.0 (2) | 0 | 50.0 (1) | 33.3 (1) | |
| Period of weeks | 41.2 (7) | 22.2 (2) | 0 | 33.3 (1) | 0 | 0 | |
| Fluctuations in strength | 55.6 (10) | 44.4 (4) | 40.0 (2) | 50.0 (2) | 50.0 (1) | 33.3 (1) | |
| Strength | |||||||
| Weak | 41.2 (7) | 33.3 (3) | 40.0 (2) | 25.0 (1) | 0 | 33.3 (1) | |
| Moderate | 47.1 (8) | 44.4 (4) | 60.0 (3) | 75.0 (3) | 100 (2) | 66.7 (2) | |
| Strong | 11.8 (2) | 22.2 (2) | 0 | 0 | 0 | 0 | |
| Length of typical episode | |||||||
| Fleeting | 47.1 (8) | 33.3 (3) | 80.0 (4) | 50.0 (2) | 0 | 66.7 (2) | |
| Minutes | 41.2 (7) | 33.3 (3) | 20.0 (1) | 50.0 (2) | 50.0 (1) | 0 | |
| Hours | 0 | 22.2 (2) | 0 | 0 | 50.0 (1) | 33.3 (1) | |
| All day | 11.8 (2) | 11.1 (1) | 0 | 0 | 0 | 0 | |
| Quality | |||||||
| Infected tissue or mucus | 11.1 (2) | 11.1 (1) | 0 | 0 | 50 (1) | 0 | |
| Smoky or burnt | 16.7 (3) | 22.2 (2) | 20.0 (1) | 25.0 (1) | 0 | 33.3 (1) | |
| Fecal or rotten | 61.1 (11) | 77.8 (7) | 0 | 25.0 (1) | 0 | 33.3 (1) | |
| Musty | 5.6 (1) | 0 | 0 | 0 | 0 | 0 | |
| Moldy | 27.8 (5) | 55.6 (5) | 20.0 (1) | 25.0 (1) | 0 | 0 | |
| Metallic | 16.7 (3) | 33.3 (3) | 0 | 0 | 0 | 0 | |
| Other | 44.4 (8) | 22.2 (2) | 40.0 (2) | 75.0 (3) | 50 (1) | 33.3 (1) | |
| Phantom taste | |||||||
| Any abnormality | 7.1 (9) | 6.5 (8) | 0 | 0 | 0 | 1.4 (1) | |
| Duration | |||||||
| ≤3 months | 100 (9) | 62.5 (5) | – | – | – | 100 (1) | |
| 4–6 months | 0 | 25.0 (2) | – | – | – | 0 | |
| 7–12 months | 0 | 12.5 (1) | – | – | – | 0 | |
| >1 year | 0 | 0 | – | – | – | 0 | |
| Temporal development | |||||||
| Suddenly | 44.4 (4) | 50.0 (4) | – | – | – | 0 | |
| Period of days | 11.1 (1) | 0 | – | – | – | 100 (1) | |
| Period of weeks | 44.4 (4) | 50.0 (4) | – | – | – | 0 | |
| Fluctuations in strength | 66.7 (6) | 50.0 (4) | – | – | – | 100 (1) | |
| Strength | |||||||
| Weak | 22.2 (2) | 0 | – | – | – | 0 | |
| Moderate | 77.8 (7) | 100 (8) | – | – | – | 0 | |
| Strong | 0 | 0 | – | – | – | 100 (1) | |
| Length of typical episode | |||||||
| Fleeting | 55.6 (5) | 25.0 (2) | – | – | – | 100 (1) | |
| Minutes | 11.1 (1) | 37.5 (3) | – | – | – | 0 | |
| Hours | 11.1 (1) | 37.5 (3) | – | – | – | 0 | |
| All day | 22.2 (2) | 0 | – | – | – | 0 | |
| Quality | |||||||
| Salty | 0 | 0 | – | – | – | 0 | |
| Sweet | 22.2 (2) | 12.5 (1) | – | – | – | 0 | |
| Sour | 22.2 (2) | 0 | – | – | – | 0 | |
| Bitter | 11.1 (1) | 12.5 (1) | – | – | – | 0 | |
| Metallic | 66.7 (6) | 62.5 (5) | – | – | – | 0 | |
| Other | 22.2 (2) | 12.5 (1) | – | – | – | 100 (1) |
References
Bayley, T.M., Dye, L., Jones, S., DeBono, M. and Hill, A.J. (
Bhatia, S. and Puri, R. (
Bowen, D.J. (
Burdach, K.J. and Doty, R.L. (
Cantoni, P., Hudson, R., Distel, H. and Laska, M. (
Clarke, S.N.D.A. and Bernstein, I.L. (
Dickens, G. and Terthowan, W.H. (
Doty, R.L. and Cometto-Muñiz, J.E. (
Duffy, V.B., Bartoshuk, L.M., Striegel-Moore, R. and Rodin, J. (
Flaxman, S.M. and Sherman, P.W. (
Gilbert, A.N. and Wysocki, C.J. (
Good, P.R., Geary, N. and Engen T. (
Hansen, R. and Glass, L. (
Henssge, E. (
Hook, E.B. (
Kölble, N., Hummel, T., von Mering, R., Huch, A. and Huch, R. (
Kuga, M., Ikeda, M., Suzuki, K. and Takeuchi, S. (
Laska, M., Koch, B., Heid, B. and Hudson, R. (
Luvara, A. and Murizi, M. (
Noferi, G. and Giudizi, S. (
Nordin, S., Murphy, C., Davidson, T.M., Quiñonez, C., Jalowayski, A.A. and Ellison, D.W. (
Nordin, S., Brämerson, A., Murphy, C. and Bende, M. (
Profet, M. (
Schmidt, H. (
Author notes
1Department of Psychology, Umeå University, Sweden, 2Department of Psychology, San Diego State University, USA and 3Department of Clinical Sciences, Obstetrics and Gynecology, Umeå University, Sweden
