


Abstract
Taste is fundamentally important for food selection. Although measures of taste sensitivity and preference have been refined over several decades, it remains largely unknown how these measures relate to each other and to food preferences. The objectives of this study were to examine, in healthy adults (age 24.6 ± 0.6 years, n = 49), 1) correlations among measures of taste sensitivity, including detection threshold (DT) and suprathreshold sensitivity (ST), and taste preference (PR) within sweet, salt, sour, umami, and ... fat tastes; and 2) underlying associations ... among DT, ST, and PR measurements using principal component analysis. DTs and STs were negatively correlated within each taste modality. Salt, sweet, and umami DTs and STs were positively and negatively correlated with PRs, respectively. No correlations were observed between sour and fat DTs, STs, and PRs. Two principal components accounted for 41.9% of the variance and produced 3 clear clusters consisting of DTs, STs, or PRs from each taste modality. Sweet PR and fat ST deviated from the clusters and may, therefore, be driven by different factors. No associations were observed between measured PR and ST with self-reported food PRs. Overall, this study provides evidence that higher sensitivities only to salt, sweet, or umami taste are associated with a decrease in the PR for these tastes. These findings demonstrate the importance of investigating taste sensitivity together with PR to gain a more complete understanding of the determinants of food selection.
Introduction
With the growing prevalence of chronic disease, there has been a multitude of psychophysical studies to characterize the influence of taste in poor eating habits and overweight/obesity. These advances in research on human taste perception have focused mainly on examining broad associations between measures of taste sensitivity, dietary intake, and physical measures of health such as body mass index (BMI) and blood pressure (Pepino et al. 2010; Stewart et al. 2010; Ettinger et al. 2012; Piovesana Pde et al. 2013; Fogel and Blissett 2014; Kirsten et al. 2014; Tucker et al. 2014; Bobowski and Mennella 2015; Sayed et al. 2015; Joseph et al. 2016; Proserpio et al. 2016; Hardikar et al. 2017; Tucker et al. 2017). In general, these studies suggest that low salt, sweet, and fat taste sensitivity is associated with adverse eating habits and overweight/obesity. Although studies that link taste perception to diet and BMI are important to establish the fundamental role of taste in health, findings are not consistent across studies and more detailed analyses are needed to understand how differences in taste perception lead to changes in food selection. As taste has been shown to play a fundamental role in food selection (Chamoun et al. 2018), it is imperative that research in nutrition and sensory science aims to develop a complete understanding of taste function that includes both analytical and affective psychophysical properties.
Although analytical measures of taste such as oral detection thresholds (DTs) and suprathreshold sensitivity (ST) are important tools to characterize interindividual differences in taste, understanding how these measures relate to affective measures of taste would facilitate the interpretation of psychophysical data in the context of food selection. Oral DT is a measure that indicates the lowest concentration of a compound that an individual can discriminate from clean water, whereas ST is a measure of the perceived intensity of a range of concentrations above the DT. Pairing these analytical measures of taste with affective measures, such as taste preference (PR) as measured by the Monell forced-choice, paired-comparison tracking method (Mennella et al. 2014), is an important intermediate step in determining whether taste sensitivity influences food selection. A study by Bossola et al. (2007) tested the relationship between sweet, salt, sour, and bitter taste sensitivities and hedonic response in patients with gastrointestinal cancer as well as healthy controls. In both groups of participants, a linear negative correlation was reported between taste sensitivity and preference for salt, sour, and bitter whereas the opposite was true for sweet (Bossola et al. 2007). In a study that examined umami taste sensitivity and preference in adults, no association was found; however, self-reported liking and preference scores for high-protein foods were found to be negatively correlated with umami DT (Luscombe-Marsh et al. 2008). A negative correlation between fat taste sensitivity and the preference of fat in a tomato soup was reported in another sample of adults (Bolhuis et al. 2016). In a separate study by the same authors, fat taste sensitivity was negatively associated with the intake of high-fat meals in adults, but only in the presence of low salt (Bolhuis et al. 2016). Although these previous studies provide insights for future work on the influence of psychometric functions on food selection, more research is needed to confirm their findings with different stimuli and study populations. In addition, studies examining taste sensitivity and preference would benefit from analyzing multiple types of taste modalities within one group of participants and by using a consistent delivery method of the stimuli.
The primary objective of this study was to investigate correlations among measures of taste sensitivity, including DT, ST, and PR within sweet, salt, sour, umami, and fat tastes. Second, this study sought to explore the underlying attributes of DT, ST, and PR measurements using principal component analysis (PCA). It was hypothesized that 1) DT and ST are negatively correlated for every taste modality and 2) DT is positively associated with PR and ST is negatively associated with PR for every taste modality.
Materials and methods
Participants
A total of 53 participants were recruited from the University of Guelph campus. Exclusion criteria included smokers, diagnosis of a taste dysfunction, and bariatric surgery. Participants were required to be at least 18 years of age. This study was approved by the research ethics board at the University of Guelph (REB#16-12-629) and complies with the Declaration of Helsinki for Medical Research involving Human Subjects.
Psychophysical measurements
All psychophysical tests were administered in sensory booths at the University of Guelph Sensory Laboratory. Filter paper strips (Indigo Instruments—Cat#33814-Ctl; 47 mm × 6 mm × 0.3 mm) immersed in varying concentrations of tastants were used for all sensory tests. The tastants were: sucrose for sweet taste (Thermo Fisher; S5-500), monosodium glutamate (MSG) for umami taste (Thermo Fisher; ICN10180080), inosine monophosphate (IMP) for umami taste (Thermo Fisher; AC226260250), MSG + IMP, sodium chloride (NaCl) for salt taste (Thermo Fisher; S641-500), citric acid for sour taste (A940-500), ... and oleic acid for fat taste ... (A195-500; Thermo Fisher Scientific). Oleic acid was homogenized in deionized water before immersing the filter paper, and all other tastants were dissolved in water at ambient temperature. Filter paper strips were immersed in the tastant solution for about 1 s before placing them on a drying rack to dry overnight at ambient temperature. This procedure was performed only once for all strips before the study commenced. Taste strips immersed in a solution with the same tastant and concentration were stored together at 4 °C in a small plastic resealable bag. Each time a strip was tested, participants placed the taste strip in the middle of their tongue, closed their mouths and allowed at least 5 s for the tastants to be sensed by taste receptors. Participants were asked to rinse and expectorate with distilled water before beginning and following each strip. Within each taste modality, the range of tastant concentrations tested is shown in Table 1.
Range of tastant concentrations used for each psychophysical test
| Taste modality (stimulus) | Threshold/suprathreshold (mM) | Preference (mM) |
|---|---|---|
| Sweet (sucrose) | 2.5–500 | 6–36% (w/va) |
| Umami (MSG) | 3.13–200 | 3.13–200 |
| Umami (IMP) | 0.313–20 | 0.313–20 |
| Umami (MSG+IMP) | 3.13–200 MSG + 0.5 IMP | 3.13–200 MSG + 0.5 IMP |
| Salt (sodium chloride) | 5–100 | 50–250 |
| Sour (citric acid) | 1–15 | 10–200 |
| Fat (oleic acid) | 30–100 | 50–100 |
Tastants were diluted in distilled water and filter papers were submerged in the solutions.
aweight/volume
Oral DT was measured using a modified forced-choice staircase method (Wetherill and Levitt 1965; Pribitkin et al. 2003), ST was determined for a range of tastant concentrations by computing the area under the curve (AUC) of intensity ratings on the general labeled magnitude scale (gLMS; Pepino et al. 2010), and PR was measured using the Monell forced-choice, paired-comparison tracking method (Mennella et al. 2014). In the DT test, participants were first presented with a blank taste strip and were told that it is tasteless to establish a “negative control.” Participants were instructed that they may ask to receive the blank strip at any point during the test as a reminder of the sensation of the blank filter paper. Blank strips administered as negative controls during the test were isolated from the regular test procedure. One blank strip and one taste strip were presented in random order one at a time to participants who were then asked to respond with “yes” or “no” to the question “Did you taste something?” (yes–no task). The first concentration tested was the median of the full range of concentrations used in the test. If a participant correctly identified a taste strip from a blank strip on 2 consecutive occasions, then the adjacent lower concentration was subsequently tested. However, if a participant incorrectly distinguished a taste strip from a blank strip on one occasion, then the adjacent higher concentration was subsequently tested. A change in the direction to a lower or higher concentration during the test was recorded as a reversal, and the threshold was calculated as the mean of the concentrations where the first 4 reversals occurred. In the ST test, participants were presented with a range of taste strips one at a time in random order and were asked to rate the intensity of the strips from 0 to 100 on a gLMS where 0 = undetectable, 2 = barely detectable, 6 = weak, 18 = moderate, 35 = strong, 52 = very strong, and 100 = strongest imaginable sensation of any kind. The participants were oriented toward the scale and were given explicit verbal instructions to also use the numbers in the spaces between the labels to prevent the clustering of responses near the semantic labels. The participants were also instructed that “0” is very much an acceptable response if the participant perceived no taste on the strip. The AUC of the intensity ratings for a tastant was computed to determine ST. In the PR test, paired stimuli (2 adjacent concentrations) were presented one at a time to participants. After the second stimulus was presented, participants were asked “Which of the two did you prefer?” and responded with “the first one” or “the second one.” The subsequent pairing included the previously preferred concentration as well as the other adjacent concentration. Once the same concentration was chosen after being presented with 2 adjacent concentrations, it was deemed to be the PR. Oral DTs for all taste modalities were measured in 1 session whereas ST and PR were measured in a separate session, on a different day.
Data analysis
Statistical analyses were conducted using SAS, version 9.4 (2012–2016, SAS Institute Inc.). All DT, ST, and PR variables were log-transformed before the correlation analysis to reduce the extreme magnitudes among the measurements. The ST variables were continuous, the DT and PR variables were not continuous, and survey responses were a combination of ordinal and binary variables. Therefore, Spearman correlations (rs) were used to examine the relationships among DTs, STs, and PRs. Weak, moderate, and strong correlations were considered to have correlation coefficients of rs < |0.30|, rs = |0.30|–|0.49|, and rs ≥ |0.50|, respectively (Low et al. 2017). PCA was used to explain the structure of the DT, ST, and PR measures for all taste modalities. Statistical significance was set at P value of less than 0.05.
Results
Although 53 participants were recruited for the study, 4 participants relocated before completing the study and were therefore excluded. No participants were excluded based on any other exclusion criteria. A total of 35 female participants and 14 male participants with a mean age of 25 ± 3 years completed the study, and the age of participants ranged from 18 to 44 years. The mean BMI of participants (22.3 ± 2.6 kg/m2) indicated, on average, a normal body weight. Measures of anthropometry and body composition are summarized in Table 2.
Participant characteristics
| Characteristic | Total | Female | Male |
|---|---|---|---|
| n | 49 | 35 | 14 |
| Age (years) | 25 ± 3 | 25 ± 3 | 24 ± 2 |
| Body mass index (kg/m2) | 22.3 ± 2.6 | 21.2 ± 2.0 | 25.1 ± 2.5 |
| Body fat % | 20.2 ± 5.8 | 22.2 ± 5.0 | 14.8 ± 5.5 |
| Ethnicity (%) | |||
| Caucasian | 75 | — | — |
| South-east Asian | 10 | — | — |
| Latin American | 10 | — | — |
| Other | 5 | — | — |
Characteristics that are not presented as a percentage are means ± standard deviation.
Correlation analysis of DT, ST, and PR
Correlation matrices for DT, ST, and PR within each taste modality are presented in Table 3. Measures of DT and ST were consistently negatively correlated; however, the negative correlation for sour DT and ST was not significant. Moderately positive correlations were observed between DT and PR for umami and salt taste whereas sweet DT and PR had a weak positive correlation, which was not significant. Fat DT had a weak negative correlation with fat PR and this was not significant. No correlation was observed between sour DT and PR. Moderately negative correlations were observed between ST and PR for umami and salt taste (Figures 1 and 2, respectively) whereas sweet and fat ST and PR had weak negative correlations, which were not significant. No correlation was observed between sour ST and PR.
Correlation matrix for DT, ST, and PR
| Taste modality (stimulus) | Correlation coefficients (rs) | ||
|---|---|---|---|
| DT | PR | ||
| Sweet (sucrose) | DT | — | 0.22 |
| ST | –0.54* | –0.20 | |
| Umami (MSG) | DT | — | 0.46* |
| ST | –0.43* | –0.59* | |
| Umami (IMP) | DT | — | 0.36* |
| ST | –0.29* | –0.32 | |
| Umami (MSG+IMP) | DT | — | 0.44* |
| ST | –0.35* | –0.62* | |
| Salt (NaCl) | DT | — | 0.36* |
| ST | –0.44* | –0.35* | |
| Sour (citric acid) | DT | — | 0.00 |
| ST | –0.19 | –0.09 | |
| Fat (oleic acid) | DT | — | –0.17 |
| ST | –0.64* | –0.17 |
Spearman correlations were calculated to determine the relationship between DT, ST, and PR for sweet, umami, salt, sour, and fat taste in healthy adults (n = 49). *P < 0.05.
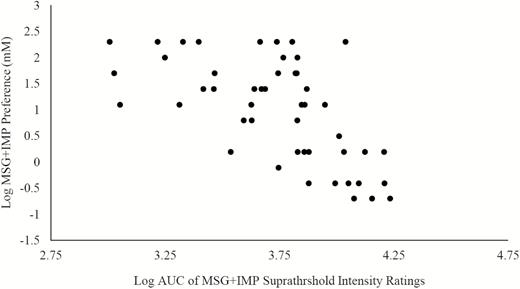
Spearman correlation between umami ST and umami PR. Spearman correlation was used to determine the correlation between umami ST and umami PR. The variables were logged to reduce the magnitude of their scales. Umami ST was measured by the AUC of intensity ratings for MSG+IMP and umami PR was determined using the Monell forced-choice, paired-comparison tracking method for MSG+IMP. Umami ST and PR were negatively correlated with a Spearman correlation coefficient of –0.62 (P < 0.001). AUC = area under the curve; MSG = monosodium glutamate; IMP = inosine monophosphate.
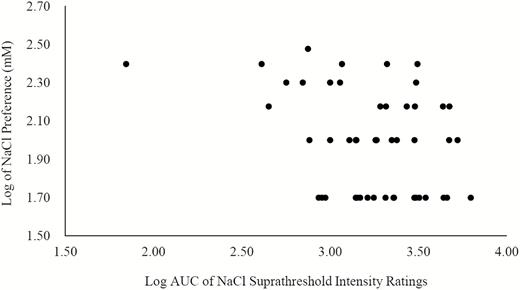
Spearman correlation between salt ST and salt PR. Spearman correlation was used to determine the correlation between salt ST and umami PR. The variables were logged to reduce the magnitude of their scales. Salt ST was measured by the AUC of intensity ratings for NaCl and salt PR was determined using the Monell forced-choice, paired-comparison tracking method for NaCl. Salt ST and PR were negatively correlated with a Spearman correlation coefficient of –0.35 (P < 0.05). AUC = area under the curve; NaCl = sodium chloride.
Principal component analysis of DT, ST, and PR
The result of the PCA for DTs, STs, and PRs in all taste modalities is presented in Figure 3. The 2 components that accounted for the most variance comprised 41.85% of the variance. Components 1 and 2 accounted for 26.13% and 15.72% of the variance, respectively. Subsequent components did not account for more than 10% of the variance and were therefore not considered for further analysis. Three clear clusters were formed as a result of the PCA, including a DT cluster (gray), an ST cluster (black), and a PR cluster (white; Figure 3). One cluster is formed by sweet PR and DT for fat, sweet, salt, sour, MSG, IMP, and MSG+IMP (top-right quadrant; Figure 3). A second cluster is formed by ST for sweet, salt, sour, MSG, IMP, and MSG+IMP (top-left quadrant; Figure 3). Third, a cluster is formed by PR for fat, salt, sour, MSG, IMP, and MSG+IMP (bottom-right quadrant; Figure 3).
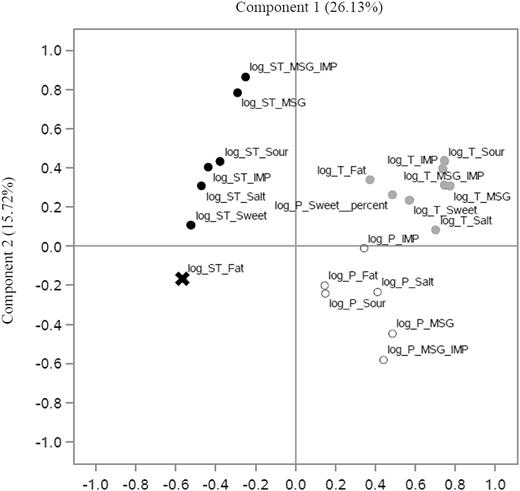
Principal component analysis of DT, ST, and PR. PCA was used to explain the structure of the DT, ST, and PR measures for all taste modalities (n = 49). Values on the x- and y-axes represent the component scores. Variables were log-transformed to reduce the large differences in magnitudes between the measurements. The 2 components that accounted for the most variance comprised 41.85% of the variance. Component 1 accounted for 26.13% of the variance whereas Component 2 accounted for 15.72% of the variance. Subsequent components did not account for more than 10% of the variance and were therefore not considered for further analysis. Three clear clusters were formed as a result of the analysis including of a DT cluster (gray), a ST cluster (black), and a PR cluster (white). T = detection threshold; ST = suprathreshold sensitivity; P = preference; MSG = monosodium glutamate; IMP = inosine monophosphate.
Discussion
This study provides evidence that measures of taste sensitivity and PR for some types of taste are correlated. In particular, higher sensitivities to salt, sweet, and umami taste are associated with decreases in the preferences for these tastes whereas fat and sour preferences were not associated with corresponding taste sensitivities. A linear negative correlation was reported between taste sensitivity and preference for salt and sour in a previous study (Bossola et al. 2007), but that finding was only replicated for salt in this study. The linear positive correlation observed by Bossola et al. (2007) between sweet sensitivity and preference was the opposite trend from what was found in this study. No association was reported in a previous study between umami DT and umami PR (Luscombe-Marsh et al. 2008); however, a significant negative correlation was observed in this study. A negative correlation between fat taste sensitivity and fat PR has been suggested in previous work (Bolhuis et al. 2016), but this result was not replicated here. Altogether, there is some inconsistency between results reported in this work compared with previous studies. These differences may be due to the methodologies used and more research is needed to confirm all of these experiments. Nevertheless, these findings advance the current understanding of the role that taste sensitivity plays in PR for specific taste modalities. In particular, it provides novel evidence that the relationship between analytical measures and affective measures of taste exhibits substantial differences between each taste modality in the same sample of individuals. This information may be useful to interpret the hedonic context of findings in previous studies that only measured taste sensitivity. Therefore, it may clarify how analytical measures of taste are implicated in human ingestive behavior. For the link between taste function and eating patterns to be more established, future studies are needed to confirm the relationships between sensitivity and preference for each type of taste and investigate the determinants of these relationships.
Although correlations were useful to determine the magnitude and direction of associations between DT, ST, and PR for each taste modality, the PCA provided additional insight into whether similar factors accounted for those correlations. Component 1 of the PCA is a factor that tends to reflect intensity perception whereby the ST data are clustered at one end of Component 1 and DT data are clustered at the other end of Component 1. Participants with higher DTs are less sensitive to stimuli and therefore rate stimuli at lower intensities. This pattern follows a logical and expected outcome for the relationship between DT and ST. Therefore, Component 1 may also be an indicator of accuracy in measuring DT and ST in this study. Component 2 emerged as the factor that contributed to determining preference for every type of taste except for sweetness. Although measures of sweet sensitivity and preference were observed to have the same direction of correlation as the other taste modalities, the determinant of sweet PR was different than that of the other types of taste. The weaker positive correlation observed between sweet DT and PR was likely due to the lack of Component 2 influence on sweet PR. Component 2 is speculated to be a preference for high concentrations of the compounds tested. It can then be interpreted that, in general, the presence of a high concentration of sucrose in the samples tested elicited a hedonic liking response in the participants. Consistent with the correlation analysis, this interpretation also suggests that high concentrations of all the other tastants elicited an aversive response in the participants.
Oleogustus is the most recently identified taste modality and refers to the taste of fatty acids (Running et al. 2015). The taste of long-chain fatty acids was previously thought to only be dependent on the texture and smell (Ramirez 1993; Greenberg et al. Smith 1996; Tepper and Nurse 1997), but more recent evidence supports taste as a method of oral detection of dietary fat, including saturated fat (Fukuwatari et al. 2003; Mattes 2009; Running et al. 2015). Previous research has measured fat DT, ST, and PR using a variety of delivery methods such as deionized water, milk, pudding, custard, tomato soup, filter paper strips, edible strips, etc. (Heinze et al. 2015). Although the ideal technique and delivery method for determining fat sensitivity and preference are controversial (Heinze et al. 2015), the strong negative correlation between DT and ST for fat in this study increased the validity of the measurement. The sensitivity–preference relationship for fat is opposite from that of all other taste modalities according to Components 1 and 2 from the PCA. Although individual correlations did not indicate that fat DT or ST was significantly correlated with PR, it is worthwhile to consider in future research that the hedonic response to fatty acids as a stimulus may have a different mechanism than for other types of taste. It is also possible that the delivery method of fatty acids in this study was not suitable for the measurement of preference due to the influence of other properties of fat on preference, such as texture and mouthfeel. Incorporating fatty acids into food matrices may be a more accurate method of measuring fat PR, despite the disadvantage of variable perceptions of matrix-specific textures by participants.
There are some additional limitations to consider in this study. First, the concentrations of the tastant solutions used to immerse the filter paper strips may not be an accurate representation of the amount of tastant dissolved on the tongues of participants. Moreover, the data obtained by assessing taste sensitivity and PR using isolated compounds on filter paper strips cannot be used to make direct associations between taste perception and food preference. However, this can also be considered a strength of the study as the observations made are accurate for specific taste modalities, whereas using food would have introduced uncertainty due to the perception of texture, temperature, and other matrix-specific qualities. Future studies would benefit from performing hedonic tests with a food that is standardized with one matrix for all taste modalities to determine PRs. In addition, participants were tested for DT, ST, and PR on only one occasion, but this procedure should be repeated to ensure test reproducibility. Further, the number of reversals used to obtain the DT in the staircase procedure should be higher to limit the effect of false reversals on the final measurement.
Conclusion
Overall, this study provides evidence that taste sensitivity and PR measurements, when tested using a filter paper carrier system, are correlated in young healthy adults. In particular, higher sensitivities to salt and umami taste were associated with a decrease in the preference for these tastes whereas this was not observed for sweet, sour, and fat tastes. Furthermore, this study demonstrated that the determinants of sweet and fat PR may be different than those of other types of taste. These findings demonstrate the importance of investigating taste sensitivity together with PR to gain a more complete understanding of the determinants of food selection.
Funding
This work was supported by the Ontario Ministry of Agriculture, Food and Rural Affairs [grant# 110-029900-000000-030194].
Conflict of interest
The authors declare no conflict of interest.
Acknowledgements
E.C. conceived and designed the experiments, collected and analyzed data, and wrote the article; A.A.S.L. helped with data collection and analysis; L.D. helped to design the sensory experiments and provided critical revision for the paper; G.D. helped with the statistical analysis and provided critical revision for the paper; A.M.D. helped with the dietary data and provided critical revision for the article; J.H. provided critical revision for the paper; D.W.L.M. conceived and designed the experiments and provided critical revision for the article.
