


A simple, accurate and reproducible reversed-phase liquid chromatographic method was developed for qualitative and quantitative determination of four bioactive flavonoids (ampelopsin, taxifolin, myricetin and quercetin) from the fruit-stalk extract of Hovenia dulcis Thunb. Chromatographic separation was performed on a C18 column (4.6 × 150 mm, 3.5 µm) with mobile phase consisting of 0.1% acetic acid and 100% acetonitrile at a flow rate of 1.0 mL/min. The analysis was performed using a diode array detector at 365 nm. The method was validated in terms of selectivity, linearity, accuracy, precision and recovery. Good linearity was observed over the investigated concentration range (10–500 μg/mL), with correlation coefficient values greater than 0.99. The intra- and inter-day precisions over the concentration range were <3.91% (relative standard deviation), and the accuracy was between 91.57 and 106.66%. The mean recovery for all the analytes was 100.87%. This method was successfully applied in the quality assessment of bioactive flavonoids in the fruit-stalk extract of H. dulcis.
Introduction
Hovenia dulcis Thunberg (Rhamnaceae), known as Oriental Raisin tree, is indigenous to Korea, China and Japan. Parts of the tree, namely the seeds, fruit stalk, leaves and stem bark, are commonly used as folk remedies in oriental medicine (1). The fruit stalk of H. dulcis, also called ‘Jiguja’ in Korean, is of special interest; it is reported to have detoxification effects on alcohol poisoning, and hepatoprotective, antioxidant, antidiabetic, antiobesity, antiallergic and anticancer activities (2–10). Because of these health benefits, it has been widely used as an ingredient in natural health products and functional foods in East Asia (1, 3). In addition, there have been many industrial attempts to produce dietary supplements and functional food products using the fruit-stalk extracts (11). For example, a beverage containing H. dulcis fruit-stalk extract (HFE) has been reported to be effective in relieving ethanol-induced hangover in rats (12). Another study showed that the soy sauce containing HFE exhibited higher antioxidant activity and alcohol dehydrogenase activity than normal soy sauces (13).
A quality assessment of dietary supplements or functional foods is critical to ensure their expected performance. As part of the quality assessment, the principal bioactive constituents or markers should be established and monitored. Phenolic compounds and triterpene saponins have been identified in HFE as the bioactive constituents responsible for the demonstrated health effects. The phenolic compounds reported are hovenodulinol, hovenitins I, II and III, (+)-3,3′,5′,5,7-pentahydroflavanone, laricitrin, myricetin, (+)-gallocatechin, dihydrokaempferol, dihydromyricetin (ampelopsin) and quercetin; the triterpene saponins reported are saponin C2, β-daucosterol, hovenidulciosides A1, A2, B1 and B2, hodulosides I and III and hovenidulcigenin (8, 9, 14–17). As such, the chemical components of HFE have been extensively investigated; however, to the best of our knowledge, qualitative or quantitative analytical methods for HFE have not yet been reported and the information on the content of its bioactive constituents is not available.
To establish the marker bioactive compounds of H. dulcis fruit, the extracts were preliminarily analyzed using high-performance liquid chromatography (HPLC). Four major chromatographic peaks were detected, attributed to ampelopsin, taxifolin, myricetin and quercetin, which have all been reported as major constituents of H. dulcis (14, 15, 18). Ampelopsin, also known as dihydromyricetin, possesses hepatoprotective activity, inhibits alcohol-induced muscular relaxation and counteracts alcohol intoxication and dependence (19–21). Taxifolin exhibits antioxidant activity and potential chemopreventive effects by regulating genes via an antioxidant response element-dependent mechanism (22). Myricetin exhibits antiallergic, antioxidant and hypoglycemic effects in diabetic rats (23–25). Quercetin enhances 5-fluorouracil efficiency in cancer treatment and reduces high-fat-diet-induced fat accumulation in mice (26, 27). HPLC analytical methods for each of these four flavonoids have been reported (28–31), but the method for simultaneous detection of these all compounds has not yet been published. Therefore, we selected these four flavonoids as bioactive marker compounds of HFE and developed an HPLC method for the quantitative determination of these four flavonoids. This article presents a simple, accurate, reproducible and thoroughly validated HPLC-based method for qualitative and quantitative analysis of these four flavonoids, as part of the quality assessment of products containing HFE.
Experimental
Chemicals and reagents
Ampelopsin (purity >98%), taxifolin (purity >85%), myricetin (purity >96%) and quercetin (purity >98%) were purchased from Sigma-Aldrich (St. Louis, MO, USA). HFE samples were provided by Lifetree Biotech Co., Ltd. (Suwon, Korea). All other solvents used were of HPLC grade and purchased from J. T. Baker (Phillipsburg, NJ). Distilled water was prepared using a Milli-Q purification system (Millipore, Billerica, MA).
Preparation of HFE samples
The HFE samples were prepared by Lifetree Biotech Co., Ltd. using the following procedure. The powder of dried fruits of H. dulcis (25 g) was extracted with water (1 L) at 100°C for 3 h, and the extract solution was centrifuged for 10 min at 4,000 rpm to remove insoluble particles. The solution was then freeze-dried for 24 h.
Standard solutions and sample preparation
Standard stock solutions of ampelopsin, taxifolin, myricetin and quercetin were prepared at a concentration of 2 mg/mL in 80% methanol. The standard solutions were serially diluted with 80% methanol to obtain calibration standard solutions at concentrations of 10, 20, 50, 100, 200 and 500 µg/mL for all the analytes. Quality control (QC) samples were prepared at 20, 100 and 500 µg/mL in the same manner as the calibration standard solutions.
HFE samples were dissolved in 80% methanol at a concentration of 250 mg/mL and were centrifuged at 13,200 rpm for 5 min. The supernatant was collected and filtered through a 0.45-μm polytetrafluoroethylene (PTFE) syringe filter (Whatman International Ltd., Maidstone, England).
HPLC condition
Agilent 1260 infinity HPLC system, equipped with a photo diode array detector (Agilent Technologies, Palo Alto, CA), was used for the analysis. The chromatographic separation was achieved using an Xbridge™ Shield RP18 column (4.6 mm I.D. × 150 mm, 3.5 µm) (Waters, Milford, USA), with column oven temperature maintained at 20°C. The mobile phase consisted of 0.1% acetic acid (Solvent A) and 100% acetonitrile (Solvent B). The mobile phase flow rate was 1.0 mL/min with gradient elution. The percentage composition of Solvent B was maintained at 20% for 3 min, gradually increased to 38% for 24 min, further increased to 90% for 1 min and maintained at 90% for 5 min, which was followed by equilibration to the initial composition for 6 min. The injection volume was 10 µL, and UV absorbance was monitored at 365 nm.
Method validation
The validation of the analytical method was performed according to our routine validation protocol, and the details are as follows. The specificity of the developed method was examined by comparing the chromatographic profile of the reference standards with that of HFE samples, in terms of retention time, pattern of the UV spectrum and maximum absorption wavelength (λmax). Linearity was evaluated using the linear correlation coefficient (r2) of the calibration curve for each analyte. The limit of detection (LOD) and the limit of quantitation (LOQ) were determined based on the lowest detectable peak in the chromatogram, with a signal-to-noise (S/N) ratio of 3 and 10, respectively. Precision was evaluated by replicate analyses of QC samples at low, medium and high concentrations (20, 100 and 500 µg/mL, respectively) and expressed as percent relative standard deviation (% RSD). Accuracy was assessed by comparing nominal versus measured concentrations of the QC samples and expressed as a percentage of the nominal concentration. Intra-day precision and accuracy were determined from the variability of the replicate analyses (n = 5) in the same analytical run. The inter-day assay was examined for three consecutive days. Recovery was determined by calculating the percent recovery of the standard-fortified samples at two concentrations (n = 3).
Results
Chromatography
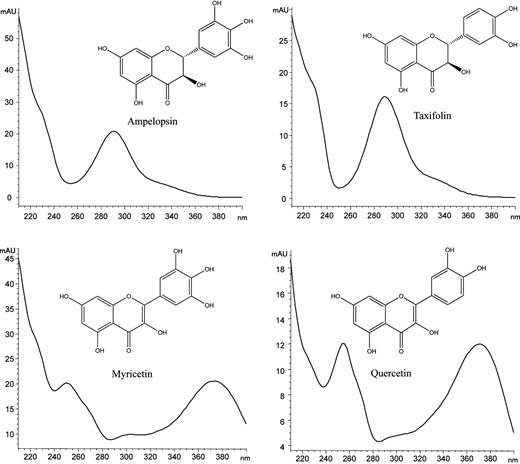
Chemical structures and UV spectra of four bioactive flavonoids from H. dulcis fruit extracts.
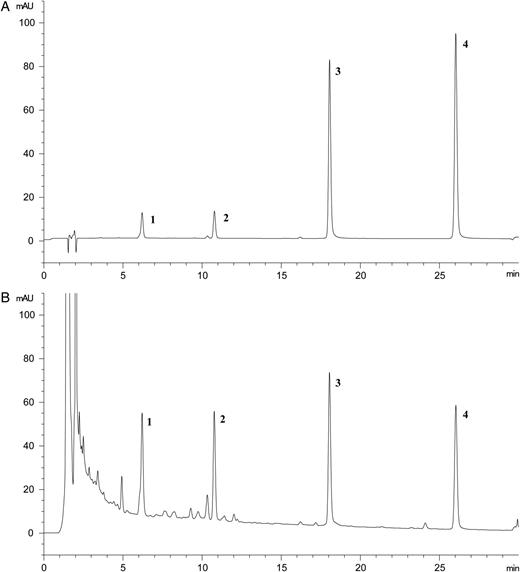
Representative HPLC chromatograms of the standard mixture (A) and H. dulcis fruit extracts (B). 1, Ampelopsin; 2, taxifolin; 3, myricetin; and 4, quercetin.
Analytical method validation
The selectivity of the method was determined by comparing certain parameters of the chromatographic profile, such as retention time, structure of the UV spectrum and λmax of the reference standards and the HFE sample. Chromatographic profiles of the standard mixture and the HFE sample were identical with regard to the parameters mentioned above (Figure 2). In addition, no interference was observed at the retention times of any analytes in the chromatogram of the extract.
The calibration curves for ampelopsin, taxifolin, myricetin and quercetin were made by plotting the peak area versus the concentration for each analyte using least-square regression analysis. Each calibration curve was obtained using six levels of concentrations in the range 10–500 µg/mL, in triplicate. The ranges of all the calibration curves were adequate for simultaneous analysis of the four flavonoids in the HFE samples. The linear correlation coefficient (r2) for all calibration curves was higher than 0.999 for all analytes, indicating good linearity over the investigated range (Table I).
Calibration Curve Data for Ampelopsin, Taxifolin, Myricetin and Quercetin
| Analyte | Calibration curve | R2 | Linear range (µg/mL) | LOD (µg/mL) | LOQ (µg/mL) |
|---|---|---|---|---|---|
| Ampelopsin | y = 2.07964x +4.94688 | 0.999 | 10–500 | 0.5 | 2.0 |
| Taxifolin | y = 2.06722x +10.26886 | 0.999 | 10–500 | 0.5 | 1.0 |
| Myricetin | y = 22.43971x –237.69323 | 0.999 | 10–500 | 0.2 | 0.5 |
| Quercetin | y = 25.70407x –171.98022 | 0.999 | 10–500 | 0.1 | 0.3 |
The LOD and LOQ of the analytes were measured by analyses of serially diluted standard solutions. The LOD and LOQ for ampelopsin, taxifolin, myricetin and quercetin were in the ranges of 0.1–0.5 and 0.5–2.0 µg/mL, respectively. This indicates that this method can be used to detect trace amounts of these flavonoids and quantify them in crude extracts of H. dulcis fruits or in functional foods and dietary products containing the extract.
Intra-assay precision and accuracy were assessed by analyzing five sets of QC samples, independently prepared at low, middle and high concentrations. Inter-assay precision and accuracy were tested over 3 days, with the QC samples prepared each day. The RSD values of both intra-assay and inter-assay precision were below 3.91%, and the accuracy remained between 91.57 and 106.66%. The resulting precision and accuracy data were satisfactory for the quantitative analysis of the flavonoids in H. dulcis fruit extracts (Table II).
Intra- and Inter-day Precision and Accuracy for Determination of Ampelopsin, Taxifolin, Myricetin and Quercetin
| Analyte | Nominal concentration (µg/mL) | Intra-day (n = 5) | Inter-day (n = 3) | ||||
|---|---|---|---|---|---|---|---|
| Observed concentration (n = 5) Mean ± SD | Accuracy (%) | Precision (%) | Observed concentration (n = 3) Mean ± SD | Accuracy (%) | Precision (%) | ||
| Ampelopsin | 20 | 20.01 ± 0.39 | 100.06 | 1.96 | 20.01 ± 0.54 | 100.04 | 2.69 |
| 100 | 100.49 ± 0.63 | 100.49 | 0.62 | 100.42 ± 0.51 | 100.42 | 0.51 | |
| 500 | 493.86 ± 3.4 | 98.77 | 0.69 | 494.25 ± 2.39 | 98.85 | 0.48 | |
| Taxifolin | 20 | 18.56 ± 0.08 | 92.78 | 0.45 | 18.31 ± 0.27 | 91.57 | 1.45 |
| 100 | 99.65 ± 1.04 | 99.65 | 1.04 | 102.55 ± 2.09 | 102.55 | 2.03 | |
| 500 | 496.61 ± 2.11 | 99.32 | 0.42 | 503.48 ± 3.68 | 100.70 | 0.73 | |
| Myricetin | 20 | 20.31 ± 0.12 | 101.53 | 0.59 | 20.45 ± 0.06 | 102.23 | 0.27 |
| 100 | 97.74 ± 3.82 | 97.74 | 3.91 | 95.84 ± 3.07 | 95.84 | 3.20 | |
| 500 | 533.30 ± 3.93 | 106.66 | 0.74 | 527.06 ± 7.10 | 105.41 | 1.35 | |
| Quercetin | 20 | 20.64 ± 0.09 | 103.22 | 0.43 | 20.70 ± 0.02 | 103.51 | 0.08 |
| 100 | 94.92 ± 1.49 | 94.92 | 1.57 | 93.25 ± 1.79 | 93.25 | 1.91 | |
| 500 | 503.88 ± 1.81 | 100.78 | 0.36 | 501.69 ± 3.12 | 100.34 | 0.62 | |
The recoveries were determined by a standard-fortified method at two concentrations. The average recoveries were 82.98–115.14% for all compounds with RSD values <2.83%. The results are summarized in Table III.
Data for Recovery Studies of Ampelopsin, Taxifolin, Myricetin and Quercetin
| Analyte | Fortified concentration (µg/mL) | Observed concentration (µg/mL) | Mean recovery (%, n = 3) | RSD (%) |
|---|---|---|---|---|
| Ampelopsin | 50 | 47.66 | 95.32 | 2.63 |
| 250 | 245.56 | 98.22 | 0.94 | |
| Taxifolin | 50 | 41.49 | 82.98 | 2.83 |
| 250 | 232.95 | 93.18 | 0.86 | |
| Myricetin | 50 | 57.57 | 115.14 | 1.06 |
| 250 | 273.45 | 109.38 | 1.00 | |
| Quercetin | 50 | 53.83 | 107.67 | 1.03 |
| 250 | 262.66 | 105.06 | 0.86 |
Sample analysis
The developed analytical method was applied to simultaneous determination of the four flavonoids in the HFE samples. The concentrations of the flavonoids in different batches of HFE samples are presented in Table IV. The concentrations of ampelopsin, taxifolin, myricetin and quercetin were in the range of 0.88–1.19, 0.15–1.64, 0.04–0.24 and 0.03–0.13 mg/g of extract, respectively. The flavonoid content profiles were different among different batches of samples but generally, ampelopsin and taxifolin were the most abundant flavonoids. The variation in flavonoid contents was thought to be due to differences in origin, harvesting time and environmental conditions of raw plant materials, as well as differences in extraction recovery (32–34).
Contents of Four Flavonoids in Hovenia dulcis Fruit Extract Samples
| Sample | Content (mg/g extract) | |||
|---|---|---|---|---|
| Ampelopsin | Taxifolin | Myricetin | Quercetin | |
| 0703 | 0.88 ± 0.05 | 0.86 ± 0.05 | 0.17 ± 0.01 | 0.13 ± 0.01 |
| 0701 | 1.19 ± 0.03 | 0.15 ± 0.01 | 0.24 ± 0.01 | 0.03 ± 0.00 |
| 0807-5 | 1.17 ± 0.03 | 0.93 ± 0.02 | 0.06 ± 0.01 | 0.04 ± 0.01 |
| 0807-6 | 0.33 ± 0.07 | 1.64 ± 0.01 | 0.04 ± 0.01 | 0.05 ± 0.01 |
Discussion
In this study, we developed a simultaneous quantitation method for major bioactive flavonoids of HFE, ampelopsin, taxifolin, myricetin and quercetin, using HPLC. The developed method was validated in terms of specificity, linearity, accuracy, precision and recovery, and all validation parameters measured were satisfactory for the quantitation of the constituents from HFE. The LOD and LOQ values for each analyte were low enough to determine the content of these flavonoids from HFE samples and also comparable or improved to those reported in the previously published articles (28–31).
According to the reports published regarding chemical composition and biological activities of H. dulcis fruits, various polyphenolic compounds and triterpene saponins have been reported as biologically active compounds of H. dulcis fruits (8, 9, 14–17). However, the content of those constituents, chemical profile or chromatographic data of H. dulcis fruit extracts has not yet been reported. Thus, the information on the principal components of H. dulcis fruits, in terms of their content and biological contribution to the beneficial effects of H. dulcis fruits, has not been available. In this context, chromatographic studies may provide such information to elucidate the underlying mechanism of functional foods, as well as to establish the marker compounds for quality assessment. To our knowledge, this is the first study to report the chromatographic profile, validated QC method and flavonoids content of H. dulcis fruit extracts.
Conclusion
In this study, an HPLC method for the simultaneous quantitation of the four major flavonoids (ampelopsin, taxifolin, myricetin and quercetin) found in HFE samples was developed and validated. Validation results showed this method to be sensitive, accurate and reproducible. The developed method was successfully applied to determine the flavonoid content of different batches of HFE samples. Therefore, the present method could be utilized for quality assessment of dietary supplements and functional food products containing HFE.
Acknowledgments
This research was supported by Basic Science Research Program through the National Research Foundation of Korea (NRF) funded by the Ministry (NRF-2014R1A1A1A05002840).
