


Abstract
Many individuals with acute human immunodeficiency virus infection (AHI) experience acute retroviral syndrome (ARS), which is associated with adverse long-term clinical outcomes.
Participants presenting for voluntary human immunodeficiency virus (HIV) testing were enrolled during AHI in Bangkok, Thailand. ARS was defined by ≥3 qualifying signs/symptoms. HIV burden, immunophenotypes, and biomarkers were stratified by ARS diagnosis at enrollment and after up to 96 weeks of antiretroviral therapy (ART).
From 212382 samples screened, 430 participants were enrolled during AHI, including 335 (78%) with ARS. Median age was 26 years and 416 (97%) were men. Sixty (14%) underwent sigmoid biopsy and 105 (24%) underwent lumbar puncture during AHI. Common symptoms included fever (93%), fatigue (79%), pharyngitis (67%), and headache (64%). Compared to those without ARS, participants with ARS were in later Fiebig stages with higher HIV RNA in blood, colon, and cerebrospinal fluid; higher total HIV DNA in blood; CD4 depletion in blood and colon; and elevated plasma tumor necrosis factor alpha (TNF-α), C-reactive protein, and D-dimer (all P < .05). Subgroup analyses of Fiebig I/II participants (95 with ARS, 69 without) demonstrated similar findings. After 96 weeks of ART, TNF-α and interleukin 6 were elevated in the ARS group (P < .05) but other biomarkers equilibrated.
ARS was associated with high viral burden, CD4 depletion, and immune activation across multiple body compartments during AHI and prior to ART. Persistent inflammation despite suppressive ART could contribute to increased morbidity in individuals who experience ARS.
Acute retroviral syndrome (ARS) is the symptomatic presentation of acute human immunodeficiency virus infection (AHI). It is typically described as a mononucleosis-like illness with prevalence estimates varying widely, depending on the population studied, from 23% to 92% of newly infected individuals [1–13]. The RV217 study prospectively identified AHI in a closely monitored high-risk cohort and described a high frequency of symptoms/signs but distinctly fewer findings per participant with shorter duration than prior reports [14]. Longer duration and greater severity of ARS have been associated with more rapid progression of human immunodeficiency virus (HIV) infection and worse clinical outcomes [13, 15–21]. It has been postulated that individuals presenting with more severe ARS may receive enhanced benefit from antiretroviral therapy (ART) initiation during AHI [22]. Early recognition of ARS and initiation of ART can potentially halt onward transmission of HIV during a period of exceptional infectivity [23], limit establishment of HIV reservoirs [24–28], and improve immune reconstitution [25–28].
We hypothesized that differences in host immune responses associated with ARS might persist after ART initiation and contribute to previously described long-term adverse outcomes. In these analyses, we characterize ARS in a large cohort of individuals with AHI in Bangkok, Thailand, by describing the frequency and clinical features of ARS, exploring biomarker associations with ARS across multiple body compartments, and evaluating the impact of early ART initiation on these biomarkers.
METHODS
Study Population
The ongoing RV254/SEARCH010 cohort (ClinicalTrials.gov NCT00796146) enrolls participants diagnosed with AHI during voluntary HIV screening at the Thai Red Cross AIDS Research Centre in Bangkok, Thailand, as previously described [29]. In brief, testing begins with a fourth-generation immunoassay (IA) that detects HIV antigen, immunoglobulin M, and immunoglobulin G (IgG). Nonreactive samples undergo pooled nucleic acid testing (NAT) while reactive samples are tested using a second-generation IA that detects HIV IgG only. AHI is diagnosed and individuals are offered enrollment if they have either a nonreactive fourth-generation IA with positive NAT or a reactive fourth-generation IA with nonreactive second-generation IA. Participants are also offered ART via a separately funded protocol (ClinicalTrials.gov NCT00796263).
Serial interviews, physical examinations, and phlebotomy are performed at baseline; study weeks 2, 4, 8, and 12; and every 12 weeks thereafter. Optional procedures at baseline and weeks 24 and 96 include leukapheresis, colon biopsy via flexible sigmoidoscopy, and lumbar puncture to collect cerebrospinal fluid (CSF). Participants who enrolled between 13 May 2009 and 22 December 2016 were included in these analyses.
The study was approved by institutional review boards at Chulalongkorn University, Bangkok, Thailand; Walter Reed Army Institute of Research, Silver Spring, Maryland; and all participating institutions. All participants provided written informed consent prior to enrollment and separate consent for optional procedures.
Diagnosis of ARS
A standardized checklist was used by a study physician to document ARS, defined by the presence or recent history of ≥3 of the following solicited signs and symptoms: fever, adenopathy, headache, fatigue, myalgia, arthralgia, pharyngitis, oral ulcer, genital ulcer, weight loss, anorexia, nausea/vomiting, diarrhea, odynophagia, skin rash, oral candidiasis, vaginal candidiasis, or neurologic symptoms. Severity was graded as 1 (mild), 2 (moderate), 3 (severe), or 4 (life-threatening) according to the Division of AIDS Table for Grading the Severity of Adult and Pediatric Adverse Events, version 2.0 [30].
Among participants with ARS, associations between various parameters and organ-specific manifestations were explored. Gastrointestinal manifestations were defined as nausea/vomiting and/or diarrhea. Neurologic manifestations were defined as headache and/or neurologic symptoms.
HIV Burden and Viral Characteristics
HIV RNA was measured in plasma and CSF using the Roche Amplicor HIV-1 Monitor Test version 1.5 or Roche COBAS AmpliPrep/COBAS TaqMan HIV-1 Test version 2.0 (Roche Diagnostics, Branchburg, New Jersey) with lower limit of detection in plasma 50 and 20 copies/mL, respectively, and in CSF 80 copies/mL. HIV RNA was measured in 1–2 frozen sigmoid biopsy specimens using the Siemens Quantiplex HIV-1 3.0 (Siemens Healthcare, Erlangen, Germany), with lower limit of detection 50 copies/mg. Total HIV DNA in blood and colon was quantified using a modified nested polymerase chain reaction with universal primers and probes as previously described [26, 31].
AHI was staged using criteria described by Fiebig et al [32]. HIV subtype was determined using the multiregion hybridization assay [33] or HIVSeq [34] program.
Cellular Immune Activation
Immunophenotyping was performed on cryopreserved peripheral blood mononuclear cells and freshly isolated colonic mucosal mononuclear cells as previously described [28, 35]. CD4 count and immune activation indicated by HLA-DR/CD38 coexpression on CD4 and CD8 cells were each assessed. CD8 count was measured in blood only.
Inflammation
Levels of inflammatory cytokines and chemokines in the peripheral blood, including tumor necrosis factor alpha (TNF-α), tumor necrosis factor receptor II (TNF-RII), interleukin 6 (IL-6), interleukin 17 (IL-17), interferon-γ–induced protein 10/C-X-C motif chemokine ligand 10 (IP-10/CXCL10), and monocyte chemoattractant protein 1/C-C motif chemokine ligand 2 (MCP-1/CCL2) were assayed in citrate plasma in duplicate using Luminex multiplex technology (Millipore, Billerica, Maryland). IL-6, MCP-1/CCL2, IP-10/CXCL10, and neopterin (GenWay Biotech, San Diego, California) were also measured in CSF using the multiplex Luminex or singleplex enzyme-linked immunosorbent assays (ELISAs). Single-analyte ELISAs were performed to measure interferon-alpha and soluble CD14 (sCD14) (R&D Systems, Minneapolis, Minnesota) and analyzed using SoftMax Pro (Molecular Devices, Sunnyvale, California). Peripheral blood D-dimer was measured by ELISA on a VIDAS instrument (bioMérieux, Durham, North Carolina), and C-reactive protein (CRP) was measured by electrochemiluminescence (Meso Scale Discovery, Gaithersburg, Maryland). Assays were performed for a subset of participants based on specimen availability.
Statistical Analyses
Among participants diagnosed with ARS, the frequency of each defining sign or symptom was tallied. Variables of interest were stratified according to the presence or absence of ARS, gastrointestinal manifestations of ARS, and neurologic manifestations of ARS. Comparisons were made between groups using the Mann-Whitney U test for continuous variables and Fisher exact test for categorical variables. Comparisons were made over time using the Wilcoxon signed-rank test. In sensitivity analyses, the study population was restricted to participants in Fiebig stages I/II at diagnosis to evaluate the impact of factors other than Fiebig stage on ARS risk. For all analyses, a 2-sided type I error of 5% was considered statistically significant, 10% was considered suggestive of a trend, and no formal adjustment was made for multiple comparisons. Analyses were performed using GraphPad Prism version 6.0 (GraphPad Software, San Diego, California) and Stata version 13.1 (StataCorp LP, College Station, Texas) software.
RESULTS
Study Population
During the study period, 212382 blood samples were screened, 527 individuals were diagnosed with AHI, and 430 participants enrolled during AHI. Of these, 335 (78%) presented with ≥3 signs and symptoms satisfying the criteria for ARS (Table 1). Participants had a median age of 26 (interquartile range [IQR], 23–31) years and were predominantly male (97%). CRF01_AE was the predominant HIV subtype, identified in 238 of the 293 (81%) samples that underwent subtyping. Participants with ARS had an increased duration since estimated HIV exposure and tended to be in later Fiebig stages compared with participants without ARS. ARS was observed in 15 of 56 (27%) participants enrolled during Fiebig stage I, 80 of 108 (74%) Fiebig II, 167 of 183 (91%) Fiebig III, 48 of 52 (92%) Fiebig IV, and 25 of 31 (81%) Fiebig V.
Characteristics of Participants With Acute Human Immunodeficiency Virus Infection in Bangkok, Thailand
| Characteristic | Overall (N = 430) | No ARS (n = 95) | ARS (n = 335) | P Value |
|---|---|---|---|---|
| Age, y, median (IQR) | 26 (23–31) | 26 (22–32) | 26 (23–31) | .898 |
| Male | 416 (96.7) | 91 (95.8) | 325 (97.0) | .521 |
| Risk group | .290 | |||
| MSM | 399 (92.8) | 85 (89.5) | 314 (93.7) | |
| Heterosexual male | 17 (4.0) | 6 (6.3) | 11 (3.3) | |
| Heterosexual female | 14 (3.2) | 4 (4.2) | 10 (3.0) | |
| Education level | .167 | |||
| Primary school or lower | 13 (3.0) | 4 (4.2) | 9 (2.7) | |
| Secondary school | 132 (30.7) | 37 (39.0) | 95 (28.4) | |
| Diploma | 29 (6.7) | 5 (5.2) | 24 (7.1) | |
| Bachelor degree or higher | 256 (59.5) | 49 (51.6) | 207 (61.8) | |
| Duration since HIV exposure, d, median (IQR) | 19 (15–25) | 15 (11–21) | 20 (16–26) | <.001 |
| No. of ARS symptoms, median (IQR) | 6 (3–8) | 1 (0–1) | 7 (5–9) | <.001 |
| HIV subtype (n = 293) | .573 | |||
| CRF01_AE | 238 (81.2) | 59 (81.9) | 179 (81.0) | |
| B | 11 (3.8) | 2 (2.8) | 9 (4.1) | |
| 01AE/B | 26 (8.9) | 5 (6.9) | 21 (9.5) | |
| Other | 3 (1.0) | … | 3 (1.4) | |
| Nontypeable | 15 (5.1) | 6 (8.3) | 9 (4.1) | |
| Fiebig stage | <.001 | |||
| I | 56 (13.0) | 41 (43.2) | 15 (4.5) | |
| II | 108 (25.1) | 28 (29.5) | 80 (23.9) | |
| III | 183 (42.6) | 16 (16.8) | 167 (49.9) | |
| IV | 52 (12.1) | 4 (4.2) | 48 (14.3) | |
| V | 31 (7.2) | 6 (6.3) | 25 (7.5) | |
| Initiated ART | 428 (99.5) | 95 (100) | 333 (99.4) | >.999 |
| Time from diagnosis to ART, d, median (IQR) | 0 (0–1) | 0 (0–1) | 0 (0–1) | .819 |
Data are presented as No. (%) unless otherwise indicated. Participants with acute HIV infection were categorized based on the presence or absence of ARS, defined by report or observation of ≥3 qualifying signs/symptoms on a standardized checklist. Comparisons were made between participants with and without ARS using the Mann-Whitney U test for continuous variables and the Fisher exact test for categorical variables. Statistically significant comparisons (P < .05) are in bold.
Abbreviations: ARS, acute retroviral syndrome; ART, antiretroviral therapy; HIV, human immunodeficiency virus; IQR, interquartile range; MSM, men who have sex with men.
All but 2 participants started ART during AHI. The median time from diagnosis to ART initiation was 0 (IQR, 0–1) days. After 24 weeks of ART, 343 of 398 (86%) participants with available data were virologically suppressed below the limit of detection (<20 or <50 copies/mL). After 96 weeks, 247 of 253 (98%) participants were virologically suppressed.
Optional sigmoid colon biopsy was completed for 60 participants during AHI, 38 participants after 24 weeks of ART, and 22 participants after 96 weeks of ART. CSF collection was completed for 105, 46, and 21 participants, respectively.
Clinical Features of ARS
Among the 335 participants with ARS, the most common findings were fever (93%) and fatigue (79%) (Table 2). Of participants with ARS, 177 (53%) reported gastrointestinal manifestations and 217 (65%) reported neurologic manifestations. Participants with gastrointestinal manifestations included 41 (33%) with nausea/vomiting, 83 (47%) with diarrhea, and 53 (30%) with both. Participants with neurologic manifestations mostly reported headache (207 [95%]) and 8 (4%) reported both headache and another unspecified neurologic symptom.
Signs and Symptoms of Participants With Acute Human Immunodeficiency Virus Infection
| Sign/Symptom | No ARS (n = 95) | ARS (n = 335) |
|---|---|---|
| Fever | 20 (21) | 313 (93) |
| Fatigue | 8 (8) | 265 (79) |
| Pharyngitis | 6 (6) | 223 (67) |
| Headache | 6 (6) | 215 (64) |
| Myalgia | 4 (4) | 192 (57) |
| Anorexia | 1 (1) | 180 (54) |
| Weight loss | 2 (2) | 143 (43) |
| Diarrhea | 10 (11) | 136 (41) |
| Skin rash | 5 (5) | 131 (39) |
| Arthralgia | 1 (1) | 99 (30) |
| Oral ulcer | 3 (3) | 96 (29) |
| Nausea/vomiting | … | 94 (28) |
| Adenopathy | 3 (3) | 60 (18) |
| Odynophagia | … | 29 (9) |
| Genital ulcer | 3 (3) | 27 (8) |
| Oral candidiasis | … | 15 (4) |
| Neurologic symptoms | … | 10 (3) |
| Vaginal candidiasis (females only, n = 14) | … | 5 (36) |
Data are presented as No. (%). Signs and symptoms were recorded by study staff based on participant report and physical examination. Acute retroviral syndrome (ARS) was defined by the presence of ≥3 qualifying signs/symptoms.
Abbreviation: ARS, acute retroviral syndrome.
There were no grade 4, potentially life-threatening events. Severe (grade 3) signs/symptoms included 7 reports of fever, 3 headache, 2 fatigue, 2 myalgia, and 1 case each of arthralgia and genital ulcer.
HIV Burden
As compared to those without ARS, participants with ARS had higher levels of HIV RNA in the blood, colon, and CSF (Figure 1). Peripheral blood total HIV DNA was elevated in the ARS group with a trend toward increased integrated HIV DNA as well (P = .09; Figure 2). In the colon, no statistically significant differences in total or integrated HIV DNA were observed. After 96 weeks of ART, all baseline differences in HIV burden disappeared, with the vast majority of participants achieving undetectable HIV RNA in each body compartment and many achieving undetectable HIV DNA as well.
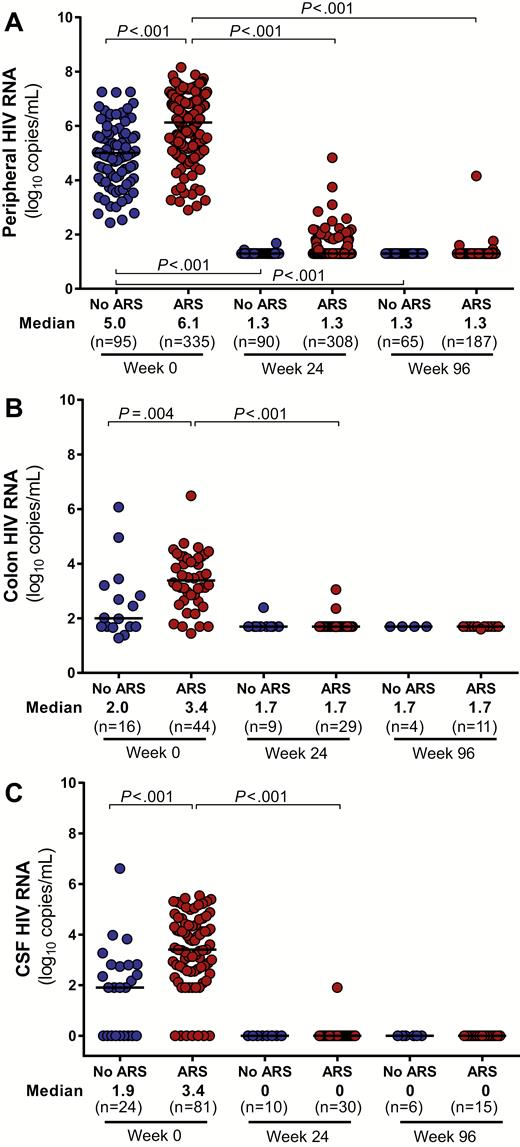
Human immunodeficiency virus (HIV) viral loads in peripheral blood (A), colon (B), and cerebrospinal fluid (CSF) (C). HIV RNA measurements in various body compartments during acute HIV infection (AHI, week 0) and after up to 96 weeks of antiretroviral therapy are compared between participants with and without acute retroviral syndrome (ARS) during AHI. Statistically significant pairwise comparisons (P < .05) are identified.
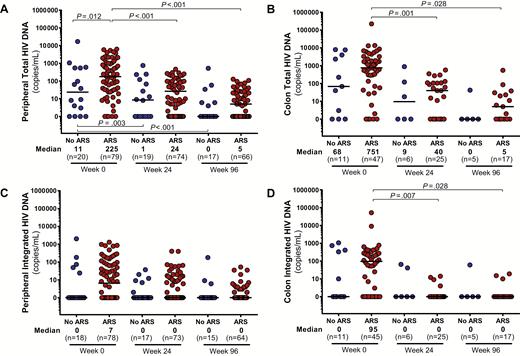
Total and integrated human immunodeficiency virus (HIV) DNA in peripheral blood (A and C) and colon (B and D). Measurements during acute HIV infection (AHI, week 0) and after up to 96 weeks of antiretroviral therapy are compared between participants with and without acute retroviral syndrome (ARS) during AHI. Statistically significant pairwise comparisons (P < .05) are identified.
Cellular Immune Activation
Participants with ARS demonstrated greater CD4 cell depletion in the blood and colon compared to participants without ARS (Figure 3). Similar peripheral CD8 counts in the 2 groups resulted in lower CD4/CD8 ratios for participants with ARS. Absolute CD4 counts in the blood and colon, as well as peripheral CD4/CD8 ratio, equilibrated between the 2 groups after 96 weeks of ART. Participants with ARS had higher levels of colonic CD8 activation, measured by HLA-DR/CD38 expression, but this difference disappeared after 96 weeks of ART (Figure 4). Peripheral CD8 activation did not differ between groups and decreased in both groups after ART initiation. No differences in peripheral or colonic CD4 activation were observed.
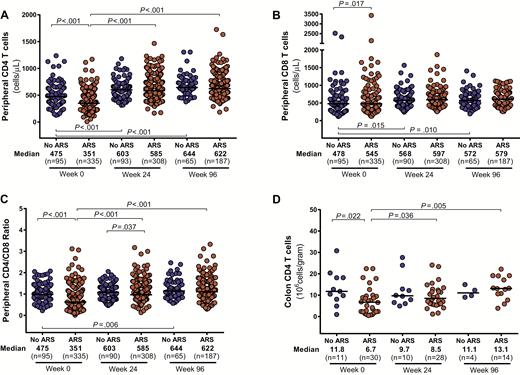
Absolute CD4 (A) and CD8 (B) cell count in peripheral blood, CD4/CD8 ratio in peripheral blood (C), and absolute CD8 count in colon (D). Measurements during acute human immunodeficiency virus (HIV) infection (AHI, week 0) and after up to 96 weeks of antiretroviral therapy are compared between participants with and without acute retroviral syndrome (ARS) during AHI. Statistically significant pairwise comparisons (P < .05) are identified.
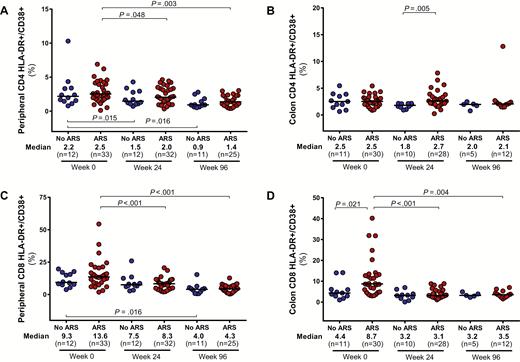
CD4 and CD8 cell activation in peripheral blood (A and C) and colon (B and D). Measurements during acute human immunodeficiency virus (HIV) infection (AHI, week 0) and after up to 96 weeks of antiretroviral therapy are compared between participants with and without acute retroviral syndrome (ARS) during AHI. Statistically significant pairwise comparisons (P < .05) are identified. Abbreviation: HLA-DR, human leukocyte antigen–D related.
Inflammation
Soluble inflammatory biomarkers were elevated in the peripheral blood of the ARS group compared with the non-ARS group, including TNF-α, CRP, and D-dimer, with a trend toward higher levels of IL-6 (P = .09; Figure 5). TNF-RII was also elevated in the ARS group (median, 3980 [IQR, 3056–6386] pg/mL vs 2229 [IQR, 1897–3363] pg/mL; P < .01). After 96 weeks of ART, persistent elevations in TNF-α and IL-6 were observed in the ARS group but other inflammatory biomarkers had equilibrated between the 2 groups. No differences were observed in sCD14 at baseline or after 96 weeks of ART. Markers of inflammation in the central nervous system (CNS) were also elevated among participants with ARS as compared to those without, including CSF neopterin, IL-6, and MCP-1/CCL2 (Supplementary Figure 1). No differences were observed in levels of IP-10 at baseline or in any CSF biomarkers after 96 weeks of ART.
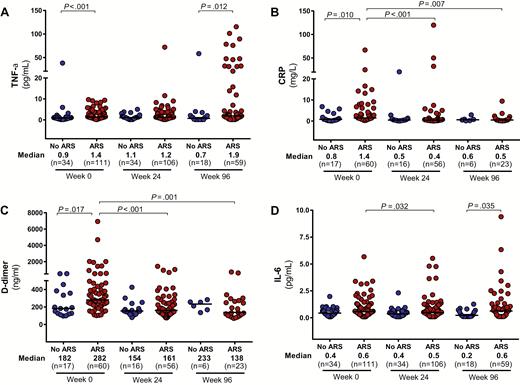
Peripheral inflammatory markers. Measurements of TNF-α (A), CRP (B), D-dimer (C), and IL-6 (D) in the peripheral blood during acute human immunodeficiency virus (HIV) infection (AHI, week 0) and after up to 96 weeks of antiretroviral therapy are compared between participants with and without acute retroviral syndrome (ARS) during AHI. Statistically significant pairwise comparisons (P < .05) are identified. Abbreviations: TNF-α, tumor necrosis factor alpha; CRP, C-reactive protein; IL-6, interleukin 6.
Associations With Gastrointestinal and Neurologic Manifestations of ARS
Comparisons of peripheral markers of immune activation and inflammation showed no significant differences between participants with gastrointestinal manifestations of ARS and those without such manifestations. No differences between these groups were observed in flow cytometric analyses of peripheral blood or colonic mucosal mononuclear cells or assessments of HIV RNA and DNA burden in colon biopsy specimens.
Participants with neurologic manifestations of ARS tended to have higher peripheral HIV RNA than did participants without neurologic manifestations (median, 6.2 [IQR, 5.5–6.9] log10 copies/mL vs 5.9 [IQR, 5.3–6.8] log10 copies/mL; P = .04). No significant differences in total or integrated plasma HIV DNA were noted. Participants with neurologic manifestations of ARS also had higher peripheral levels of TNF-α (1.8 [IQR, 1.0–3.0] vs 1.1 [IQR, 0.7–1.9]; P = .03), but not other markers of inflammation such as IL-6, CRP, sCD14, or D-dimer. In the CSF, neurologic manifestations were associated with higher median neopterin (3114 [IQR, 1715–4591] pg/mL vs 1875 [IQR, 908–2952] pg/mL; P = .03) and IP-10/CXCL10 (3257 [IQR, 2016–7246] pg/mL vs 1719 [IQR, 935–3363] pg/mL; P = .05).
Sensitivity Analyses
As Fiebig stage was associated with both ARS and other factors that may influence ARS pathogenesis, such as HIV viral load, sensitivity analyses were performed in which the study population was restricted to the 164 participants in Fiebig stages I/II (Table 3). Among these participants, the median duration since estimated HIV exposure was 15 (IQR, 11–21) days for those without ARS and 17 (IQR, 14–22) days for those with ARS (P = .02).
Markers of Viral Burden and Immune Activation Among Participants Diagnosed During Fiebig Stages I and II
| Marker | Fiebig I/II | P Value | |
|---|---|---|---|
| No ARS (n = 69) | ARS (n = 95) | ||
| Peripheral blood | |||
| CD4 count, cells/µL | 475 (332–626) | 309 (249–457) | <.001 |
| CD4/CD8 ratio | 1.1 (0.9–1.4) | 1 (0.7–1.4) | .102 |
| HLA-DR/CD38 expression on CD4, % | 2 (1.4–3.3) | 2.2 (1.1–2.6) | .838 |
| HLA-DR/CD38 expression on CD8, % | 8.3 (7.4–9.7) | 6.7 (5.7–15.4) | .744 |
| HIV RNA, log10 copies/mL | 4.8 (4–5.5) | 5.9 (5.4–6.4) | <.001 |
| Total HIV DNA, copies/106 PBMCs | 8 (0–64) | 158.5 (30–616) | .003 |
| Integrated HIV DNA, copies/106 PBMCs | 0 (0–0) | 3 (0–47) | .033 |
| IL-6, pg/mL | 0.5 (0.3–0.8) | 0.6 (0.3–1.0) | .193 |
| CRP, µg/mL | 0.8 (0.2–3.6) | 2.2 (0.9–7.9) | .035 |
| TNF-α, pg/mL | 1 (0.5–1.5) | 1.1 (0.7–3.0) | .161 |
| sCD14, µg/L | 1.2 (1–1.7) | 1.6 (1.2–1.9) | .048 |
| D-dimer (ng/mL) | 178.7 (126.6–357.4) | 280.4 (220.4–389.2) | .023 |
| Sigmoid colon | |||
| CD4 count, 106 cells/g | 12.7 (10.5–18.2) | 8.6 (2.3–10) | .058 |
| HLA-DR/CD38 expression on CD4, % | 2 (1.4–3.5) | 2.3 (1.5–2.5) | .895 |
| HLA-DR/CD38 expression on CD8, % | 4.3 (2.9–6.0) | 4.6 (3.7–6.7) | .270 |
| HIV RNA, log10 copies/mg | 1.8 (1.7–2.7) | 3.2 (2.2–4.1) | .028 |
| Total HIV DNA, copies/106 cells | 40 (0–222) | 492 (0–1610) | .418 |
| Integrated HIV DNA, copies/106 cells | 0 (0–10) | 52 (0–95) | .309 |
| Cerebrospinal fluid | |||
| WBC count, cells/µL | 0 (0–0) | 0 (0–3) | .310 |
| HIV RNA, log10 copies/mL | 1.9 (0–2.8) | 2.2 (1.9–3.1) | .163 |
| MCP-1/CCL2, pg/mL | 698.6 (583.6–866.3) | 1200 (983.2–2409.7) | .005 |
| Neopterin, pg/mL | 1044 (588–1149) | 2293 (908–4665) | .017 |
| IL-6, pg/mL | 1.5 (1–2.3) | 2.7 (1.9–8.4) | .013 |
| IP-10/CXCL10, pg/mL | 2192 (792–4236) | 2162 (1496–3482) | .824 |
All values are presented as median (interquartile range). Collection of sigmoid colon biopsies and cerebrospinal fluid was performed only on a subset of participants who provided separate informed consent. Not every participant underwent every procedure and not all tests were run on all specimens. Statistically significant comparisons between groups (P < .05) are in bold.
Abbreviations: ARS, acute retroviral syndrome; CRP, C-reactive protein; HIV, human immunodeficiency virus; IL-6, interleukin 6; IP-10/CXCL10, interferon γ–induced protein 10/C-X-C motif chemokine ligand 10; MCP-1/CCL2, monocyte chemoattractant protein 1/C-C motif chemokine ligand 2; PBMC, peripheral blood mononuclear cell; sCD14, soluble CD14; TNF-α, tumor necrosis factor alpha; WBC, white blood cell.
As in the primary analyses, Fiebig I/II participants with ARS demonstrated elevated markers of HIV burden in the periphery and colon, including plasma HIV RNA, plasma total HIV DNA, plasma integrated HIV DNA, and colonic HIV RNA. In contrast to the primary analyses, CSF HIV RNA did not differ between Fiebig I/II participants with and without ARS. ARS was again associated with CD4 depletion in blood and a trend toward CD4 depletion in the colon. Among the peripheral inflammatory biomarkers that were associated with ARS in the primary analyses, both CRP and D-dimer were elevated among Fiebig I/II participants with ARS. As in the primary analyses, CSF markers of inflammation were elevated with ARS, including neopterin, IL-6, and MCP-1/CCL2.
DISCUSSION
ARS was common in this cohort of Thai participants with AHI, and fever was the most frequent symptom. This is consistent with many descriptions of ARS in various populations [1, 3–6, 8–14]. High frequency of fatigue, pharyngitis, headache, and myalgia have also been previously reported. Lymphadenopathy was relatively uncommon in this study, as compared to prior reports, which may reflect unique characteristics of subtype CRF01_AE pathogenesis or host responses in Thai or Asian individuals, neither of which are well-represented in prior studies of ARS. However, this differs from the observations in one previous study that included Thai participants, which reported lymphadenopathy in 16 of 17 (94%) Thai participants but in only 3 of 31 (9%) East African participants with AHI [14].
While HIV RNA levels were increased across all body compartments with ARS, including the gastrointestinal tract and CNS, organ-specific HIV RNA levels were not associated with organ-specific symptomatology. Instead, organ-level evidence of immune activation was associated with both gastrointestinal and neurologic symptoms. As observed in this study, previous work has demonstrated a direct association between CNS inflammation and neurologic symptomatology during AHI [36]. In contrast, prior studies have demonstrated inconsistent findings regarding associations between neurologic symptoms and CNS viral load during early infection [36–38]. Prior data about predictors of gastrointestinal symptoms during AHI are scarce. While viral replication may instigate immune activation and inflammation, this study adds to the body of evidence suggesting that a more complicated milieu of host-virus interactions influences the magnitude of host response and development of symptoms.
Prior studies have suggested differences in HIV pathogenesis depending on subtype. CRF01_AE, which is the predominant subtype in Southeast Asia, has been associated with faster disease progression and greater likelihood of CXCR4 tropism as compared to non-CRF01_AE subtypes [39, 40]. There are also reports of HIV subtype impacting CD4 decline [41], immunologic response to ART [42], and virologic response to ART [43]. In this study, the majority of participants had CRF01_AE infection and we did not observe a difference in ARS prevalence by HIV subtype.
Previous studies of untreated recent or chronic infection have shown a direct correlation between HIV viral load and CD4 activation [44]. However, in our study of acute infection, no differences were observed in CD4 activation between participants with and without ARS despite differences in viral load across all body compartments examined. In acute infection, we have previously shown that cycling of peripheral CD8 and colonic CD4 and CD8 cells, as indicated by the expression of Ki67, correlated with plasma and colonic HIV RNA, respectively [35]. That same study demonstrated that only colonic CD8 activation, as measured by coexpression of HLA-DR/CD38, and not CD4 activation correlated with plasma and colonic HIV RNA. This indicates that different activation markers could show different expression patterns on CD4 and CD8 cells. Determinants of cellular immune responses during acute infection and in relation to ARS require further investigation.
After 96 weeks of ART, many baseline differences between participants with and without ARS disappeared. The mechanisms linking duration and severity of untreated ARS to disease progression and adverse long-term clinical outcomes have not been characterized, but if chronic inflammation plays a role, then early ART may not fully prevent or reverse these pathophysiological processes [45]. In this study, there was evidence of persistent peripheral inflammation despite suppressive therapy. This may be a long-term consequence of early events in HIV pathogenesis or it may reflect differences in host immunity that promote both increased symptomatology during AHI and increased inflammation in response to HIV. Further research is needed to characterize drivers of inflammation despite early initiation of suppressive ART and to determine the clinical impact of this finding.
This study characterized the clinical presentation, HIV burden, and biomarkers across multiple body compartments associated with ARS among Thai participants with AHI. Although clinical data were available for all participants, invasive procedures were optional and these analyses were limited by smaller sample sizes for some specimens and time points. Self-selection for participation in optional procedures may have introduced bias into analyses. This study described reported and observed clinical features of ARS ascertained at the time of HIV diagnosis but was not designed to describe the evolution of these features throughout the stages of AHI. Factors such as age, race, and gender may have influenced the outcomes reported in these analyses but could not be fully explored in this young, Thai, predominantly MSM cohort of individuals who presented for voluntary HIV testing. Our findings may not be generalizable to other populations. The study’s recruitment method, which relied on self-referral to voluntary HIV testing, may have enriched the proportion of participants with symptoms. In comparison to the more than three-quarters of participants in this cohort who experienced ARS, the RV217 study of HIV seroconverters followed prospectively in Thailand and East Africa reported that 94% of participants had at least 1 sign or symptom during twice-weekly encounters throughout untreated AHI, but that study reported fewer overall findings than are reported here [14].
This study demonstrated that AHI was frequently symptomatic in this cohort. ARS was associated with high viral burden, CD4 depletion, and immune activation across multiple body compartments. While many of these differences between participants with and without ARS resolved after prolonged ART, some evidence of increased chronic inflammation was observed among participants who experienced ARS despite suppressive ART initiated during AHI. Further research is needed to determine if this persistent inflammation may contribute to morbidity and mortality among participants who experienced ARS and whether ARS may have any long-term effects on clinical outcomes even when ART is initiated during AHI.
Supplementary Data
Supplementary materials are available at Clinical Infectious Diseases online. Consisting of data provided by the authors to benefit the reader, the posted materials are not copyedited and are the sole responsibility of the authors, so questions or comments should be addressed to the corresponding author.
Notes
Author contributions. T. A. C. designed this analysis and authored the first draft of the manuscript. D. J. C., J. L. K. F., and E. K. contributed to the analytic design and collected clinical data. S. P. performed statistical analyses. A. S., S. J. K., B. M. S., L. L., N. Chomont, J. L. J., I. S., N. S. U., and R. D. performed laboratory evaluations and assisted in their interpretation. R. R. conducted colon biopsies. N. Chomchey and R. T. collected clinical data. V. G. V., S. S., N. L. M., M. L. R., and N. P. assisted in the interpretation of the analysis and provided project oversight. J. A. conceived of the analysis, contributed to its design, assisted in the interpretation of results, and provided project oversight. All authors reviewed this manuscript, provided feedback, and approved of the manuscript in its final form.
Acknowledgments. We thank our study participants and staff from the Thai Red Cross AIDS Research Centre, Chulalongkorn University, and Armed Forces Research Institute of Medical Sciences (AFRIMS) for their valuable contributions to this study. We are grateful to the Thai Government Pharmaceutical Organization, Gilead, Merck, and ViiV Healthcare for providing the antiretrovirals for this study.
RV254/SEARCH 010 Study Group. Nipat Teeratakulpisarn, Carlo Sacdalan, Duanghathai Sutthichom, Somprartthana Rattanamanee, Peeriya Prueksakaew, Sasiwimol Ubolyam, Pacharin Eamyoung, Suwanna Puttamaswin, Somporn Tipsuk, and Putthachard Karnsomlap (SEARCH/TRCARC/HIV-NAT); Wiriyaporn Ridtitid (Chulalongkorn University); Robert J. O’ Connell, Siriwat Akapirat, Yuwadee Phuang-Ngern, Suchada Sukhumvittaya, Chayada Sajjaweerawan, Surat Jongrakthaitae, Putita Saetun, Nipattra Tragonlugsana, Bessara Nuntapinit, Nantana Tantibul, and Hathairat Savadsuk (AFRIMS); and Sodsai Tovanabutra (US Military HIV Research Program).
Disclaimer. The views expressed are those of the authors and should not be construed to represent the positions of the US Army, the Department of Defense, or the Department of Health and Human Services. The investigators have adhered to the policies for protection of human subjects as prescribed in AR-70.
Financial support. This work was supported by cooperative agreements (W81XWH-07-2-0067 and W81XWH-11-2-0174) between the Henry M. Jackson Foundation for the Advancement of Military Medicine and the US Department of the Army; by an intramural grant from the Thai Red Cross AIDS Research Centre; by the Intramural Research Program of the National Institute of Allergy and Infectious Diseases at the National Institutes of Health (NIH) and the Delaney AIDS Research Enterprise to find a cure (grant number 1U19AI096109); and via federal funds from the National Cancer Institute at the NIH (contract number HHSN261200800001E). J. A., V. G. V., and S. S. are partially funded by National Institute of Neurological Disorders and Stroke (R01-NS084911) and the National Institute of Mental Health (R01-MH095613) at the NIH. Antiretroviral therapy was supported by the Thai Government Pharmaceutical Organization, Gilead, Merck, and ViiV Healthcare.
Potential conflicts of interest. T. A. C. has received a speakers’ fee from Gilead Sciences. N. Chomont has served on the scientific advisory board of Theravectys. J. A. and V. G. V. have participated in advisory meetings for ViiV Healthcare and Merck. All other authors report no potential conflicts. All authors have submitted the ICMJE Form for Disclosure of Potential Conflicts of Interest. Conflicts that the editors consider relevant to the content of the manuscript have been disclosed.
Presented in part: IDWeek 2014, Philadelphia, Pennsylvania, 8–12 October 2014.


Comments