


Abstract
Inactivated influenza vaccine (IIV) and pertussis vaccination are recommended in pregnancy. Limited safety data exist for women who received IIV vaccine during the first trimester of pregnancy or received both vaccines in pregnancy. We assessed adverse birth outcomes between vaccinated and unvaccinated pregnancies.
Among prospectively enrolled Australian “FluMum” participants (2012–2015), primary exposure was receipt and timing of IIV during pregnancy. Primary outcomes included preterm birth, low birthweight at term (LBWT), and small for gestational age (SGA). We compared birth outcomes for IIV in pregnancy with women unvaccinated in pregnancy using Cox proportional hazard ratios (HRs) with 95% confidence intervals (CIs). Adjusted HRs (aHRs) controlled for potential confounding variables. Sensitivity analyses were conducted in a subgroup of women who received pertussis vaccination during pregnancy to assess whether associations between IIV and adverse outcomes were maintained after adjusting for pertussis vaccination.
Among 8827 participants in our study, women who received IIV in pregnancy did not have an elevated risk of an adverse birth outcome compared with unvaccinated pregnant women: preterm births (HR, 1.10 [95% CI, .92–1.31]; P = .28); LBWT (HR, 1.05 [95% CI, .76–1.44]; P = .77); or SGA (HR, 0.99 [95% CI, .86–1.15]; P = .94). Adjustment for pertussis vaccination during pregnancy yielded similar results: preterm births (aHR, 1.05 [95% CI, .82–1.34]; P = .69); LBWT (aHR, 0.81 [95% CI, .50–1.29]; P = .37); SGA (aHR, 0.92 [95% CI, .74–1.14]; P = .43). There was no evidence of elevated risk by trimester of IIV.
No significant associations were found between maternal IIV or pertussis vaccination in pregnancy and adverse birth outcomes, regardless of the trimester of pregnancy a vaccination was given compared to unvaccinated pregnancies.
Pregnant women are a high-priority group for inactivated influenza vaccination [1]. This global strategy is predominantly aimed at preventing and reducing illness and deaths that occur in women who are infected with influenza in pregnancy, with the potential added benefit of providing protection for their infant in the first few months of life [2, 3].
Infants <4 months of age also experience the highest age-specific notification rates from pertussis infections [4–7]. As a result of being too young to be protected from routine immunization schedules, these infants also incur the highest morbidity and mortality from pertussis infection [8–10]. In response to a national pertussis epidemic in the United Kingdom in 2012 [11], and consequently to address the high burden of pertussis infections in these youngest infants, adult-formulation diphtheria, tetanus, and acellular pertussis vaccine (DTaP) was recommended for all women in the third trimester of every pregnancy [11, 12], and has been adopted in other countries.
Inactivated influenza vaccines (IIVs) and DTaP (pertussis) vaccines are both routinely recommended in pregnancy in Australia as part of the National Immunisation Program [13–15]. Pregnant women are commonly excluded from industry-sponsored clinical trials [16] and, although results published thus far on effectiveness and safety from randomized clinical trials have been encouraging for maternal IIV [17, 18], large-scale maternal and infant perinatal safety data are limited, and important gaps in the evidence base remain [19–24]. Methodological concerns regarding the possible underestimation of adverse events in vaccinated women and inconsistency in the current research evidence regarding adverse birth outcomes provide one rationale for further studies [25, 26]. The World Health Organization Global Advisory Committee on Vaccine Safety has identified a relative lack of data on the safety of influenza vaccines given in the first trimester of pregnancy [27]. Safety data for women and infants where both IIV and pertussis vaccines have been received during pregnancy are also scarce [28].
We previously examined low birthweight and preterm births in mothers who received an IIV vaccine during pregnancy using interim data from the “FluMum” study [29]. We now aim to assess the association between a range of adverse perinatal outcomes by maternal IIV status and trimester of pregnancy using the full FluMum prospective cohort dataset. We also aimed to use a subset of the FluMum dataset (2014–2015) to assess the association between adverse perinatal outcomes by self-reported maternal pertussis vaccination status.
METHODS
Study Design and Population
The FluMum prospective study cohort, described elsewhere [30], had a proposed sample size of 10106 mother-infant pairs recruited from maternity hospitals at 6 participating sites in Australia from 2012 to 2015. The study was designed to detect average vaccine uptake in pregnancy of 30% over the 4-year study period, accurate to within ±5% per year per site, and effectiveness of IIV in pregnancy against laboratory-confirmed influenza in infancy of at least 40% [30].
Mother-infant pairs were eligible for enrollment only once during the lifetime of the study. A requirement from our Human Research Ethics Committee limited the study cohort to live birth infants only, precluding women who had birthed a stillborn infant from being approached, and excluded women who had experienced pregnancy loss prior to 20 weeks’ gestation (miscarriage). Recruitment was planned to maximize the potential for infant exposure to influenza during typical Australian influenza seasons (April–October for 5 sites located in temperate regions and year-round for 1 site located in the tropics).
Inclusion and eligibility criteria have been previously published [30] and are summarized in Table 1.
Inclusion and Eligibility Criteria for Enrolling FluMum Study Participants, 2012–2015
| Participant must be ≥17 years of age at consent |
| Only liveborn infants ≤55 days of age at enrollment |
| Participant must speak and understand sufficient verbal English |
| Excluded: Planning to move overseas before infant reaches 6 months of age |
| Participant must be ≥17 years of age at consent |
| Only liveborn infants ≤55 days of age at enrollment |
| Participant must speak and understand sufficient verbal English |
| Excluded: Planning to move overseas before infant reaches 6 months of age |
Participant information was collected at study entry and at 6 months postpartum using a detailed questionnaire administered by trained research study staff. Assessment of the gestational age, birthweight, and trimester of IIV were all specified in our previously published article [29], as were the methods for establishing the gestational age in weeks at birth of the infant and calculating the trimester of pregnancy that IIV was administered [29]. Here we report post hoc analyses of safety outcomes, where we have excluded enrolled multiparous pregnancies on the basis of known increased risk of adverse outcomes among this subgroup.
Our primary exposure of interest was receipt and timing of an IIV given during pregnancy with adjustment for receipt of pertussis vaccination in pregnancy, compared with unvaccinated pregnant women. The primary outcomes of interest were preterm birth (<37 completed weeks’ gestation) [31], small for gestational age (SGA), and low birthweight (<2500 g) at term (LBWT) [32]. Only viable pregnancies were included in this study. In Australia, a viable pregnancy is ≥20 weeks’ gestation and/or ≥400 g; SGA was defined as birthweight lower than the 10th percentile and calculated using Australian national birthweight percentiles by sex and gestational age [33]. In addition to SGA, we also report the outcome LBWT (≥37 weeks’ gestation) as a means of describing birthweight in those infants who were not born preterm.
Exposure Methods
Participants were excluded if IIV status during pregnancy was unknown or missing. Confirmation of IIV status and date of vaccination were obtained by contacting nominated healthcare providers.
The maternal pertussis vaccination program was nationally recommended in April 2015 [15]. Pertussis vaccination status in pregnancy was ascertained by self-report from a subset of study participants in the final 2 years of the FluMum study (2014–2015). Dates of receipt of pertussis vaccinations were not routinely recorded. We anticipated that study participants were vaccinated for pertussis in the third trimester of pregnancy (>28 weeks’ gestation), given this is when the vaccine is recommended in Australia [14]. When conducting our time-dependent analyses, study participants who received both influenza and pertussis vaccines in the third trimester of pregnancy were assumed to have been vaccinated on the same date as the influenza vaccination. For study participants who self-reported a pertussis-only vaccine in pregnancy (no IIV in pregnancy), or had received IIV in the first or second trimester of pregnancy, we assumed that pertussis vaccination was given at 28 weeks’ gestation as a conservative option for time-dependent data analyses.
Data were collected from study participants to ascertain and compare maternal demographic characteristics, comorbidities, and maternal risk factors for acquiring respiratory infections (Table 2) [15]. Infant sex and Aboriginal and/or Torres Strait Islander status (hereafter respectfully referred to as Indigenous) were also collected. These data were analyzed to determine whether there were differences between the vaccinated and unvaccinated groups.
Comorbidities and/or Risk Factors for Respiratory Infection in Pregnant Women
| Diabetes (type 1, type 2, and gestational diabetes) |
| Hypertension (essential, gestational, preeclampsia, eclampsia) |
| Renal disease |
| Cardiac disease |
| Asthma, bronchitis, and pneumonia requiring hospitalization |
| Cancer requiring treatment |
| Immunosuppressive conditions (including HIV/AIDS) |
| Taking immunosuppressive medications |
| Smoking in pregnancy (any stage) Exposure to household and/or indoor smoke during pregnancy |
Abbreviation: HIV, human immunodeficiency virus.
Data Analysis
Data were analyzed using Stata statistical software version 14.1 (StataCorp, College Station, Texas). Summary statistics were reported to describe demographic and risk-factor characteristics in mother-infant pairs between IIV and unvaccinated pregnant women. Means and medians were calculated for continuous variables and, to minimize immortal time bias, we used the continuous variable “gestation at birth of the infant” as the time-scale variable when conducting our time-dependent analyses. Effect estimates are presented as Cox proportional hazard ratios and adjusted hazard ratios, with 95% confidence intervals. Given that we commenced data collection for maternal pertussis vaccination status in pregnancy from the year 2014 of the study period, our 2-way sensitivity analysis comparing maternal characteristics and primary perinatal outcomes by maternal IIV and pertussis vaccination status was restricted to the years 2014–2015 (inclusive).
Ethics committee approvals were gained for all jurisdictional participating sites and affiliated research institutions, with written informed consent obtained from all participants.
RESULTS
In the FluMum cohort there were 9772 eligible, consented women who gave birth to a live infant between 1 April 2012 and 31 December 2015. We excluded 945 women for multiple births, unknown or missing vaccination status during pregnancy, or where a date of an influenza vaccine during pregnancy was unable to be confirmed. The remaining 8827 mother-infant pairs were included in the final analysis (Figure 1).
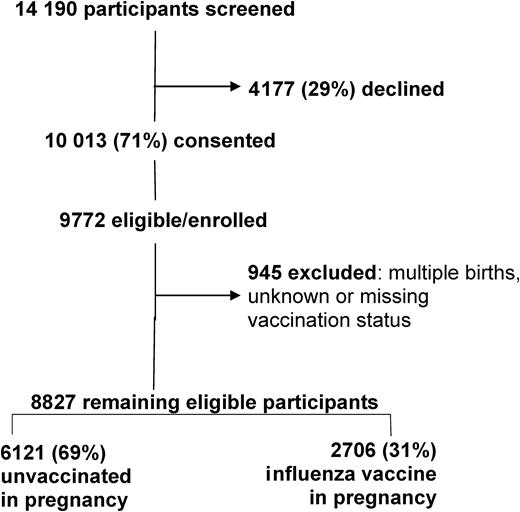
Consort diagram of FluMum study participants by maternal vaccination status, Australia, 2012–2015. Participants were evenly distributed throughout the 6 Australian study sites and the majority of the cohort (69%) had not received inactivated influenza vaccine in pregnancy.
Demographic Characteristics
The mean maternal age of women at infant birth was 31.8 years (range, 17.2–50.1 years). Eighty-nine percent presented for antenatal care in the first trimester of pregnancy, and 63% of women were recruited through public hospitals; 52% of the infants were male. Indigenous status was captured in >99% of study participants and overall, 229 (3%) mothers and 344 (4%) infants identified as Indigenous. Median gestational age at infant birth was 39 weeks (range, 25–42 weeks) and 93% of infants were born at term. The mean birthweight of infants was 3373 g; 10% were born SGA (864/8770) and 2% were LBWT. Other maternal demographic characteristics and differences between the groups in relation to comorbidities and risk factors by vaccination status are shown in Table 3.
Demographic Characteristics of Pregnant Women, Pregnancy Exposures, and Birth Outcomes by Maternal Influenza Vaccination Status and Trimester of Vaccination, FluMum Study, Australia (2012–2015)
| Characteristic or Outcome | Unvaccinated (Reference Group) | IIV in Pregnancy | IIV in First Trimester | IIV in Second Trimester | IIV in Third Trimester |
|---|---|---|---|---|---|
| Overall | 6121/8827 (69) | 2706/8827 (31) | 332/2690 (12) | 1044/2690 (39) | 1314/2690 (49) |
| Women | |||||
| Mean age at infant birth, y | 31.6 | 32.1 | 31.7 | 32.2 | 32.1 |
| Indigenous, self-identified | 153/6085 (3) | 76/2690 (3) | 23/332 (7) | 29/1044 (3) | 24/1314 (2) |
| Maternal education diploma or higher | 3403/5397 (63) | 1692/2417 (70) | 210/295 (71) | 630/918 (69) | 852/1204 (71) |
| English as main language spoken | 4851/5937 (82) | 2196/2635 (83) | 265/325 (82) | 841/1016 (83) | 1090/1294 (84) |
| Heart disease | 38/6084 (<1) | 19/2688 (<1) | <5/331 (<1) | 11/1044 (1) | 6/1313 (<1) |
| Hypertensiona | 585/6085 (10) | 289/2689 (11) | 39/331 (12) | 110/1044 (11) | 140/1314 (11) |
| Severe pneumonia requiring hospitalization | 94/6085 (2) | 55/2689 (2) | 6/331 (2) | 27/1044 (3) | 22/1314 (2) |
| Chronic respiratory conditionsb | 98/6085 (2) | 57/2689 (2) | 5/331 (2) | 26/1044 (2) | 26/1314 (2) |
| Immunosuppressive conditionsc | 47/6084 (<1) | 29/2689 (1) | <5/331 (<1) | 9/1044 (<1) | 18/1314 (1) |
| Cancer requiring treatment | 42/6084 (<1) | 14/2687 (<1) | <5/331 (<1) | 6/1043 (<1) | 6/1313 (<1) |
| Diabetesd | 484/6084 (8) | 268/2688 (10) | 33/331 (10) | 105/1044 (10) | 130/1313 (10) |
| Pregnancy | |||||
| Attended antenatal care in first trimester | 5507/6082 (91) | 2470/2691 (92) | 301/331 (91) | 930/1042 (89) | 1181/1303 (91) |
| Smoking in pregnancy, self report | 444/6085 (7) | 140/2689 (5) | 23/331 (7) | 67/1044 (6) | 50/1314 (4) |
| Exposed to indoor smoke in pregnancy | 172/6067 (3) | 53/2687 (2) | 10/332 (3) | 25/1043 (2) | 18/1312 (1) |
| Exposed to household smoke in pregnancy | 1264/6068 (21) | 430/2690 (16) | 69/332 (21) | 174/1044 (17) | 187/1314 (14) |
| Children attending daycare facility | 1518/6079 (25) | 588/2688 (22) | 71/332 (21) | 237/1043 (23) | 280/1313 (21) |
| Received pertussis-containing vaccine in pregnancye | 368/2998 (12) | 781/1672 (47) | 29/180 (4) | 204/576 (18) | 548/916 (48) |
| Birth | |||||
| Gestational age, wk, median (range)e | 38.8 (25–43) | 38.8 (28–42) | 38.6 (28–42) | 38.7 (28–42) | 38.9 (30–42) |
| Difference (95% CI) | 0 (–.04 to .11), P = .40 | –0.2 (–.01 to .38) | –0.1 (.05–.28) | 1 (–.21 to .01) | |
| Birthweight, g, mean (range)f | 3375 (477–5400) | 3369 (1270–5110) | 3342 (1357–4960) | 3370 (1285–5110) | 3374 (1270–4960) |
| Difference (95% CI) | –6 (–18 to 30) | –33 (–28 to 92) | –5 (–31 to 41) | –1 (–31 to 32) | |
Data are presented as no./No. (%) unless otherwise indicated. Denominators differ due to missing data.
Abbreviations: CI, confidence interval; IIV, inactivated influenza vaccine.
aIncluding essential hypertension, gestational hypertension, and preeclampsia.
bIncluding emphysema or severe asthma requiring frequent hospital visits.
cIncluding human immunodeficiency virus/AIDS.
dIncluding type 1, type 2, and gestational diabetes.
eRestricted to study years 2014–2015.
et test differences (in weeks) compared to the reference group.
ft test differences (in grams) compared to the reference group.
Time-dependent Analysis of Perinatal Outcomes
In our Cox proportional hazard regression analyses, there were no statistically significant differences in perinatal outcomes between the infants of mothers who received IIV in pregnancy compared with those who did not receive IIV in pregnancy, irrespective of the trimester of pregnancy a vaccine was given (Table 4). For our sensitivity analysis, when we restricted the years in which pertussis vaccination in pregnancy data were collected (2014–2015 inclusive), and then adjusted for the receipt of a pertussis vaccine in pregnancy, the results were indifferent and remained insignificant for all outcomes (Supplementary Table 1).
Cox Proportional Hazard Ratio Analysis for Time-dependent Variables in Influenza-vaccinated FluMum Study Participants, Australia (2012–2015)
| Variable | Total | Unvaccinated | Vaccinated IIV | HRa (95% CI) | P Value |
|---|---|---|---|---|---|
| Preterm birth (<37 wk) | 590/8776 (7) | 406/6086 (7) | 184/2690 (7) | 1.10 (.92–1.31) | .28 |
| First trimester | 1.14 (.80–1.61) | .47 | |||
| Second trimester | 0.97 (.77–1.23) | .81 | |||
| Third trimester | 0.98 (.76–1.27) | .87 | |||
| LBW at termc (<2500 g) | 181/8186 (2) | 126/5680 (2) | 55/2506 (2) | 1.05 (.76–1.44) | .77 |
| First trimester | 1.06 (.50–2.27) | .88 | |||
| Second trimester | 1.20 (.78–1.85) | .40 | |||
| Third trimester | 0.83 (.53–1.30) | .41 | |||
| SGAtotal (<10th percentile) | 864/8769 (10) | 609/6082 (10) | 255/2687 (9) | 0.99 (.86–1.15) | .94 |
| First trimester | 0.96 (.67–1.38) | .83 | |||
| Second trimester | 0.99 (.80–1.22) | .90 | |||
| Third trimester | 0.96 (.79–1.16) | .65 |
Data are presented as no./No. (%) unless otherwise indicated. Denominators differ due to missing data.
Abbreviations: CI, confidence interval; HR, hazard ratio; IIV, inactivated influenza vaccine; LBW, low birthweight; SGA, small for gestational age.
aCrude HR results comparing outcome variable in vaccinated group to reference (unvaccinated) group.
bAdjusted HR results compared to reference (unvaccinated) group, adjusting for pertussis vaccination in pregnancy.
cLow birthweight at term (<2500 g and ≥37 completed weeks’ gestation at birth).
Perinatal Outcomes by Trimester of Pregnancy
Three hundred thirty-two (12%) mothers received an IIV during the first trimester, 1044 (39%) in the second trimester, and 1314 (49%) in the third trimester (Table 3). There were no statistically significant differences in median gestation at birth of infants nor differences in mean birthweight of infants between unvaccinated and IIV-vaccinated pregnant women regardless of the trimester an IIV was received (Table 3).
Perinatal Outcomes Following Pertussis Vaccination
In a subgroup analysis of 1149 of 4670 (25%) pregnant women who self-reported a pertussis vaccination during pregnancy (2014–2015 inclusive), there were no differences in median gestations at birth of infants, nor mean birthweights of infants compared to unvaccinated pregnant women (Table 5). Cox proportional hazard ratios comparing our primary outcomes between vaccinated and unvaccinated pregnancies were also not statistically nor clinically significant, even when controlling for IIV in pregnancy (Table 5).
Crude and Adjusted Cox Proportional Hazard Ratio Sensitivity Analysis for Time-dependent Variables in Pertussis-vaccinated FluMum Study Participants, Australia (2014–2015)
| Variable | Total (N = 4670) | Unvaccinated (3521/4670 [75%]) | Vaccinated DTaP (1149/4670 [25%]) | HRa (95% CI) | P Value | aHRa,b (95% CI) | P Value |
|---|---|---|---|---|---|---|---|
| Gestational agec, wk, median (range) | 39 (25–43) | 39 (25–43) | 39 (28–42) | NA | NA | ||
| Difference (95% CI) | 0 (–.17 to .5), P = .29 | ||||||
| Birthweightd, g, mean (range) | 3375 (477–5400) | 3374 (477–5400) | 3379 (916–4804) | NA | NA | ||
| Difference (95% CI) | 5 (–39.74 to 29.36), P = .77 | ||||||
| Preterm birth (<37 wk) | 312/4670 (7) | 242/3521 (7) | 70/1149 (6) | 0.97 (.74–1.26) | .80 | 0.99 (.75–1.32) | .98 |
| LBW at term (<2500 g)e | 93/4358 (2) | 66/3279 (2) | 27/1079 (3) | 1.12 (.81–1.53) | .50 | 1.19 (.61–1.11) | .30 |
| SGAtotal (<10th percentile) | 440/4666 (9) | 331/3517 (9) | 109/1149 (9) | 1.03 (.83–1.28) | .80 | 1.09 (.86–1.37) | .48 |
Data are presented as no./No. (%) unless otherwise indicated. Denominators differ due to missing data. Data are restricted to the years 2014–2015 inclusive.
Abbreviations: aHR, adjusted hazard ratio; CI, confidence interval; DTaP, diphtheria, tetanus, and acellular pertussis vaccine; HR, hazard ratio; LBW, low birthweight; NA, xxx; SGA, small for gestational age.
aCrude HR results comparing outcome variable in vaccinated group to reference (unvaccinated) group.
bAdjusted HR results compared to reference (unvaccinated) group, adjusting for inactivated influenza vaccine in pregnancy.
ct test differences (in weeks) compared to the reference group.
dt test differences (in grams) compared to the reference group.
eLow birthweight at term (<2500 g and ≥37 completed weeks’ gestation at birth).
DISCUSSION
In this study of 8827 mother-infant pairs from multiple sites across Australia over 4 consecutive years, there were no clinically or statistically significant differences in key adverse birth outcomes between vaccinated and unvaccinated pregnant women. Importantly, we found no evidence suggestive of an adverse safety signal with respect to the trimester of pregnancy that IIV was given, thereby contributing to the data gap of first-trimester IIV vaccination and adverse birth outcomes. There were also no differences in mean birthweight or median gestation at birth between infants from vaccinated and unvaccinated pregnancies.
Our study has a number of strengths. We recruited participants once only during the lifetime of the study. This strategy was to prevent an introduction of bias from clustering. Participants were recruited during typical Australian influenza seasons (which is year-round in the tropical regions of Australia). This approach was chosen to enable all study participants access to the recommended and fully funded maternal IIV program and maximize the potential for exposure to influenza during the first 6 months of the infant’s life, thereby minimizing cohort truncation bias. Maternal demographic characteristics, risk factors, and birth outcomes in our sample were similar to that of the Australian population for the majority of variables [31], and there were only minor differences between the IIV-vaccinated and unvaccinated groups that could be attributed to our large sample size or potentially a “healthy vaccinee” effect in vaccinated study participants. Our study participants were less likely to smoke during pregnancy (7% vs 11%) and had a higher attendance for antenatal care in the first trimester (91% vs 62%) than might otherwise be expected for the general Australian population [31]. Within-cohort comparisons showed that IIV-unvaccinated pregnant women were more likely to be exposed to household smoke during pregnancy (21% vs 16%), less likely to have received a pertussis vaccine during pregnancy (12% vs 47%), and less likely to have achieved an education level of a diploma or higher (63% vs 70%) compared with pregnant women who received IIV. Women who received an IIV in the first trimester of pregnancy were more likely to identify as an Indigenous person (7% vs 3%). More women were vaccinated with IIV in the third trimester compared to any other trimester, suggesting pertussis vaccination as a potential driver of IIV uptake in pregnancy.
Our sample size gave us power to compare common adverse birth outcomes in vaccinated and unvaccinated pregnancies. Our use of the Cox proportional hazards ratio method to measure associations by vaccination status is superior to other methodologies that have not conducted time-varying analyses. As such, we have minimized the risk of introducing immortal time bias in our results [34], and the results of our sensitivity analysis (for IIV) showed minimal influence when adjusting for pertussis vaccination in pregnancy.
The requirement to have birthed a live infant in our study is a selection bias that precludes women who had either a stillbirth, miscarriage at any gestation, or late spontaneous abortion. Pertussis vaccination status in pregnancy was by self-report by the study participant and dates of pertussis vaccination were unconfirmed. The absence of a confirmed date of pertussis vaccination in pregnancy poses a risk of misclassification bias in relation to our outcome results, although in Australia, pertussis vaccination is recommended between 28 and 32 weeks’ gestation in the third trimester of each pregnancy [14]. Furthermore, a Western Australian study during this period reported that 99% of their “pertussis only” vaccinated cohort was vaccinated in the third trimester of pregnancy [35], and 98% of their “influenza and pertussis” vaccinated cohort was also vaccinated for pertussis in the third trimester. Our data showed there were no women who self-reported receiving a pertussis vaccine in pregnancy who birthed an infant <28 weeks’ gestation. Within our cohort, there were very few who experienced more serious adverse perinatal outcomes such as extreme prematurity and extreme low birthweight, and these were too few to conduct any meaningful analyses in this study.
Safety, uptake, and effectiveness are the key components of evaluating the overall worth of maternal vaccination programs, along with cost-effectiveness. We contribute safety data from our analyses, and propose to evaluate the uptake and effectiveness of IIV in pregnancies in future analyses.
CONCLUSIONS
The results from this prospective cohort study contribute evidence of the safety of maternal vaccination in pregnancy with both IIV and pertussis vaccines. We fill the gap of describing adverse birth outcomes by trimester of pregnancy a maternal IIV was given compared to adverse birth outcomes in unvaccinated pregnant women. Larger numbers of mother-infant pairs are required to detect rarer adverse birth outcomes in relation to maternal vaccination status, particularly for Indigenous women and infants, and miscarriage and stillbirth data. Data linkage using much larger sample sizes is required to specifically assess these risks.
Supplementary Data
Supplementary materials are available at Clinical Infectious Diseases online. Consisting of data provided by the authors to benefit the reader, the posted materials are not copyedited and are the sole responsibility of the authors, so questions or comments should be addressed to the corresponding author.
Notes
Author contributions. L. M. analyzed the data and wrote the first and final drafts of the manuscript. L. M. and R. M. A. contributed substantially to the preparation of the data for analysis. R. S. W. and M. J. B. assisted L. M. with statistical methodology and data analyses and interpretation. R. M. A., H. S. M., K. P. P., T. N., N. W., S. B. L., and P. R. contributed to the original study design and data collection. P. B. contributed to data collection, data cleaning, and manuscript editing. L. M., R. M. A., H. S. M., K. P. P., T. N., N. W., S. B. L., P. R., R. S. W., and M. J. B. contributed to manuscript editing. All authors approved the final manuscript.
Acknowledgments. We acknowledge other members of the FluMum chief investigator team (Kerry-Ann F. O’Grady and Mark Chatfield), as well as the study coordinators at each of the Australian FluMum sites who were responsible for the excellent quality of data collected. We especially thank all of the study participants. L. M. thanks Professor Sue Kildea for manuscript editing.
Financial support. The FluMum Study is funded by the National Health and Medical Research Council (NHMRC) (Project Grant APP1020035). L. M. was supported by an Australian Postgraduate Award scholarship provided by Charles Darwin University and an Enhanced Living scholarship provided by Menzies School of Health Research as part of the Doctor of Philosophy program. K. P. P. was supported by an NHMRC Early Career Fellowship (APP1054394) and a Murdoch Children’s Research Institute Career Development Award. N. W. and H. S. M. were supported by an NHMRC Career Development Fellowship (APP1063629 and APP1084951, respectively). S. B. L. is the recipient of an NHMRC Early Career Fellowship and a Children’s Hospital Foundation Queensland Mid-career Fellowship. M. J. B. is an NHMRC Early Career Fellow (APP1088733).
Potential conflicts of interest. S. L. reports grants from Sanofi and Seqirus. H. S. M.’s institution has received research grants from GSK, Pfizer, and Novavax. H. S. M. is an investigator on industry-sponsored clinical trials. The Murdoch Children’s Research Institute received study-specific research grants from GSK, Novartis, Pfizer, Novavax, and MedImmune during the conduct of this study. The Sydney Children’s Hospitals Network, where N. W. is an employee, has received funding from GSK for an investigator-initiated study on pertussis vaccine at birth. The Telethon Kids Institute received study-specific research grants from GSK, Novartis, and MedImmune during the conduct of this study and funding from GSK for an investigator-initiated study on pertussis vaccine in healthcare workers. P. R. has served on scientific advisory boards for Sanofi (influenza vaccine), GSK (maternal immunization), and AstraZeneca (influenza vaccine) but has not received personal remuneration. All other authors report no potential conflicts. All authors have submitted the ICMJE Form for Disclosure of Potential Conflicts of Interest. Conflicts that the editors consider relevant to the content of the manuscript have been disclosed.


Comments