


Abstract
Using commercial laboratory data, we found 80% of 29382 young persons currently infected with hepatitis C virus lived >10 miles from a syringe services program. The median distance was 37 miles, with greater distances in rural areas and Southern and Midwestern states. Strategies to improve access to preventive services are warranted.
Hepatitis C virus (HCV) is a blood-borne infection causing increasing mortality rates in the United States [1]. National surveillance data indicate that after a decade of declining acute HCV infection rates, the incidence began to increase in 2010, more than doubling from 2010 to 2014. The largest increase was among persons aged 20–29 years in nonurban areas, driven by sharing of injection equipment among persons who inject drugs (PWID) [1–3].
Although preventing and treating substance abuse addiction are vital for averting the growing epidemic of opioid abuse, harm reduction interventions are also needed as part of a comprehensive strategy to prevent transmission of HCV and other blood-borne infections among active PWID [4, 5]. Syringe services programs (SSPs) promote safe injection practices by providing education and exchanging used injection equipment for clean equipment. Moreover, they may serve as a crucial public health point of access for hard-to-reach, stigmatized communities of PWID [6] to offer HCV/human immunodeficiency virus testing, linkage to healthcare, referrals for opioid substitution therapy and substance abuse treatment programs, and access to overdose prevention tools [7]. Despite a lack of direct evidence of effectiveness against HCV transmission, demonstrated effectiveness of needle and syringe programs for human immunodeficiency virus prevention and reduction of risky injection behaviors [8] suggest that SSPs are a vital tool for HCV prevention [5]. There is considerable geographic variability in the number and capacity of SSPs in the United States [9]. We examined the geographic distribution of SSPs relative to the number of young persons with HCV infection tested at the 2 largest commercial laboratories in the United States.
METHODS
The analysis included persons aged 15–29 years who had an HCV RNA test conducted at Quest Diagnostics (Quest) or Laboratory Corporation of America (LabCorp) from 1 July 2015 through 30 June 2016, and who had detectable HCV RNA (deemed currently HCV infected). Assays used by the commercial laboratories to quantitatively and qualitatively assess presence of HCV RNA included COBAS Ampliprep/COBAS TaqMan (version 2.0), NGI QuantaSURE, Aptima, and Abbot m2000. HCV RNA tests that were known or suspected to originate from correctional facilities were excluded. Patients were mapped according to the residential (billing) zip code associated with their earliest positive HCV RNA result. For records missing a residential zip code, that of the ordering provider was used. Laboratory test results were obtained by the US Centers for Disease Control and Prevention in accordance with the Health Insurance Portability and Accountability Act (HIPAA). Tests were deduplicated within each laboratory for records that had sufficient demographic information to assign unique anonymized patient identification numbers. Because these numbers were assigned by each laboratory independently, it was not possible to identify persons who may have been tested at both laboratories. Programs providing syringe services as of June 2016 were identified through a directory maintained by the North American Syringe Exchange Network (www.nasen.org).
SSP addresses were geocoded based on zip code (when available), city, and state. The distance, in miles, between zip code centroids of patient residences and SSPs was calculated. Proximity to an SSP was arbitrarily defined as “near” for distances ≤10 miles (16 093 m), and “far” for distances >10 miles [10]. The zip codes were translated to county and state using the SAS software zip code file. Level of urbanicity was assigned based on the 2013 National Center for Health Statistics Urban-Rural Classification Scheme for Counties [11]. States were grouped by US Census Bureau region. We used χ2 tests to assess differences in proximity to SSPs across census regions and levels of urbanicity; differences were considered statistically significant at P < .05. SAS software (version 9.3) was used for all data processing, and ESRI ArcGIS (version 10.3) was used for geocoding, mapping, calculating distance, and performing preliminary location-allocation analysis.
RESULTS
A total of 29382 (18264 from Quest and 11118 from LabCorp) persons aged 15–29 years with current HCV infection were identified. They were tested from July 2015 through June 2016 and represented all 50 states and Washington, DC; 54% were female, and overall their median age was 25 years. The majority of persons (86.8%) could be mapped to residential zip code, though 13.1% were mapped to ordering provider zip code and 0.1% were excluded from spatial analysis owing to missing zip code. The geographic distribution of persons with HCV infection and proximity to SSPs is illustrated in Figure 1. The median distance to an SSP was 37 miles (interquartile range, 14–76 miles (22 531–122 310 meters); range, 0–667 miles (0–1 073 432 meters). Overall, 23494 HCV-infected young persons (80.0%) resided far (>10 miles) from an SSP (Table 1).
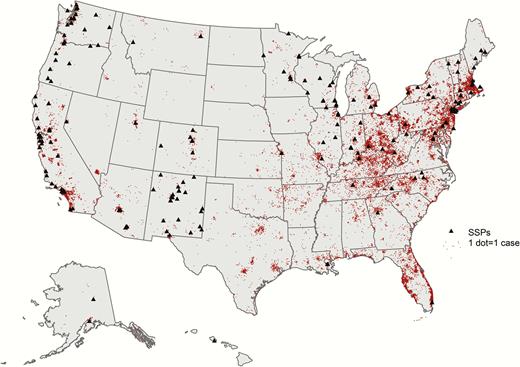
Map of syringe services programs and young persons aged 15–29 years with current hepatitis C virus (HCV) infection identified by the Laboratory Corporation of America and Quest Diagnostics laboratories, July 2015 to June 2016. Dots represent individual cases of HCV infection. Abbreviation: SSPs, syringe services programs.
Proximity to SSPs varied significantly across levels of urbanicity of the county in which the patient resided (P < .001). The proportion of young HCV-infected persons living far from an SSP increased with decreasing urbanicity: 47% of those in the most urban (large central metropolitan) areas compared with 98% of those in the most rural (noncore) areas resided far from SSPs. Proximity also varied significantly by census region; the proportion of patients residing near an SSP was highest in the West (35.8%) and lowest in the South (9.9%) (Table 1; P < .001), although highly variable by state. Location-allocation analyses estimated that to reach most (95%) of the persons currently residing far from an SSP, approximately 2200 additional programs would need to be established (not shown).
Distance to SSPs by Urbanicity, Region, and State Among Persons Aged 15–29 Years With Current HCV Infection
| Characteristics of patients’ Area of Residence | Total | Persons With HCV Infection, No. (%)a | |
|---|---|---|---|
| ≤10 mi from SSP | >10 mi from SSP | ||
| Total | 29382 | 5888 (20.0) | 23494 (80.0) |
| Urbanicityb | |||
| Large central metropolitan | 6115 | 3238 (53.0) | 2877 (47.0) |
| Large fringe metropolitan | 8106 | 1207 (14.9) | 6899 (85.1) |
| Medium metropolitan | 6877 | 877 (12.8) | 6000 (87.2) |
| Small metropolitan | 3122 | 404 (12.9) | 2718 (87.1) |
| Micropolitan | 3148 | 119 (3.8) | 3029 (96.2) |
| Noncore | 2014 | 43 (2.1) | 1971 (97.9) |
| Census region | |||
| West | 4064 | 1455 (35.8) | 2609 (64.2) |
| Alaska | 81 | 26 (32.1) | 55 (67.9) |
| Arizona | 326 | 118 (36.2) | 208 (63.8) |
| California | 2333 | 675 (28.9) | 1658 (71.1) |
| Colorado | 216 | 115 (53.2) | 101 (46.8) |
| Hawaii | 3 | 3 (100.0) | 0 (0.0) |
| Idaho | 58 | 0 (0.0) | 58 (100.0) |
| Montana | 90 | 24 (26.7) | 66 (73.3) |
| Nevada | 180 | 30 (16.7) | 150 (83.3) |
| New Mexico | 211 | 163 (77.3) | 48 (22.7) |
| Oregon | 159 | 96 (60.4) | 63 (39.6) |
| Utah | 108 | 30 (27.8) | 78 (72.2) |
| Washington | 290 | 175 (60.3) | 115 (39.7) |
| Wyoming | 9 | 0 (0.0) | 9 (100.0) |
| Northeast | 8392 | 2511 (29.9) | 5881 (70.1) |
| Connecticut | 486 | 199 (40.9) | 287 (59.1) |
| Maine | 84 | 27 (32.1) | 57 (67.9) |
| Massachusetts | 2032 | 540 (26.6) | 1492 (73.4) |
| New Hampshire | 261 | 0 (0.0) | 261 (100.0) |
| New Jersey | 1065 | 321 (30.1) | 744 (69.9) |
| New York | 1836 | 845 (46.0) | 991 (54.0) |
| Pennsylvania | 2529 | 545 (21.6) | 1984 (78.4) |
| Rhode Island | 37 | 17 (45.9) | 20 (54.1) |
| Vermont | 62 | 17 (27.4) | 45 (72.6) |
| Midwest | 4583 | 701 (15.3) | 3882 (84.7) |
| Illinois | 359 | 90 (25.1) | 269 (74.9) |
| Indiana | 488 | 124 (25.4) | 364 (74.6) |
| Iowa | 40 | 0 (0.0) | 40 (100.0) |
| Kansas | 138 | 9 (6.5) | 129 (93.5) |
| Michigan | 425 | 86 (20.2) | 339 (79.8) |
| Minnesota | 138 | 44 (31.9) | 94 (68.1) |
| Missouri | 498 | 30 (6.0) | 468 (94.0) |
| Nebraska | 35 | 0 (0.0) | 35 (100.0) |
| North Dakota | 11 | 8 (72.7) | 3 (27.3) |
| Ohio | 2294 | 235 (10.2) | 2059 (89.8) |
| South Dakota | 20 | 0 (0.0) | 20 (100.0) |
| Wisconsin | 137 | 75 (54.7) | 62 (45.3) |
| South | 12343 | 1221 (9.9) | 11122 (90.1) |
| Alabama | 279 | 0 (0.0) | 279 (100.0) |
| Arkansas | 297 | 0 (0.0) | 297 (100.0) |
| Delaware | 138 | 58 (42.0) | 80 (58.0) |
| District of Columbia | 40 | 40 (100.0) | 0 (0.0) |
| Florida | 3228 | 142 (4.4) | 3086 (95.6) |
| Georgia | 430 | 30 (7.0) | 400 (93.0) |
| Kentucky | 1803 | 398 (22.1) | 1405 (77.9) |
| Louisiana | 329 | 98 (29.8) | 231 (70.2) |
| Maryland | 657 | 159 (24.2) | 498 (75.8) |
| Mississippi | 120 | 0 (0.0) | 120 (100.0) |
| North Carolina | 1079 | 32 (3.0) | 1047 (97.0) |
| Oklahoma | 142 | 0 (0.0) | 142 (100.0) |
| South Carolina | 371 | 0 (0.0) | 371 (100.0) |
| Tennessee | 1044 | 57 (5.5) | 987 (94.5) |
| Texas | 799 | 3 (0.4) | 796 (99.6) |
| Virginia | 553 | 38 (6.9) | 515 (93.1) |
| West Virginia | 1034 | 166 (16.1) | 868 (83.9) |
Abbreviations: HCV, hepatitis C virus; SSPs, syringe services programs.
aPercentages represent proportion by row.
bUrbanicity levels defined according to the 2013 National Center for Health Statistics Urban-Rural Classification Scheme for Counties [11.
DISCUSSION
Our findings demonstrate that >23000 young persons identified with current HCV infection in the United States over a 1-year period had limited access to SSP services. Given that injection drug use is the primary cause of HCV infection among young persons, better access to SSPs could have been a useful tool to prevent many of these HCV infections and reduce the risk of transmission to others.
We found proximity to SSPs generally decreased with decreasing urbanicity in a dose-related manner. These results align with previous findings that SSPs operating in geographically remote settings are limited in their numbers, budget, and capacity [9]. The higher proportion of persons without access to SSPs in rural areas with some of the highest rates of illicit opioid and heroin injection and reported cases of HCV [3] highlight the inherent challenges in reaching PWID in remote settings, and the recent increase in HCV infection incidence in rural areas underscores the need for expanded delivery of harm reduction services. However, it should be noted that in some states access is limited in both urban and rural areas.
This study showed that in any region of the country less than half of young persons infected with HCV are located near SSPs. However, the larger gaps in access in the South and Midwest, suggest that our ability to interrupt HCV transmission and avert potential epidemics among PWIDs may be most limited in these regions. Geographic differences in SSP access, such as large areas where no SSPs currently exist, suggest insufficient capacity to address potential epidemics of HCV infection among PWID in some areas where risk of an epidemic is greatest [12].
Reasons for the geographic disparities may be myriad and point to the need not just to consider how to improve access to SSPs in rural areas but also to understand the legal, financial, and social barriers to establishment, funding, and use of SSPs. Indeed, despite the recent lifting of the ban on federal funding for syringe exchange, the impact of state laws and jurisdictional syringe exchange authorization on establishment and utilization of SSPs warrants closer examination [13]. The estimation that >2200 additional programs would be needed to reach most cases residing “far” from an SSP in this analysis points to the need for strategies to improve access to HCV preventive services, such as the establishment of additional SSPs, the mobilization of programs to reach dispersed populations, and the use of existing infrastructure, such as local health departments and/or pharmacies.
This report should be interpreted in light of several limitations. First, this analysis was limited to persons with current HCV infection who were tested at 2 commercial laboratories, thus excluding persons identified at other laboratories; given regional disparities in coverage by the laboratories, we may have underestimated the case burden in rural areas and some regions such as the northern Midwest and Pacific Northwest. Persons for whom patient identification numbers were not assigned were also excluded from this analysis, which may have resulted in an underestimate of cases. Second, we were unable to link persons across laboratories, which could have resulted in some persons being counted more than once. However, we deem it unlikely that multiple RNA tests would be conducted on the same person at different laboratories in a given year.
Third, the definition of 10 miles as a close proximity to SSP may not reflect actual ease of use; other factors associated with limited access to services, such as legal acceptability, public transportation access, and functional capacity of SSPs, including use of satellite locations or mobile units, were not assessed in this analysis. The fact that some SSPs may offer HCV RNA testing may have resulted in more cases being identified near SSPs. Finally, the cross-sectional nature of this study precluded an examination of the temporal relationship between number of persons with current HCV infection and establishment of SSPs. Future analyses are planned to evaluate whether improved access to SSPs and other interventions can reduce the number of HCV infections reported to state health departments and identified through laboratory testing.
In summary, the analysis shows that large numbers of young persons with HCV infection have limited access to SSPs during a time of increasing incidence of HCV infection driven by unsafe injection drug use [1]. Addressing the large gaps in access to harm reduction services is paramount for preventing continued HCV transmission among PWID.
Notes
Acknowledgements. We would like to acknowledge the North American Syringe Exchange Network for providing a publicly accessible directory of syringe services programs (available at www.nasen.org).
Disclaimer. The findings and conclusions in this report are those of the authors and do not necessarily represent the official position of the US Centers for Disease Control and Prevention, the Laboratory Corporation of America, or Quest Diagnostics.
Funding. This work was supported by the US Centers for Disease Control and Prevention.
Potential conflicts of interest. L. C. serves in an unpaid role on the board of directors for the Atlanta Harm Reduction Coalition. J. W. and H. K are employed by and have stock options with the Laboratory Corporation of America and Quest Diagnostics, respectively. All other authors report no potential conflicts. All authors have submitted the ICMJE Form for Disclosure of Potential Conflicts of Interest.
References
CDC
Author notes
Correspondence: L. Canary, Centers for Disease Control and Prevention, Division of Viral Hepatitis, Mail Stop G-37, Atlanta, GA 30329 (YJG7@cdc.gov).


Comments