


Abstract
Children living with human immunodeficiency virus (HIV) are at neuropsychological risk for cognitive and motor dysfunction. However, few prospective, multi-site studies have evaluated neuropsychological outcomes longitudinally among perinatally infected African children who received early antiretroviral treatment (ART).
We enrolled 611 children aged 5 to 11 years at 6 sites (South Africa [3], Zimbabwe, Malawi, Uganda). Of these, there were 246 children living with HIV (HIV+) who were initiated on ART before 3 years of age in a prior clinical trial comparing nevirapine to lopinavir/ritonavir (International Maternal Pediatric Adolescent Acquired Immunodeficiency Syndrome Clinical Trials [IMPAACT] P1060); 183 age-matched, exposed but uninfected (HEU) children; and 182 unexposed and uninfected (HUU) children. They were compared across 3 assessment time points (Weeks 0, 48, and 96) on cognitive ability (Kaufman Assessment Battery for Children, second edition [KABC-II]), attention/impulsivity (Tests of Variables of Attention [TOVA]), motor proficiency (Bruininks-Oseretsky Test, second edition [BOT-2]), and on the Behavior Rating Inventory of Executive Function (BRIEF). The cohorts were compared using linear mixed models, adjusting for site, child’s age and sex, and selected personal/family control variables.
The HIV+ cohort performed significantly worse than the HEU and HUU cohorts for all KABC-II, TOVA, and BOT-2 performance outcomes across all 3 time points (P values < .001). The HUU and HEU cohorts were comparable. For the KABC-II planning/reasoning subtests, the HIV+ children showed less improvement over time than the HUU and HEU groups. The groups did not differ significantly on the BRIEF.
Despite initiation of ART in early childhood and good viral suppression at the time of enrollment, the HIV+ group had poorer neuropsychological performance over time, with the gap progressively worsening in planning/reasoning. This can be debilitating for self-management in adolescence.
Despite early antiretroviral treatment (ART) initiation (<3 years of age) in the International Maternal Pediatric Adolescent Acquired Immunodeficiency Syndrome Clinical Trials (IMPAACT) P1060 trial, neurocognitive deficits were documented for children living with human immunodeficiency virus (HIV+) at school age (at entry into IMPAACT P1104s), when compared to their perinatally HIV exposed but uninfected (HEU) and perinatally HIV unexposed and uninfected (HUU) age-matched cohorts [1]. Cognitive performance deficits were evident on all the global performance indicators for all the cognitive ability tests [1]. These children were initiated on ART irrespective of clinical and immunologically defined criteria for initiation of ART at that time.
Similar neurocognitive assessment findings were reported through early and middle childhood in Thai children who were part of the PREDICT study [2]. These findings concurred with recent neurodevelopmental study literature reviews [3] and with the cognitive evaluation of South African children living with HIV who were assessed in comparison with their HEU and HUU counterparts as a follow-up to the CHER clinical trial [4]. However, there is some evidence that these neurodevelopmental deficits may be mitigated with very early and uninterrupted ART for infants living with HIV [5].
The purpose of this study was to extend the cross-sectional, baseline results reported previously with the present cohorts [1]. We compared neuropsychological outcomes at several time points over the course of a 2-year period among perinatally HIV+, HEU, and HUU children in sub-Saharan Africa who were enrolled in IMPAACT P1104s. By doing so, we address a key gap in the research literature, evaluating whether the neuropsychological trajectory for African children living with HIV is diminished at school age (5 to 12 years) despite ART initiation at an early age (<3 years).
METHODS
Study Design and Participants
IMPAACT P1104s was a longitudinal, multi-site, observational study of children 5 to <11 years of age with study visits at entry and Weeks 48 and 96. Enrollment at 6 research sites in South Africa [3], Zimbabwe, Malawi, and Uganda took place from October 2013 to mid-December 2014 [1, 6]. Assessments continued to mid-December 2016.
Children were recruited into 3 cohorts [1]: HIV+ (children participating in IMPAACT P1060 Protocol Version 5.0 [2]), HEU, and [3] HUU children. IMPAACT P1060 was a randomized, controlled trial comparing nevirapine- versus lopinavir/ritonavir–based ART, with zidovudine and lamivudine administered upon an HIV diagnosis in infancy or very early childhood [7–9]. All HUU and HEU participants’ HIV status was confirmed according to HIV testing guidelines, as previously reported [1].
Institutional review board approval for P1104s was obtained at each study site and the corresponding university partner(s). Parents gave written/signed local language consent and study children older than 7 years provided either verbal or written assent in their local language.
Assessments
The outcomes were separate global performance scores, providing a composite for each test below. The tests outcomes were previously described in a validation study of the present neuropsychological measures [6]. The quality assurance process for administering the tests has also been previously described [10], as has adaptation of all tests in the local languages [1].
Kaufman Assessment Battery for Children
The Kaufman Assessment Battery for Children, second edition (KABC-II), provides a comprehensive assessment for cognitive ability that has been validated in pediatric HIV studies across Africa [4, 6]. As previously described in the baseline paper [1], primary outcome variables were the global cognitive performance standardized scores for the KABC-II.
Bruininks-Oseretsky Test of Motor Proficiency
The Bruininks-Oseretsky Test, second edition (BOT-2), provided our principal motor proficiency assessment [6, 11]. The short form of this test includes items addressing fine motor precision, fine motor integration, manual dexterity, upper-limb coordination, bilateral coordination, balance, running speed and agility, and strength. These are combined into a total composite score of motor proficiency, standardized by age and sex using American norms, which was the only outcome for this test used in the present analyses.
Test of Variables of Attention
The Tests of Variables of Attention (TOVA) is a computerized, visual, continuous performance test used in the diagnosis and monitoring of children and adults with attention deficit disorders (www.tovatest.com) [6, 12]. This computer-administered test measures inattention (response time variability), impulsivity (response time, percent commission errors), inattention (percent omission errors), an index reflecting attention deficit–hyperactivity disorder (ADHD), and an overall test performance (D-prime signal detection) score. High scores on the ADHD and D-prime standard measures reflect better functioning, while high scores on the other measures reflect worse performance.
Behavior Rating Inventory for Executive Function
The school-age version of the Behavior Rating Inventory of Executive Function (BRIEF; 6 to 18 years) has 86 items for completion by the parent or guardian/caregiver and evaluates behavioral and executive functions [13]. The 8 scales form 2 broad indexes—the behavior regulation and metacognition indexes—that are combined into a global executive composite (GEC) score. The higher the score, the more day-to-day behavior problems related to executive function, as reported by the parent or caregiver.
Hopkins Symptoms Checklist
The 25-item Hopkins Symptoms Checklist (HSCL-25) was administered to the child’s primary caregiver to assess caregiver depression (15 items) and anxiety (10 items) symptoms [14, 15]. Higher scores mean more depression or anxiety. The HSCL-25’s relationship to caregiver evaluations of the child’s behavior on the BRIEF has been previously documented [16].
Multiple Indicators Cluster Survey Questionnaires for Child Development and for Child Disability
At enrollment, we used portions of the United Nations International Children’s Emergency Fund Multiple Indicators Cluster Survey, fourth round (MICS4), administered to the principal caregiver of the child (http://mics.unicef.org/). We used the early childhood development portion of the questionnaire for children under 5 (17 items) as a measure of quality of the child development environment and the MICS4 child disability questionnaire, derived from the 10-question questionnaire in screening HUU children for eligibility [17, 18].
Socio-economic Status
Information was collected on the parent/caregiver’s employment status and level of education, the physical quality of the home environment (eg, electricity, fuel and water source), material possessions (eg, working refrigerator), and the source and sufficiency of income [1]. Each item was scored from 0–10 and a mean score of nonmissing values was computed, with 10 reflecting the highest socio-economic status.
Medical History and Physical Development
The child’s medical history and anthropometric measurements (weight, height, and mid-upper arm circumference) were collected at each study visit [1]. Anthropometric measures were standardized using World Health Organization norms. The medical history questionnaire included questions on health status (targeted diagnoses, signs/symptoms) and was collected at the clinic before the neuropsychological assessment to help ensure that the child was well enough to test.
Statistical Analysis
Test results were reviewed and confirmed by the authors (M. J. B., M. F. C., B. L., and B. Z.). Sociodemographic characteristics at study entry, as well as HIV disease characteristics for the HIV+ cohort, were summarized and compared across cohorts using Chi-square and Kruskal–Wallis tests. Linear mixed models with restricted maximum likelihood estimation and robust fixed effect error estimates were used to explore whether test scores differed among cohorts and across time. Earlier work with baseline data suggested that scores differed across research sites and for some outcomes by age and sex [1, 6]. These covariates were preselected based on prior analyses identifying factors that could affect neuropsychological outcomes [1].
Adjusted group means by week (Weeks 0, 48, and 96) and cohort (HIV+, HEU, and HUU) were computed and plots of adjusted values were graphed. Pairwise contrasts between cohort means at each study week and the group pairwise contrasts, representing the changes from Week 0 to Week 48 (Week 0 minus Week 48) and from Week 48 to Week 96 (Week 48 minus Week 96) within cohorts, were computed. Contrasts between cohorts at each time point were computed as HEU minus HUU; HEU minus HIV+; and HUU minus HIV+. Cohort-by-time interaction effects can be interpreted by looking at how consistently cohorts change across time or, alternatively, whether pairwise contrasts between cohorts differ over time. SAS version 9.4 statistical software was used for this analysis.
RESULTS
Of the 615 enrolled children, 611 (246 HIV+, 183 HEU, and 182 HUU) were testable and had baseline study data. There were 603 children who completed the Week 48 visit and 588 who completed the Week 96 visit. A subsequent comparison of the children lost to follow-up at Weeks 48 and 96, as compared to those retained, when considering their baseline (Week 0) performance, did not reveal any significant differences for any of the measures in Table 1.
Child, Caregiver, and Family Characteristics at Entry by Cohort
| Characteristic | Cohort | Total, n = 611 | P Value | |||
|---|---|---|---|---|---|---|
| HIV+, n = 246 | HEU, n = 183 | HUU, n = 182 | ||||
| Sex | Male | 111 (45%) | 95 (52%) | 84 (46%) | 290 (47%) | .347a |
| Race | Black African | 242 (98%) | 176 (96%) | 150 (82%) | 568 (93%) | <.001a |
| Mixed/White/Other | 4 (2%) | 7 (4%) | 32 (18%) | 43 (7%) | ||
| Age, years | Mean (SD) | 7.1 (1.2) | 7.3 (1.6) | 7.3 (1.5) | 7.2 (1.4) | .963b |
| <6 years | 41 (17%) | 36 (20%) | 35 (19%) | 112 (18%) | .872a | |
| 6 to <7 years | 83 (34%) | 64 (35%) | 64 (35%) | 211 (35%) | ||
| ≥7 years | 122 (50%) | 83 (45%) | 83 (46%) | 288 (47%) | ||
| In school at time of KABC-II test | No | 69 (29%) | 60 (34%) | 53 (30%) | 182 (31%) | .654a |
| Yes | 166 (71%) | 119 (66%) | 121 (70%) | 406 (69%) | ||
| Unknown/NA | 11 | 4 | 8 | 23 | ||
| WHOc height z-score | Mean (SD) | −1.04 (.97) | −.38 (1.03) | −.43 (1.06) | −.66 (1.06) | <.001 b |
| MICS4 disability score | Mean (SD) | 8.78 (11.51) | 3.50 (6.61) | 3.57 (6.56) | 5.65 (9.25) | <.001b |
| 0, no disability | 124 (50%) | 135 (74%) | 133 (73%) | 392 (64%) | <.001a | |
| 1, some disability, ≤10 | 68 (28%) | 35 (19%) | 35 (19%) | 138 (23%) | ||
| 2, disability, >10 | 54 (22%) | 13 (7%) | 14 (8%) | 81 (13%) | ||
| MICS4 development score | Mean (SD) | 73.04 (18.02) | 76.87 (16.39) | 74.87 (16.48) | 74.73 (17.14) | .145b |
| 1, lowest quintile | 62 (25%) | 29 (16%) | 37 (20%) | 128 (21%) | .396a | |
| 2, second quintile | 34 (14%) | 31 (17%) | 28 (15%) | 93 (15%) | ||
| 3, third quintile | 51 (21%) | 43 (23%) | 46 (25%) | 140 (23%) | ||
| 4, fourth quintile | 66 (27%) | 46 (25%) | 46 (25%) | 158 (26%) | ||
| 5, highest quintile | 33 (13%) | 34 (19%) | 25 (14%) | 92 (15%) | ||
| Caregiver is biological mother | No | 37 (15%) | 2 (1%) | 0 (0%) | 39 (6%) | <.001a |
| Yes | 209 (85%) | 181 (99%) | 182 (100%) | 572 (94%) | ||
| Caregiver for less than 5 years | No | 223 (91%) | 169 (92%) | 171 (94%) | 563 (92%) | .451a |
| Yes | 23 (9%) | 14 (8%) | 11 (6%) | 48 (8%) | ||
| HIV status of primary caregiver | Uninfected | 10 (4%) | 1 (1%) | 182 (100%) | 193 (32%) | <.001a |
| Living with HIV | 230 (96%) | 182 (99%) | 0 (0%) | 412 (68%) | ||
| Not reported | 6 | 0 | 0 | 6 | ||
| Caregiver mean HSCL-25 Anxiety score | Mean (SD) | 1.59 (.55) | 1.66 (.64) | 1.65 (.58) | 1.63 (.59) | .685b |
| Caregiver mean HSCL-25 Depression score | Mean (SD) | 1.81 (.64) | 1.75 (.64) | 1.75 (.63) | 1.78 (.63) | .479b |
| Current residential zone | Rural | 51 (21%) | 29 (16%) | 29 (16%) | 109 (18%) | .634a |
| Peri-urban | 103 (42%) | 81 (44%) | 84 (46%) | 268 (44%) | ||
| Urban | 92 (37%) | 73 (40%) | 69 (38%) | 234 (38%) | ||
| Major income source | Mother | 84 (34%) | 54 (30%) | 45 (25%) | 183 (30%) | <.001a |
| Father | 73 (30%) | 71 (39%) | 91 (50%) | 235 (39%) | ||
| Social grant | 56 (23%) | 47 (26%) | 27 (15%) | 130 (21%) | ||
| Other person/source | 33 (13%) | 10 (5%) | 19 (10%) | 62 (10%) | ||
| Missing | 0 | 1 | 0 | 1 | ||
| Socio-economic index | Median (Q1, Q3) | 6.0 (4.4, 7.6) | 5.7 (4.8, 7.4) | 6.2 (4.7, 7.9) | 6.0 (4.6, 7.6) | .326b |
Statistical probability (P values) for statistical significance differences at study entry are also presented.
Abbreviations: HEU, cohort of people exposed to HIV but uninfected; HIV, human immunodeficiency virus; HIV+, cohort of people living with HIV; HSCL-25, 25-item Hopkins Symptoms Checklist; HUU, cohort of people unexposed to HIV and uninfected; MICS4, United Nations International Children’s Emergency Fund Multiple Indicator Cluster Survey, fourth edition; NA, not available; Q, quartiles; SD, standard deviation; WHO, World Health Organization.
aChi-square test.
bKruskal–Wallis test.
cWHO growth norms 2012.
As reported in the baseline paper [1], Table 1 presents personal and family characteristics at study entry by study cohort and overall. Table 2 shows HIV disease characteristics for the HIV+ cohort at study entry. Compared to the other 2 cohorts, HIV+ participants tended to have a lower height (stunting), higher disability (developmental delay) screening scores (caregiver report), and a higher proportion of their caregivers were not their biological mothers (Table 1). For the HIV+ participants, the median age at diagnosis was 1.2 years, and they had a median of almost 6 years on ART prior to P1104s entry (Table 2). At ART initiation between 3 months to 3 years of age, 60% met the World Health Organization’s criteria for Stage III or IV of the disease [8, 19]. Yet, at the time of enrollment in the present study, 239 of the 246 HIV+ children had >25% CD4 counts and 171 of 246 were aviremic, as defined by HIV plasma RNA values consistently below the lower limit of detection of the test over the 9 consecutive months prior to P1104s entry.
Disease Characteristics of Cohort of Children Living With Human Immunodeficiency Virus
| Characteristic | HIV+ Cohort, n = 246 | |
|---|---|---|
| Age at ARV initiation, years | Median (Q1, Q3) | 1.2 (.7, 2.1) |
| <1 year | 108 (44%) | |
| 1 to <1.5 years | 31 (13%) | |
| 1.5 to <2 years | 38 (15%) | |
| 2.0 to <2.5 years | 35 (14%) | |
| 2.5+ years | 34 (14%) | |
| Years on ARVs prior to entrya | Median (Q1, Q3) | 5.8 (5.1, 6.7) |
| ARV regimen classification (cARV) | cARV with PI | 164 (67%) |
| cARV without PI | 78 (32%) | |
| Non-cARV | 4 (2%) | |
| WHO disease stage | Clinical stage I | 38 (15%) |
| Clinical stage II | 58 (24%) | |
| Clinical stage III | 137 (56%) | |
| Clinical stage IV | 13 (5%) | |
| CD4 percent | Median (Q1, Q3) | 38.55 (34.00, 43.00) |
| 0 to <25% | 7 (3%) | |
| 25%+ | 239 (97%) | |
| HIV+ RNA cp/ml | Median (Q1, Q3) | 400 (400, 400) |
| ≤400 cp/ml | 235 (96%) | |
| >400 cp/ml | 11 (4%) | |
| P1060 treatment arm | NVP | 126 (51%) |
| LPV/r | 120 (49%) | |
| P1060 NVP exposure cohort | NVP exposed | 86 (35%) |
| NVP unexposed | 160 (65%) | |
| HIV+ subtypea | A1 | 24 (10%) |
| C | 192 (78%) | |
| D | 11 (4%) | |
| Other | 19 (8%) |
Abbreviations: ARV, anti-retroviral; cARV, combination anti-retroviral; HIV, human immunodeficiency virus; HIV+, cohort of people living with HIV; LPV/r, lopinavir/ritonavir; NVP, nevirapine; PI, Principal Investigator; Q, quartile; WHO, World Health Organization.
aOther includes subtype not determinable.
Table 3 highlights the between-cohort differences at baseline and the within-cohort changes over time. In this table, a negative change indicates a within-cohort improvement for those tests where a higher score is associated with better performance (eg, KABC-II, BOT-2, and TOVA ADHD and D-Prime standard), while a positive change indicates better performance for tests where a lower score indicates better performance (eg, BRIEF GEC). For example, the KABC-II mental processing index (MPI) and nonverbal index (NVI) scores were significantly lower in the HIV+ group throughout, beginning at study entry and showing smaller improvements over time than for the other 2 study groups. For the MPI and NVI, most of the improvement appeared in the Week 48 to Week 96 comparison (right-hand portion of the table, where changes were more highly negative).
Global Scores: Adjusted Means and 95% Confidence Intervals by Group and Week
| Global Test Scores | Cohort | Week 0 | Change, Week 0–Week 48 | Change, Week 48–Week 96 | F-Test P Values | ||||
|---|---|---|---|---|---|---|---|---|---|
| LS Mean (95% CI) | Pairwise | LS Mean (95% CI) | P Value | LS Mean (95% CI) | P Value | Cohort | Cohort by Week | ||
| KABC-II nonverbal index | HIV+ | 72.64 (70.92–74.36) | … | −.42 (−1.58 to .74) | .48 | −.91 (−1.95 to .14) | .09 | <.001* | .45 |
| HEU | 77.14 (74.96–79.32) | + | −.53 (−1.84 to .78) | .43 | −1.86 (−2.97 to −.75) | .001* | |||
| HUU | 77.87 (75.78–79.96) | + | −1.16 (−2.39 to .07) | .07 | −1.76 (−3.02 to .50) | .01* | |||
| KABC-II mental processing index | HIV+ | 73.70 (72.11–75.30) | … | .40 (−.64 to 1.45) | .45 | −1.48 (−2.30 to −.66) | <.001* | <.001* | .75 |
| HEU | 77.31 (75.19–79.44) | + | −.27 (−1.57 to 1.04) | .69 | −1.79 (−2.79 to −.80) | <.001* | |||
| HUU | 79.01 (76.92–81.11) | + | .24 (−1.23 to 1.72) | .74 | −2.14 (−3.19 to −1.10) | <.001* | |||
| BOT-2: total score | HIV+ | 47.47 (46.27–48.67) | … | −.82 (−1.61 to −.02) | .04* | .82 (.10–1.54) | .03* | <.001* | .05 |
| HEU | 50.69 (49.30–52.08) | + | .33 (−.66 to 1.31) | .52 | 1.59 (.66–2.52) | <.001* | |||
| HUU | 50.96 (49.52–52.40) | + | −.40 (−1.33 to .54) | .40 | 1.28 (.43–2.14) | .003* | |||
| BRIEF: global executive composite | HIV+ | 53.72 (51.59–55.85) | … | 5.28 (3.81–6.76) | <.001* | −1.04 (−2.36 to .28) | .12 | .13 | <.001* |
| HEU | 54.22 (51.79–56.66) | … | 2.24 (.57–3.90) | .01* | 1.86 (.32 to 3.40) | .02* | |||
| HUU | 52.86 (50.48–55.24) | … | .55 (−.82 to 1.91) | .43 | .85 (−.58 to 2.28) | .24 | |||
| TOVA ADHD | HIV+ | −.95 (−1.47 to −.43) | … | −.85 (−1.23 to −.46) | <.001* | −.11 (−.48 to .25) | .54 | .03* | .04* |
| HEU | −.09 (−.70 to .52) | + | −.03 (−.46 to .39) | .88 | −.28 (−.60 to .05) | .09 | |||
| HUU | −.28 (−.86 to .31) | + | −.70 (−1.10 to −.30) | <.001* | −.24 (−.59 to .11) | .18 | |||
| TOVA D-prime standard score | HIV+ | 81.76 (79.63–83.88) | … | −3.44 (−5.19 to −1.69) | <.001* | −1.91 (−3.33 to −.49) | .01* | .004* | .02* |
| HEU | 86.17 (83.68–88.67) | + | −.81 (−2.75 to 1.12) | .41 | .02 (−1.70 to 1.74) | .98 | |||
| HUU | 86.39 (84.01–88.78) | + | −2.88 (−5.05 to −.70) | .01* | .30 (−1.70 to 2.30) | .77 |
Data include changes from Week 0 to Week 48 and from Week 48 to Week 96. Results were adjusted for site; sex and age at entry; WHO height for age z-score; school status; caregiver relation; residential zone; length of time with caregiver; socioeconomic index; and MICS disability and development. Change represents the within-cohort change between noted weeks (eg, Week 0–Week 48, Week 48–Week 96). Pairwise + indicates a specified cohort (HEU or HUU) performance was significantly better than that of the HIV+ cohort at Week 0. *P < .05.
Abbreviations: ADHD, attention deficit–hyperactivity disorder; BOT-2, Bruininks-Oseretsky Test for motor proficiency, second edition; BRIEF, Behavior Rating Inventory for Executive Function; CI, confidence interval; D-prime, overall test performance; HEU, cohort of people exposed to HIV but uninfected; HIV, human immunodeficiency virus; HIV+, cohort of people living with HIV; HUU, cohort of people unexposed to HIV and uninfected; KABC-II, Kaufman Assessment Battery for Children, second edition; MICS, Multiple Indicators Cluster Survey; LS mean, least squares adjusted mean; TOVA, Tests of Variables of Attention; WHO, World Health Organization.
This result can also be seen in Figure 1, where confidence interval (CI) bars lying to the right of the null = 0 line indicate the HUU and HEU groups had higher (better) scores than the HIV+ group at each time point (Figure 1B and D). The BOT-2 scores were lower for the HIV+ group at baseline, indicative of worse motor performance; despite worsening performance for all 3 groups over time (positive within-cohort changes), the HIV+ cohort’s scores remained lower throughout the study period (Figure 1). The BRIEF GEC scores were similar at entry for the 3 study groups, although their trajectories differed across time, indicative of improving outcomes for the HIV+ and HEU groups, compared to the HUU group (larger positive change scores [Table 1]; CI bars to right of null = 0 [Figure 1]). However, more recent findings have indicated that these effects are modified by maternal depression [16].
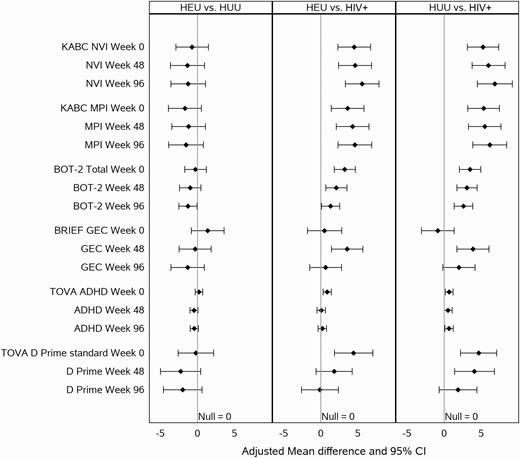
A forest plot for all 3 assessment times (Weeks 0, 48, and 96), depicting the adjusted mean difference and 95% CIs for the principal global performance measures across all 6 study sites, comparing HEU to HUU, HEU to HIV+, and HUU to HIV+ children. The measures depicted are the standardized scores from the NVI and MPI from the KABC-II; the BOT-2 standardized total score; the BRIEF standardized GEC, completed by the primary caregiver; and the TOVA ADHD index and standardized D prime (signal detection measure of overall TOVA performance) outcomes. Abbreviations: ADHD, attention deficit–hyperactivity disorder; BOT-2, Bruininks-Oseretsky Test for motor proficiency, second edition; BRIEF, Behavior Rating Inventory for Executive Function; CI, confidence interval; D-prime, signal detection measure of overall test performance on the TOVA; GEC, global executive composite; HEU, cohort of people exposed to HIV but uninfected; HIV, human immunodeficiency virus; HIV+, cohort of people living with HIV; HUU, cohort of people unexposed to HIV and uninfected; KABC-II, Kaufman Assessment Battery for Children, second edition; MPI, mental processing index on the KABC-II; NVI, nonverbal index on the KABC-II; TOVA, Tests of Variables of Attention.
For our principal neuropsychological outcomes in Table 3 and Figure 1, most pairwise group differences (HIV+ vs HEU/HUU) at each of the 3 time points (Weeks 0, 48, and 96) remained statistically significant (P values < .05). These results are best seen in Figure 1, where most of the 95% CI bars showing pairwise group differences lie to the right of the null = 0 line (Figure 1).
On average, the TOVA performance was poorer for the HIV+ cohort, compared to HEU and HUU cohorts, in both the ADHD score (F test for cohort, P = .03) and D-prime signal detection standard score (P = .004; Table 3). At baseline and Week 48, the HIV+ cohort consistently scored worse than the HEU and HUU cohorts on the TOVA D-prime signal detection, ADHD index, and TOVA inattention and impulsivity measures (Figures 1 and 2). However, by Week 96 the HIV+ cohort performed almost as well as the HEU cohort, possibly due to a ceiling effect on the TOVA for the HEU and the HUU children (for the D-prime and ADHD measures). These differences in improvement across weeks among cohorts have significant cohort-by-week interaction effects in Table 3 (far right column) for the TOVA ADHD (P = .04) and D-prime (P = .02).
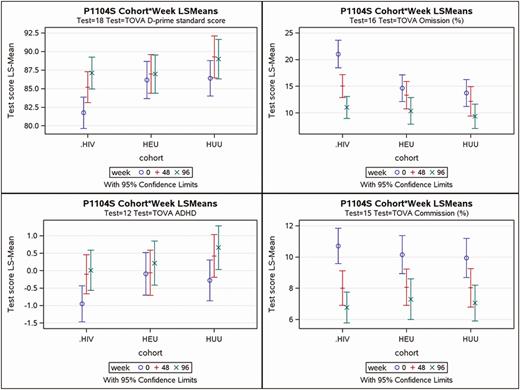
For the principal performance measures of the TOVA, this figure depicts the mean plots for the adjusted means and the 95% confidence intervals (top and bottom of bar) for each of the 3 cohorts (HIV+, HEU, and HUU) at each of the 3 assessment times (Weeks 0, 48, and 96). The 4 principal TOVA performance outcomes are (A) signal detection D-prime (correct responses to signal and nonresponses to nonsignal), (B) percent omission errors to signal (inattention), (C) overall ADHD index, and (D) percent commission errors responding to nonsignal (impulsivity). Abbreviations: ADHD, attention deficit–hyperactivity disorder; D-prime, overall signal detection test performance; HEU, cohort of people exposed to HIV but uninfected; HIV, human immunodeficiency virus; HIV+, cohort of people living with HIV; HUU, cohort of people unexposed to HIV and uninfected; LS means, least squares adjusted means; TOVA, Tests of Variables of Attention.
For all the KABC-II cognitive ability domains depicted in Table 4 (simultaneous processing, sequential processing, learning, planning, and delayed recall), the HIV+ group performed more poorly at study entry and, despite some gains for each of the groups, remained with lower scores throughout the course of the study. Only the planning (executive functioning) domain had a significant cohort-by-week interaction effect (P = .001; Table 4). This significant interaction effect was because the HIV+ cohort improved much less than the HEU and HUU cohorts across weeks (see Figure 3).
Kaufman Assessment Battery for Children, Second Edition, Domains: Adjusted Means and 95% Confidence Intervals by Group and Week
| Outcome | Cohort | Week 0 | Change, Week 0–Week 48 | Change, Week 48–Week 96 | F-test P Values | ||||
|---|---|---|---|---|---|---|---|---|---|
| LS Mean (95% CI) | Pairwise | LS Mean (95% CI) | P Value | LS Mean (95% CI) | P Value | Cohort | Cohort by Week | ||
| Sequential | HIV+ | 78.93 (77.23–80.63) | … | −.31 (−1.51 to .89) | .61 | .48 (−.58 to 1.54) | .37 | <.001 | .07 |
| HEU | 83.14 (80.93–85.35) | + | 1.71 (.32–3.10) | .02* | −.81 (−2.20 to .59) | .26 | |||
| HUU | 84.25 (82.20–86.31) | + | 1.94 (.62–3.25) | .004* | −.16 (−1.40 to 1.08) | .80 | |||
| Simultaneous | HIV+ | 76.22 (74.25–78.18) | … | −.74 (−2.04 to .57) | .27 | −2.50 (−3.90 to −1.11) | <.001* | .003* | .17 |
| HEU | 77.66 (75.21–80.11) | … | −3.05 (−4.64 to −1.45) | <.001* | −2.11 (−3.61 to −.60) | .01* | |||
| HUU | 78.72 (76.30–81.13) | + | −1.89 (−3.51 to −.27) | .02* | −3.17 (−4.73 to −1.61) | <.001* | |||
| Learning | HIV+ | 82.60 (80.42–84.79) | … | .54 (−1.20 to 2.29) | .54 | −3.42 (−4.66 to −2.17) | <.001* | <.001* | .97 |
| HEU | 85.48 (82.58–88.38) | … | −.33 (−2.68 to 2.01) | .78 | −3.06 (−4.40 to −1.72) | <.001* | |||
| HUU | 87.31 (84.45–90.17) | + | −.17 (−2.46 to 2.11) | .88 | −3.19 (−4.32 to −2.05) | <.001* | |||
| Planning | HIV+ | 71.66 (69.56–73.75) | … | −1.13 (−2.76 to .51) | .18 | −1.49 (−2.50 to −.47) | .004* | <.001* | .001* |
| HEU | 74.33 (71.68–76.98) | + | −2.59 (−4.66 to −.51) | .01* | −2.70 (−4.11 to −1.29) | <.001* | |||
| HUU | 74.58 (72.07–77.09) | + | −4.60 (−6.40 to −2.80) | <.001* | −3.33 (−4.90 to −1.77) | <.001* | |||
| Delayed recall | HIV+ | 84.11 (81.94–86.29) | … | 2.10 (.21–3.98) | .03* | −3.11 (−4.50 to −1.72) | <.001* | .01* | .23 |
| HEU | 87.66 (84.93–90.38) | + | 3.37 (1.02–5.72) | .01* | −2.00 (−3.56 to −.44) | .01* | |||
| HUU | 87.54 (84.65–90.44) | + | 1.02 (−1.52 to 3.57) | .43 | −1.16 (−2.56 to .24) | .10 |
Data include changes from Week 0 to Week 48 and from Week 48 to Week 96. Results were adjusted for site; sex and age at entry; WHO height for age z-score; school status; caregiver relation; residential zone; length of time with caregiver; socioeconomic index; and MICS disability and development. Change represents the within-cohort change between noted weeks (eg, Week 0–Week 48, Week 48–Week 96). *P value < .05. + indicates a P value < .05 for a pairwise comparison with the HIV+ cohort.
Abbreviations: CI, confidence interval; HEU, cohort of people exposed to HIV but uninfected; HIV, human immunodeficiency virus; HIV+, cohort of people living with HIV; HUU, cohort of people unexposed to HIV and uninfected; LS mean, adjusted mean; MICS, Multiple Indicators Cluster Survey; WHO, World Health Organization.
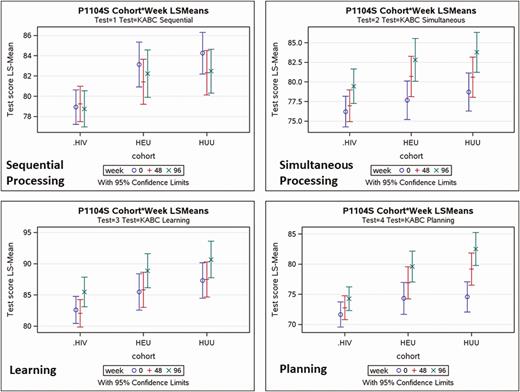
For the principal performance measures of the KABC-II, this figure depicts the mean plots for the least squares adjusted means and 95% confidence intervals (top and bottom of bar) for each of the 3 cohorts (HIV+, HEU, and HUU) at each of the 3 assessment times (Weeks 0, 48, and 96). The 4 principal KABC-II performance outcomes are (A) sequential processing (working memory), (B) simultaneous processing (visual-spatial processing and problem solving), (C) learning, and (D) planning (reasoning executive processing). Abbreviations: HEU, cohort of people exposed to HIV but uninfected; HIV, human immunodeficiency virus; HIV+, cohort of people living with HIV; HUU, cohort of people unexposed to HIV and uninfected; KABC-II, Kaufman Assessment Battery for Children, second edition.
Table 5 presents the parameter estimates and standard errors for the associations between the global neuropsychological test scores and most of the covariates listed in Table 1. Cohort, week, and cohort-by-week variables were included in these linear models. Child disability and development scores were strongly associated with all the global measures, so that those children with less disability and higher development scores performed better. The TOVA attention performance measures and the BOT-2 were also especially related to whether the child was in school. Higher socio-economic status index scores were predictive of better KABC-II scores. Rural children performed more poorly on the NVI and BOT-2. Children with higher height-for-weight z-scores performed better on the KABC-II global measures, the BOT-2, and the BRIEF GEC. Most of these covariates were also significantly predictive of the BOT-2 motor proficiency total score (Table 5).
Adjusted Parameter Estimates and Standard Errors
| Covariate/Level | Adjusted Beta Estimates (SE) | ||||||
|---|---|---|---|---|---|---|---|
| KABC-II Nonverbal Index | KABC-II Mental Processing Index | BOT-2 Motor Proficiency Total Score | BRIEF Global Executive Composite | TOVA ADHD Index | TOVA D Prime Standard | ||
| Site | Malawi | 10.19 (2.09)*** | 10.46 (1.99)*** | .63 (1.30) | −6.07 (1.88)** | 2.19 (.47)*** | 9.04 (2.06)*** |
| Uganda | .28 (1.63) | 2.85 (1.54) | −5.23 (.98)*** | −4.29 (1.37)** | 1.35 (.36)*** | 7.51 (1.52)*** | |
| Zimbabwe | .31 (1.88) | 2.73 (1.88) | −5.59 (1.12)*** | −1.88 (1.63) | 1.13 (.45)* | 3.50 (1.89) | |
| Joburg | 7.56 (1.77)*** | 8.37 (1.58)*** | −3.19 (.85)*** | 2.50 (1.40) | 2.03 (.37)*** | 9.21 (1.67)*** | |
| Soweto | 4.53 (1.79)* | 3.52 (1.68)* | −1.91 (.97)* | 3.96 (1.55)* | 3.33 (.40)*** | 2.04 (1.74) | |
| Tygerberg | REF | REF | REF | REF | REF | REF | |
| Sex | Female | .03 (.81) | .87 (.78) | −.82 (.47) | .93 (.73) | .11 (.18) | −3.59 (.83)*** |
| Male | REF | REF | REF | REF | REF | REF | |
| Age at P1104s entry | Continuous | .61 (.34) | .52 (.33) | −.80 (.18)*** | .34 (.29) | −.19 (.08)* | −.52 (.36) |
| In school at time of KABC-II | No | .51 (.67) | 1.45 (.64)* | −1.85 (.48)*** | .62 (.74) | −.78 (.19)*** | −5.07 (.89)*** |
| Yes | REF | REF | REF | REF | REF | REF | |
| WHO height z-score | Continuous | 1.17 (.44)** | 1.36 (.41)*** | .73 (.23)** | −.72 (.36)* | .02 (.09) | .49 (.45) |
| Biological mom | No | 1.72 (1.47) | .45 (1.16) | 1.00 (.89) | −.05 (1.65) | −.40 (.36) | −.68 (1.60) |
| Yes | REF | REF | REF | REF | REF | REF | |
| Caregiver less than 5 years | No | 1.25 (1.37) | .90 (1.19) | 1.01 (.74) | −.18 (1.37) | .09 (.29) | −.42 (1.44) |
| Yes | REF | REF | REF | REF | REF | REF | |
| Residential zone | Peri-urban | .99 (1.35) | −.03 (1.33) | .14 (.78) | −.83 (1.16) | .22 (.31) | .22 (1.31) |
| Rural | −2.86 (1.26)* | −2.38 (1.25) | −1.99 (.77)* | −.79 (1.25) | .17 (.32) | −.48 (1.36) | |
| Urban | REF | REF | REF | REF | REF | REF | |
| Child, MICS4 disability score | 0, none | 4.61 (1.38)*** | 5.96 (1.30)*** | 3.20 (.87)*** | −6.67 (1.18)*** | .98 (.32)** | 3.31 (1.24)** |
| 1, some | 4.08 (1.49)** | 5.08 (1.40)*** | 2.18 (.90)* | −3.83 (1.34)** | .62 (.34) | 2.80 (1.36)* | |
| 2, high | REF | REF | REF | REF | REF | REF | |
| Child, MICS4 developmental score | Continuous | 1.22 (.45)** | 1.22 (.41)** | .83 (.26)** | −1.82 (.38)*** | .24 (.10)* | 1.59 (.45)*** |
| SES index score | Continuous | .87 (.26)*** | 1.07 (.25)*** | −.02 (.14) | .11 (.21) | .04 (.06) | −.29 (.26) |
Data are for the associations between selected neuropsychological global test scores and covariate predictors, for all study cohorts combined. Main factor effects (not shown) for cohort, week, and cohort by week were also included in the linear regression models. *P value < .05; **P value < .01; ***P value < .001.
Abbreviations: ADHD, attention deficit–hyperactivity disorder; BOT-2, Bruininks-Oseretsky Test for motor proficiency, second edition; BRIEF, Behavior Rating Inventory for Executive Function; D-prime, overall TOVA signal detection test performance; KABC-II, Kaufman Assessment Battery for Children, second edition; MICS4, United Nations International Children’s Emergency Fund Multiple Indicator Cluster Survey, fourth edition; REF, referent; SE, standard error; SES, socio-economic status; TOVA, Tests of Variables of Attention; WHO, World Health Organization.
DISCUSSION
The present study reports neurocognitive outcomes for children from 6 sub-Saharan Africa study sites in 4 countries; enrolled children and caregivers were assessed in 10 different languages [6]. This study includes 3 assessments (at baseline, Week 42, and Week 96) over a 2-year period, establishing a trajectory of neuropsychological performance in middle childhood. At baseline (Week 0), we documented significant deficits in the global performance scores for our principal KABC-II cognitive performance domains, TOVA ADHD measure, and BOT-2 total motor proficiency outcomes for the HIV+ cohort, compared to their HEU and HUU counterparts [1].
Although overall neuropsychological performance scores differed across sites, exposure group differences on neuropsychological outcomes were remarkably consistent across all 6 sites, representing a greater level of rigor and reproducibility than documented in single-site studies. However, between-site differences in the present study raise questions about cross-cultural consistency in the adaption of our neuropsychological measures across the local languages in which testing occurred. This is despite our quality assurance program for testing, especially for the KABC-II, which was centralized for all 6 sites and all study testers [6]. Although we adjusted for study site when evaluating our between-group neuropsychological outcomes [1], we could not be sure that we adequately controlled for these effects, given the variance in scores.
Consistent with our baseline findings, the HIV+ cohort had significant deficits, compared to the HEU and HUU cohorts, across all 3 time points. As in our baseline paper, the HEU and HUU cohorts did not differ significantly on any of the neuropsychological outcomes, consistent with findings in a study of HEU and HUU children in Botswana [1, 20]. These findings were supported by a recent study of HIV+, HEU, and HUU cohorts of Cameroonian children from 4 to 9 years of age who were also assessed with the KABC-II [21]. Even though all the children living with HIV were initiated on ART before 12 months of age (PEDIACAM clinical trial), they performed significantly worse than their HEU and HUU counterparts on the composite global performance indices of the KABC-II (NVI and MPI). The Cameroonian children living with HIV also had more neurological dysfunction and caregiver-reported developmental problems, as measured by the strengths and difficulties questionnaire. As was the case with our P1104s cohorts, the Cameroonian PEDIACAM HEU and HUU cohorts did not differ significantly from each other on KABC-II performance.
The PEDIACAM findings for Cameroonian children living with HIV were consistent with those of Thai children in the PREDICT clinical trials, who were randomized, upon diagnosis with HIV, to either immediate ART (after 1 year of age) or deferred ART (waiting until CD4 counts were between 15 and 25%, or when less than 15%). At the school age neuropsychological assessment, Thai children living with HIV did significantly more poorly on all major neuropsychological test outcomes, compared to their HEU counterparts [2]. Furthermore, those initiated on ART immediately after 1 year of age did not do any better than those who were deferred until their CD4 percent indicated immunodeficiency. The PREDICT investigators concluded that neurodevelopmental and neuropsychological benefit from ART for children with HIV when reaching school age may depend on initiating ART in infancy.
Further, early ART–treated CHER study children, who were initiated on ART before 3 months of age, performed as well on neurodevelopmental assessments as their HEU and HUU counterparts at 10 to 18 months, while the deferred-ART treatment arm children did not [5]. All performed equally well at 5 years, suggesting a possibility for improvement [22]. However, at 5 years of age there was some indication of poorer visual perception performance in the South African CHER children living with HIV, compared to the HEU cohort, irrespective of the ART treatment arm [22].
Consistently among the 3 cohorts, improvements for our KABC-II global neurocognitive domains were more significant between Weeks 48 and 96 and were greater than between Weeks 0 and 48. The single exception to this was for the KABC-II planning (reasoning/executive functioning) domain, where the HIV+ cohort improved much less across the 3 time points than the HEU and HUU cohorts. This is important given the growing concern about executive processes in HIV+ children as they survive into adolescence and early adulthood because of better access to medical support, care, and cARV medical treatment [3]. Deficits in executive processes in HIV+ children can lead to poor adherence to ARV treatment, early sexual debuts and promiscuity, a greater propensity to addiction, a greater propensity for risk-taking behavior and accidents, and greater vulnerability to psycho-social and psychiatric afflictions [23, 24]. This study provides conclusive evidence that HIV+ African children are at significant neuropsychological risk, even with early ART treatment initiation and careful medical support. These findings support the conclusions from a review by Boivin, Ruiseñor-Escudero, and Familiar-Lopez [25]. They also documented that although the more severe forms of HIV-associated neurologic deficits are reduced following early-age ART and viral suppression, neurocognitive and behavioral problems can persist and deepen into middle childhood. Thus, neuropsychological surveillance and remediation for HIV+ children are needed as a standard of care [26, 27].
Notes
Acknowledgments. The authors thank Drs. E. Pim Brouwers (National Institutes of Health [NIH]/National Institute of Mental Health) and Sonia Lee (NIH/National Institute of Child Health and Human Development) for serving as protocol advisors for the research leadership team for IMPAACT P1104s for their respective NIH institutes, and gratefully acknowledge their expertise and counsel during the study. The authors thank J. L. Ariansen from FHI360 for providing protocol administrative support, as well as Dr Elizabeth Petzold for providing support throughout the protocol approval, finalization, and study initiation process. They thank Jane Lindsey for key contributions to the study design, implementation, and analysis; Meredith Warshaw for critical review of the study design; and both Meredith Warshaw and Heather Ribaudo for advice on the study analysis. Lindsey, Warshaw, and Ribaudo are from the Center for Biostatistics in Acquired Immunodeficiency Syndrome Research at the Harvard T. H. Chan School of Public Health.
Financial support. This work was supported by the International Maternal Pediatric Adolescent Acquired Immunodeficiency Syndrome Clinical Trials (IMPAACT) Network, with funding provided by the National Institute of Allergy and Infectious Diseases of the National Institutes of Health (Award Numbers UM1AI068632 [IMPAACT LOC], UM1AI068616 [IMPAACT SDMC], and UM1AI106716 [IMPAACT LC]); the Eunice Kennedy Shriver National Institute of Child Health and Human Development; and the National Institute of Mental Health.
Potential conflicts of interest. The authors: No reported conflicts of interest. All authors have submitted the ICMJE Form for Disclosure of Potential Conflicts of Interest. Conflicts that the editors consider relevant to the content of the manuscript have been disclosed.
References


Comments