


Abstract
Background. Investigators have attributed protective effects of statins against pneumonia and other infections. However, these reports are based on observational data where treatments are not assigned randomly. We aimed to determine if the protective effects of statins against pneumonia are due to nonrandom treatment assignment.
Methods. We built a cohort consisting of 124 695 Medicare beneficiaries diagnosed with an acute myocardial infarction (AMI) for which we had complete claims data. We considered patients who survived at least 30 days post-AMI (full sample), or who survived for 1 year post-AMI (survivors). First, we used ordinary least squares (OLS) and logit models to determine if receiving a statin was protective against pneumonia. Second, to control for nonrandom treatment assignment, we performed an instrumental variables analysis using geographic treatment rates as an instrument. All models included patient demographics, medications, diagnoses, length of hospital stay, and out-of-pocket drug costs as covariates. Our outcome measure was a pneumonia diagnosis during the 1 year following AMI.
Results. A total of 76 994 patients (61.9%) filled a statin prescription, and 19 078 (15.3%) were diagnosed with pneumonia. Using OLS, the statin coefficient was −0.016 (P < .001), indicating that statins are associated with a reduction in pneumonia. Using instrumental variables, we find that statin prescriptions are not associated with a reduction in pneumonia. For the full sample, statin coefficients ranged from −0.001 to −0.01 (P > .6).
Conclusions. For patients with AMI, the protective effect of statins against pneumonia is most likely the result of nonrandom treatment assignment (ie, a healthy-user bias).
Several investigations report a protective effect of statins against a broad range of infections and related syndromes [1–13]. Examples include pneumonia [4–9], sepsis [10], fungal infections [11], postoperative infections [12] Clostridium difficile colitis [14], and influenza [13]. The observed protective effects are generally attributed to anti-inflammatory properties of statins referred to as pleiotropic effects; however, several protective biological mechanisms have been proposed [15–19]. Although the majority of studies report protective effects for statins against infections and related syndromes, not all do [20–24]. For example, a recent randomized controlled trial (RCT) showed that statins did not prevent ventilator-associated pneumonia [25]. Indeed, some have speculated that the observed protective effect may be the product of a healthy-user bias [20, 23, 24, 26], in which healthier patients, who are less likely to develop infections in general, are more likely to be prescribed statins. To control for differences between patients, a few observational studies used propensity scores, but these studies have yielded mixed results [8, 9, 20].
Noting the limitations of observational studies, several reports call for RCTs [2, 19]. Although RCTs are the best way to protect against the bias inherent in observational studies, they are expensive, slow, and often not generalizable or even feasible. Economists have developed an alternative approach to RCTs to account for nonrandom treatment assignment using instrumental variables.
With the use of instruments—variables not associated with clinical outcomes independent of treatment—researchers can perform an ex post treatment randomization, as the instrument in effect “randomizes” patients into groups more and less likely to be treated [27]. In this study, we use local area statin treatment variation as an instrument. We exploit the fact that being prescribed a statin varies dramatically across the United States [28]. In other words, some patients are prescribed a statin because they live in a high-treatment-rate area and would not have been prescribed a statin if they lived in a low-treatment-rate area. Thus, the variation in geographic treatment rates in effect randomizes people into groups with higher and lower probabilities of statin treatment.
The objective of this study is to determine if the observed protective effects of statins against pneumonia are a result of nonrandom treatment assignment rather than a direct effect of the medication. First, we determine if we can replicate the positive results from observational studies using traditional statistical methods. Second, we determine if this protective effect persists when using geographic treatment rates as an instrumental variable to account for healthy-user bias.
METHODS
Study Cohort
With an approval from the University of Iowa's institutional review board, we built a cohort to study post-AMI outcomes. We used all Medicare claims information (eg, providers, diagnoses, and procedures), enrollment information (eg, demographics), and Part D prescription drug events (specific information about each prescription filled) from the Chronic Condition Data Warehouse (www.ccwdata.org) for patients hospitalized with an AMI in 2007 and 2008 (an inpatient stay with the primary diagnosis code 410.x1 at any time during the year).
For each patient, the acute hospital admission date for an AMI served as the index date. We included patients with AMIs from the analysis if the patient (1) survived for at least 30 days after their index stay; (2) did not have an AMI within 12 months prior to the index date; (3) was enrolled in Medicare Parts A and B during the 12 months prior to and the 12 months after the index stay; and (4) was enrolled in Medicare Part D during the 6 months prior to and the 12 months after the index stay.
To ensure a consistent statin measurement period postdischarge, we further excluded patients who used hospice or skilled nursing care or were readmitted within 30 days post-AMI discharge. These restrictions are necessary because we cannot observe statin treatment during inpatient stays. Our final cohort size was 124 695 post-AMI patients.
To determine whether patients had been treated after their AMI discharge with statins, we classified medications by merging the Medicare Prescription Drug Event files with the Multum Lexicon Plus dataset (Lexi-Comp, Inc and/or Cerner Multum, Inc) to obtain all prescription-fill information for the drug class. We defined statin treatment initiation as any statin prescription (atorvastatin, rosuvastatin, simvastatin, pravastatin, lovastatin, fluvastatin, pitavastatin) filled within the first 30 days after discharge from the AMI index hospitalization. Pneumonia was defined as a primary diagnosis of pneumonia/influenza (International Classification of Diseases, Ninth Revision [ICD-9] code 480.0–483.99 or 485–487) or a secondary diagnosis of pneumonia/influenza with a primary diagnosis of respiratory failure (ICD-9 code 518.81) or sepsis (ICD-9 code 038.xx) during the year after the AMI discharge [8]. Both inpatient and outpatient claims were included. We attempted to control for potential confounders by including a broad range of covariates. These covariates included patient demographics; baseline (preindex AMI) medical conditions; medications; AMI diagnosis type; procedures; complications; the number of days spent in intensive care, other guideline-recommended medications filled postdischarge (β-blockers, angiotensin-converting enzyme inhibitors, angiotensin II receptor blockers) [29]; Medicare Part D insurance variables including premium levels, Medicare benefit phase and beneficiary accumulated total and out-of-pocket drug costs; whether patients were Medicaid eligible; whether the patient receives a low-income subsidy; and socioeconomic characteristics from the US Census for the patient residence ZIP (postal) code (per capita income, poverty rate, education level, English-speaking percentage, life expectancy). A list of these variables and their sources are included in the Supplementary Appendix.
Ordinary Least Squares and Logit Models
To determine the effect of statins on pneumonia, we estimated statin treatment effects using both ordinary least squares (OLS) models and logistic regression models (logit) using the full sample size (124 695). Because some subjects (16%) did not survive for the entire study period, we also estimated OLS and logit models for only those patients who were alive for the entire study period (104 087). For the OLS and logit models, the outcome variable is a diagnosis of pneumonia during the 1 year following AMI. Our independent variable of interest is whether or not the patient filled a statin prescription within the first 30 days postdischarge.
Instrumental Variables
Because statins are not prescribed randomly, inferring treatment effects by comparing treated patients with untreated patients may result in a biased estimate. Specifically, physicians may choose not to prescribe statins to AMI patients who are unlikely to survive long enough to accrue the protective benefits: these untreated patients may be at higher risk for infection from pneumonia, perhaps due to their overall frailty. With a strong instrument, instrumental variables models can mitigate, or even eliminate, this type of bias. A strong instrument is correlated with the treatment but not the outcome.
Using an instrumental variable approach, we can estimate the impact of expanding statin use to “marginal patients” on the incidence of pneumonia within 1 year of discharge [27]. In our case, marginal patients are those who receive treatment simply because they live in a high-treatment area.
To define low- and high-treatment areas, we defined local statin-treatment areas around Medicare AMI patient residence ZIP codes. We created local area practice-style measures based on threshold numbers of patients living within a specified driving time of each ZIP code [30]. Defining local areas based on the number of patients instead of distances alone helps account for urban/rural differences in healthcare access, as rural patients routinely drive greater distances for healthcare. We tested our hypothesis using subsets of 50, 100, 150, and 200 patients to determine area treatment rates. For each subset, we calculated the average statin treatment rate for all subjects in the area. We also predicted the statin treatment rate for each area based on the characteristics of the patients in each local area. The ratio of the actual to the predicted treatment rate for all subjects in the area served as our instrumental variable.
In the first stage of our instrumental variable analysis, statin use was regressed against all of the covariates and the instrument, and predicted statin treatment obtained. A Chow test was then performed to test the strength of the instrument [31]. In the second stage, the specific outcome variable (ie, pneumonia) was regressed against the predicted statin treatment from the first stage as well as all of the other noninstrument covariates. The treatment effect estimate produced in the second stage of an instrumental variable model reveals the average absolute effect of statins on pneumonia occurrence for the marginal patients—in our case, those patients whose treatment is affected by the treatment rates of the area where they live.
All analysis was performed using SAS software version 9.3 (SAS, Institute, Cary, North Carolina).
RESULTS
In our cohort, 19 078 (15.3%) patients were diagnosed with pneumonia during the observation period, and 97.5% of these were primary cases. A total of 76 994 (61.9%) filled a statin prescription. Those who filled a statin prescription differed from those who did not (Table 1). For example, statin users were less likely to have stroke, heart failure, chronic kidney disease, or depression. Statin users were also younger, on average, than nonstatin users, and they were less likely to be eligible for Medicaid or discharged to post–acute care.
Baseline Characteristics
| No. (%) | |||
|---|---|---|---|
| Characteristic | All | On Statin | Not on Statin |
| (124 391) | (76 994) | (47 397) | |
| Comorbid condition | |||
| Pneumonia (post-AMI) | 19 078 (15.3) | 9771 (12.7) | 9318 (19.7) |
| COPD (in year before AMI) | 32 321 (25.9) | 16 056 (23.8) | 16 265 (28.5) |
| Asthma (in year before AMI) | 9127 (7.3) | 4848 (7.2) | 4279 (7.5) |
| Age, y | |||
| 66–70 | 25 385 (20.3) | 15 994 (23.7) | 9391 (16.5) |
| 71–75 | 24 865 (19.9) | 14 879 (22.0) | 9986 (17.5) |
| 76–80 | 25 548 (20.5) | 14 305 (21.2) | 11 243 (19.7) |
| 81–85 | 23 239 (18.6) | 11 923 (17.6) | 11 316 (19.8) |
| >85 | 25 658 (20.6) | 10 514 (15.6) | 15 144 (26.5) |
| Race | |||
| White | 10 3681 (83.2) | 56 003 (82.8) | 47 678 (83.5) |
| Black | 9800 (7.9) | 5094 (7.5) | 4706 (8.2) |
| Hispanic | 7370 (5.9) | 4217 (6.2) | 3153 (5.5) |
| Other | 3844 (3.0) | 2301 (3.4) | 1593 (2.7) |
| Female sex | 71 396 (57.3) | 37 323 (55.2) | 34 073 (59.7) |
| Metro residence | 86 057 (69.0) | 46 301 (68.5) | 39 756 (69.7) |
| Dually eligible for Medicaid | 42 010 (33.7) | 22 400 (33.1) | 19 610 (34.4) |
| Statin use before AMI (180 d) | 55 340 (44.4) | 35 882 (53.1) | 19 458 (34.1) |
Abbreviations: AMI, acute myocardial infarction; COPD, chronic obstructive pulmonary disease.
To determine whether we could replicate the positive results from other observational studies, our first set of analyses involved estimating absolute statin effects using OLS models (Table 2). For both data sets, considering those who survived for at least 30 days and those who survived for the entire study period, having filled a statin prescription was related to a decreased probability of a pneumonia diagnosis in the following year. The coefficient on the statin variable was −0.017 (P < .01) for the full sample, and −0.015 (P < .001) for the 1-year survivors. The logit model results are similar: The average absolute effect associated with the statin variable was −0.016 (P < .001) for the full sample and −0.015 (P < .001) for the 1-year survivors. These results are all very similar and can be interpreted that an approximate 1.5% reduction in the probability of pneumonia is associated with filling a statin prescription.
Risk Adjustment Model Results
| Statistic | OLS, Full Sample (124 391) | Logit Model, Full Sample (124 391) | OLS, Survivors Only (105 137) | Logit Model, Survivors Only (105 137) |
|---|---|---|---|---|
| Parameter estimate | −0.0166 | −0.0161 | −0.0146 | −0.0141 |
| SD | 0.0024 | 0.0024 | 0.0024 | 0.0024 |
| P value | <.0001 | <.0001 | <.0001 | <.0001 |
Abbreviations: OLS, ordinary least squares model; SD, standard deviation.
To determine whether we found a protective effect of statins against pneumonia using an instrumental variable approach, we estimated a 2-stage least squares model (Table 3). For our first-stage equations, we estimated individual statin treatment as a function of local area statin treatment. Statin treatment varied considerably among regions [28]. This can be seen in Figure 1, where statin treatment ratios are shown on a map of the northeastern United States. As a sensitivity analysis, we used 4 different treatment areas for our instrument representing local area statin treatment: We averaged the statin treatment rates for 50 patients surrounding each patient ZIP code. We also used areas with 100, 150, and 200 patients. Our instruments were highly significant and strong predictors of individual statin treatment: F-statistics from the Chow test are considered good if they are >9 [31]. Our F-statistics ranged from 1240.75 to 3072.74 for the full sample, and from 1019.09 to 2598.29 for the 1-year survivors. In addition, using a Pearson correlation coefficient, pneumonia was not correlated with the instrument (r = 0.0074).
Two-Stage Instrumental Variable Results
| Circle Size | Statistic | 2SLS, Full Sample (124 391) | Logit Model, Full Sample (124 391) | 2SLS, Survivors Only (105 137) | Logit Model, Survivors Only (105 137) |
|---|---|---|---|---|---|
| 50-person local area | Parameter estimate | −0.0076 | −0.0071 | −0.0159 | −0.0141 |
| SE | 0.0154 | 0.0138 | 0.0155 | 0.0147 | |
| P value | .621 | .605 | .304 | .338 | |
| 100-person local area | Parameter estimate | −0.0010 | −0.0003 | −0.0200 | −0.0190 |
| SE | 0.0196 | 0.0158 | 0.0197 | 0.0168 | |
| P value | .958 | .983 | .311 | .260 | |
| 150-person local area | Parameter estimate | −0.0038 | −0.0035 | −0.0157 | −0.0150 |
| SE | 0.0223 | 0.0247 | 0.0226 | 0.0277 | |
| P value | .865 | .888 | .488 | .588 | |
| 200-person local area | Parameter estimate | −0.0111 | −0.0096 | −0.0297 | −0.0284 |
| SE | 0.241 | 0.0245 | 0.256 | 0.0247 | |
| P value | .646 | .696 | .226 | .251 |
Abbreviations: 2SLS, 2-stage least squares model; SE, standard error.
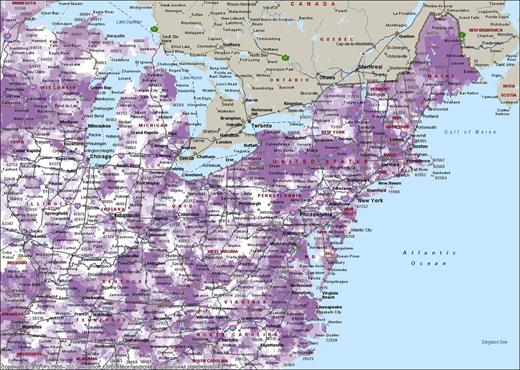
Statin treatment ratios for Medicare patients with post–acute myocardial infarction (AMI) in the northeastern United States. To control for differing rates of AMI in different regions, we have calculated the statin treatment ratio. The statin treatment ratio is the actual statin treatment rate divided by the predicted statin treatment rate for each ZIP code. Darker colors indicate more aggressive statin treatment in that area.
For the instrumental variables results (Table 3), none of the statin treatment variables were statistically significant. For the model with the full sample, OLS model coefficients were negative and ranged from −0.011 to −0.001, depending on treatment area size, but all of the P values were >.6. Marginal effects from the logit model ranged from −0.010 to −0.0003, and all P values were >.6. For the sample with only patients who survived for at least 1 year, all of the coefficient estimates for the OLS model were negative, and they ranged from −0.016 to −0.030, but all P values were >.2. Marginal effects from the logit model coefficients ranged from −0.014 to −0.028, and all P values are >.2.
DISCUSSION
Our results demonstrate a statistically significant protective effect for statins against pneumonia using traditional models, consistent with other findings [3–9]. However, these effects are small; filling a statin prescription is associated with a 1.6 percentage point decrease in the probability of pneumonia for the full sample, and a 0.4 percentage point decrease in pneumonia for the 1-year survivors. In addition, we also show that these modest observed protective effects disappear with an instrumental variables approach. Our instrumental variable allows us to mimic an RCT by randomly sorting patients into treated and nontreated groups based on where they live. Thus, we are able to reconcile the positive and negative published studies and can conclude that the positive effects of statins reported for statins against pneumonia are most likely due to the fact that the people who were treated with statins differ from those who were not.
Although we focused on pneumonia, it is possible that previously reported positive effects for wide range of infections in multiple observational studies are also due to a healthy-user bias rather than the biologic effects of statins. Whereas several studies have focused on pneumonia [3–9], others have focused on sepsis [10] and a broad range of other infections [12, 13]. Observational studies have demonstrated noninfectious protective effects of statins. For example, statin use has been associated with preserving renal function [32], lowering the risk for thromboembolic events [33], improving cancer-related outcomes [34], and improving survival after major trauma [35]. We think that the broad range of positive outcomes provide further reasons for skepticism that the positive outcomes associated with statin use are due to pleiotropic effects. Instead, it seems likely that the positive outcomes arise from statins being prescribed preferentially to healthier patients.
Indeed, previous studies have demonstrated that patients who are prescribed statins differ from patients who are not prescribed statins. In general, patients prescribed and who are adherent to statin prescriptions tend to act differently (eg, are more likely to seek out preventive care) [36] and perhaps pursue health-promoting behaviors. However, in our cohort of patients suffering an AMI, most patients were eligible and recommended for statin treatment. Yet, many were not treated (38%). Why were these patients not treated? Ultimately, a physician's decision about whether to prescribe a statin is based on clinical judgment. Thus, if a physician does not think that the likely benefits from statin treatment for an individual patient exceed risks for that patient, then he or she is probably less likely to prescribe the statin. Unfortunately, for most observational studies, information regarding overall clinical outlook or fear of side effects may not be sufficiently captured, so it is difficult to control for such data in traditional risk adjustment studies.
Despite the positive literature regarding the broad protective and noncardiovascular results, our results echo some of the results of the studies that suggested that these anti-infective benefits may be due to healthy-user bias. For example, studies that attempted to adjust for patient differences [20], including cognitive function or functional status [24], or pooled the results of multiple randomized statin trials designed to investigate other outcomes (eg, cardiovascular outcomes) [37] suggest that statins do not provide protection against infections or infectious syndromes. But despite these reports, observational studies purporting protective effects continue to be published. Perhaps the boldest proposal based on such positive observational results was that statins could be used in the event of an influenza pandemic [38]. However, giving statins to a larger population to prevent infections may lead to unwanted side effects. Indeed, statins have been associated with several side effects, including muscle injury and myopathy [39] and liver dysfunction [40].
One theme in the statin literature is the need for RCTs designed to investigate the protective effects of statins [2, 19]. While we agree that RCTs would be ideal, they also have several limitations. First, they are expensive and take a long time to complete. Second, the results of RCTs cannot necessarily be generalized to other populations. Third, statins are not without side effects or risk to the patients. Although we agree that RCTs represent the gold standard approach for measuring treatment efficacy, we propose the instrumental variable approach: Should we perform expensive randomized trials if a method designed to account for nonrandom treatment assignment does not show any positive treatment effect?
Our study has several limitations. First, our study population is exclusively comprised of patients who have been hospitalized for an AMI, so our results may not be generalizable. However, because our goal was to investigate the possibility of healthy treatment bias, we wanted a population recommended for statin treatment. Second, we were only able to determine that patients filled a prescription for a statin. Third, we only considered the first pneumonia within the first year following the patient's AMI; it is possible that some patients were infected multiple times. Furthermore, we also excluded people who died within 30 days after an AMI or after a second AMI so that we could completely verify statin use, but doing so may have missed some pneumonias. Finally, we are limited to using administrative data to measure health outcomes, so we are not able to distinguish the severity of pneumonia cases.
Another possible limitation is that our result that statins do not protect patients on the margin of treatment from pneumonia may be due to inefficient estimation rather than an absence of correlation. However, we believe these results are accurate for 2 reasons. First, our first-stage F-statistics are very large, and this indicates that our first-stage equation has predictive power. Second, large sample sizes, such as we have, decrease confidence intervals, making insignificant test results more credible.
Despite these limitations, we demonstrate in at least 1 major population of statin users that the protective effects of statins against pneumonia disappear once we account for nonrandom treatment assignment. Thus, the previously reported effects most likely reflect a healthy-user bias. Although our post-AMI study population was ideal for the purposes of this study, it is possible that statins confer a protective effect to other populations or for other health outcomes. In the absence of data from RCTs, a similar methodological approach should be used in future studies, focusing on other populations and other health outcomes.
Notes
Financial support. This work was supported by a grant from the Agency for Healthcare Research and Quality (grant number R01 HSO18381-01A1 to J. M. B.).
Potential conflicts of interest. All authors: No potential conflicts of interest.
All authors have submitted the ICMJE Form for Disclosure of Potential Conflicts of Interest. Conflicts that the editors consider relevant to the content of the manuscript have been disclosed.
References


Comments