


Abstract
Background. Human illness from influenza A(H7N9) was identified in March 2013, and candidate vaccine viruses were soon developed. To understand factors that may impact influenza vaccination programs, we developed a model to evaluate hospitalizations and deaths averted considering various scenarios.
Methods. We utilized a model incorporating epidemic curves with clinical attack rates of 20% or 30% in a single wave of illness, case hospitalization ratios of 0.5% or 4.2%, and case fatality ratios of 0.08% or 0.53%. We considered scenarios that achieved 80% vaccination coverage, various starts of vaccination programs (16 or 8 weeks before, the same week of, or 8 or 16 weeks after start of pandemic), an administration rate of 10 or 30 million doses per week (the latter rate is an untested assumption), and 2 levels of vaccine effectiveness (2 doses of vaccine required; either 62% or 80% effective for persons aged <60 years, and either 43% or 60% effective for persons aged ≥60 years).
Results. The start date of vaccination campaigns most influenced impact; 141 000–2 200 000 hospitalizations and 11 000–281 000 deaths were averted when campaigns started before a pandemic, and <100–1 300 000 hospitalizations and 0–165 000 deaths were averted for programs beginning the same time as or after the introduction of the pandemic virus. The rate of vaccine administration and vaccine effectiveness did not influence campaign impact as much as timing of the start of campaign.
Conclusions. Our findings suggest that efforts to improve the timeliness of vaccine production will provide the greatest impacts for future pandemic vaccination programs.
Four influenza pandemics have occurred since the beginning of the 20th century and have ranged widely in transmissibility and clinical severity [1, 2]. On 29 March 2013, the Chinese Center for Disease Control and Prevention confirmed 3 human infections with an avian influenza A(H7N9) virus not previously reported in humans [3]. The pandemic potential of this virus was unknown. However, the high case fatality rate among humans ill from infection with this H7N9 virus (44 of 135 cases) [4, 5], the increased affinity of H7N9 for human receptor binding when compared to avian influenza A(H5N1) [6, 7], and the lack of preexisting immunity among humans to H7N9 viruses [7, 8] raised concerns about the potential for substantial impact on human health if H7N9 were to develop the ability to transmit efficiently among humans. As a precautionary measure, the US Centers for Disease Control and Prevention (CDC) and other partners began development of H7N9 vaccine candidate viruses [9].
The potential impact of a pandemic influenza vaccination program can vary widely based on a number of factors, including the size, speed, and number of waves of the pandemic outbreak, the number of doses administered, the timing of the vaccination program relative to the spread of the novel influenza virus, and the vaccine effectiveness (VE) [10]. To help public health officials and policy makers evaluate the impact of a hypothetical vaccination program against a future influenza pandemic, we developed a spreadsheet-based model that allowed quick exploration of the number of hospitalizations and deaths averted in the United States under various vaccination scenarios.
METHODS
We adapted a spreadsheet model (Excel, Microsoft Corporation, Redmond, Washington) that was originally created to estimate the effects of a vaccine program against influenza A(H1N1)pdm09 [10]. The model user enters an epidemic curve (the number of persons becoming ill by time) and other variables that define the impact of both the pandemic and the vaccination campaign. These variables include the timing of the vaccination program relative to the introduction of cases into the United States, the number of doses administered per week and the allocation by age group, the clinical attack rate, and the ratios of health outcomes to the number of cases (eg, the case hospitalization and case fatality ratios) (Table 1). We adjusted calculations to account for individuals who were naturally immunized through infection but who may still be vaccinated.
List of Input Values Used to Calculate the Number of Hospitalizations and Deaths Prevented Due to a National Vaccination Program Against an Influenza Pandemic—United States
| Input | Value | Reference(s) | |
|---|---|---|---|
| Low | High | ||
| No. of initial cases | 100 | [11] | |
| Cumulative attack rate, % | 20 or 30 | [11] | |
| Case hospitalization ratio, % | [11, 12] | ||
| All ages | 1.05 | 4.2 | |
| 0–19 y | 0.15 | 0.6 | |
| 20–59 y | 0.45 | 1.8 | |
| ≥60 y | 6.96 | 28 | |
| Case fatality ratio, % | [11, 12] | ||
| All ages | 0.084 | 0.53 | |
| 0–19 y | 0.012 | 0.075 | |
| 20–59 y | 0.036 | 0.225 | |
| ≥60 y | 0.558 | 3.5 | |
| Vaccine effectiveness, % | |||
| Monovalent H1N1pdm09-like | [10] | ||
| First dose | All ages: 0 | ||
| Second dose | <60 y: 62 ≥60 y: 43 | ||
| High vaccine effectiveness | Assumption | ||
| First dose by age group | <60 y: 40 ≥60 y: 30 | ||
| Second dose by age group | <60 y: 80 ≥60 y: 60 | ||
| Delay in protection against the virus after the administration of the vaccine doses | 2 wk | [13] | |
| Cumulative vaccine coverage, all ages, % | 80 | Assumption | |
| Start of vaccination program relative to the first cases of pandemic influenza in the United States | 16 wk before 8 wk before The same week 8 wk after 16 wk after | Assumption | |
| Vaccination administration, in millions per weeka | 10 or 30 | [14] Assumption | |
| Distribution of available doses by age group, %b | 6 mo–9 y: 20 10–19 y: 15 20–59 y: 35 ≥60 y: 30 | Assumption | |
a We prioritized persons returning for their second doses of vaccine over persons who were receiving their first doses.
b Once 80% of an age group was fully vaccinated, we assumed vaccination would end in that age group. Remaining vaccine would then be allocated to other age groups until they all reached 80% coverage.
Calculation Overview
To estimate the number of infections prevented by the vaccination program, we took [the number of persons fully vaccinated 2 weeks prior to the current week in the model] × [the probability of not having been previously infected with influenza before being fully vaccinated and having developed immunity] × [probability of becoming infected with influenza after being fully vaccinated and having developed immunity] × [VE] [10]. We utilized standardized epidemic curves, using 20% and 30% clinical attack rates in 1 wave of illnesses and different levels of clinical severity and assumed that the pandemic began with 100 persons initially infected [11] (Table 1).
For our model, we assumed that 2 doses of vaccine administered 3 weeks apart would be needed to be fully effective, based on data indicating that previous H5 and H7 influenza vaccines have low immunogenicity [15–17]. We further assumed that, during a pandemic with moderate or high mortality, demand for vaccine would be such that 80% of the US population would receive 2 doses of vaccine. We prioritized persons returning for their second dose of vaccine over persons who were receiving their first dose. We also assumed that vaccine was allocated in a pattern similar to the doses administered among 4 age groups (6 months–9 years, 10–19 years, 20–59 years, and ≥60 years) during the 2012–2013 influenza season [18] (Table 1). Once 80% of an age group was fully vaccinated, we assumed vaccination would end in that age group. Remaining vaccine would then be allocated to other age groups until they reached 80% coverage. We allowed for a 2-week delay in protection against the virus after administration of the second dose of the vaccine [13].
We ran multiple scenarios to explore the effects of the quantity of the doses administered, the timing of the vaccine program, and the VE of the first and second doses. We first assumed that the program would administer either 10 million doses per week (approximating the maximum number of doses administered per week during seasonal influenza programs [14]) or 30 million doses per week; the latter has yet to be achieved during seasonal influenza vaccination programs. To explore the effects of timing of the vaccine program, we modeled programs starting at 5 different time points, separated by 8-week intervals: 16 weeks before, 8 weeks before, the same week as, 8 weeks after, and 16 weeks after the first cases of the novel influenza virus were introduced into the United States. We also assumed that 1 dose of vaccine was 0% effective for all age groups and 2 doses of vaccine were 62% effective in protecting against subclinical and clinical cases, hospitalizations, and deaths for persons aged <60 years and 43% for persons aged ≥60 years (Table 1). These values were based on the VE of the monovalent, inactivated, nonadjuvanted influenza A(H1N1)pdm09 vaccine [10]. For the second scenario, we assumed a high VE due to the use of higher concentrations of hemagglutinin antigen [19] or the addition of an adjuvant to the vaccine [20]. In the high VE scenario, we assumed some VE with 1 dose (40% VE for persons aged <60 years and 30% for persons ≥60 years) and higher VE with 2 doses (80% effective for persons aged <60 years and 60% for persons ≥60 years) (Table 1).
To calculate the number of vaccine-associated averted outcomes (hospitalizations and deaths), we assumed that 50% of infected cases were symptomatic and either 1.05% of symptomatic cases were hospitalized and 0.084% of symptomatic cases would die (low-severity scenario) or 4.2% of symptomatic cases were hospitalized and 0.53% of symptomatic cases would die (high-severity scenario) (Table 1). We adjusted the risk of hospitalization and death by age group (Table 1). The values for hospitalizations and deaths were based on estimates predicted for a pandemic with high clinical severity, and the adjustments for age were based on historic pandemics [11, 12].
RESULTS
Base Case Scenario
For the scenario with a cumulative clinical attack rate of 20%, without any other intensive interventions, the simulated pandemic peaked in the United States 20 weeks after the introduction of the first 100 cases and resulted in 127 000 000 infections, 63 500 000 clinical cases, and 669 000 hospitalizations and 54 000 deaths in the low-severity scenario or 2 700 000 hospitalizations and 336 000 deaths in the high-severity scenario (Figures 1–3). For the scenario with a cumulative clinical attack rate of 30%, the simulated epidemic peaked 12 weeks after the start and resulted in 188 000 000 infections, 94 000 000 clinical cases, and 1 070 000 hospitalizations and 86 000 deaths (low-severity scenario) or 4 300 000 hospitalizations and 538 000 deaths (high-severity scenario) (Figure 1). Vaccination programs distributing 10 million doses per week would take 54 weeks to achieve 80% coverage of a 2-dose vaccine series among all age groups, whereas programs distributing 30 million doses per week would take 21 weeks (Figure 1).
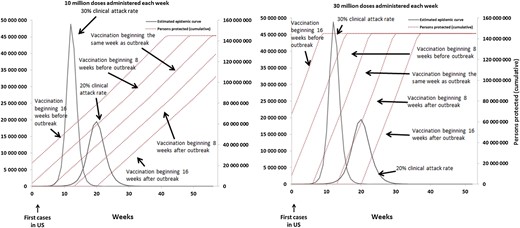
The estimated epidemic curve without vaccination and the cumulative number of persons protected by an influenza vaccination program with the following assumptions: an overall clinical attack rate of the influenza pandemic of 20% or 30%; administered 10 million (left) or 30 million (right) vaccine doses; vaccination programs that begin 8 or 16 weeks before, the same week, or 8 or 16 weeks after the first cases of a novel influenza virus occur in the United States (US); and the vaccine effectiveness (VE) equivalent to the H1N1pmd09 monovalent vaccine. 2009 H1N1-like VE: 2 doses of vaccine administered 3 weeks apart required to be fully effective (62% for persons aged <60 years and 43% for persons ≥60 years) in protecting against subclinical and clinical cases, hospitalizations, and deaths. We assumed 1 dose of vaccine to be 0% effective for all age groups.
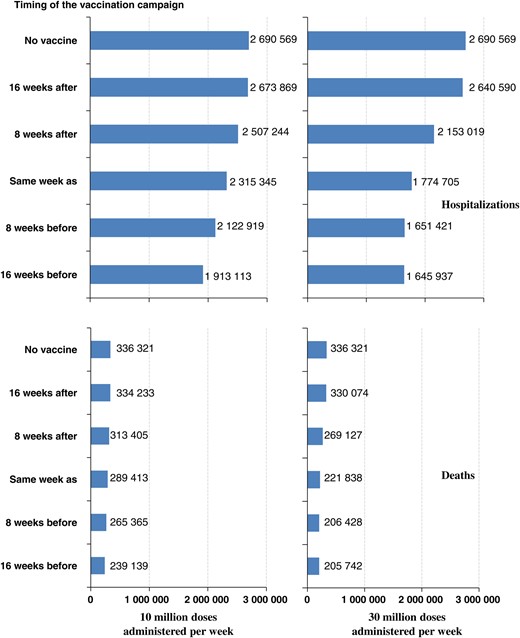
Number of hospitalizations (top) and deaths (bottom) if the overall clinical attack rate of the influenza pandemic is 20% and the overall case fatality ratio is 0.53% (high-severity scenario); 10 million doses (left) or 30 million doses (right) of vaccine are administered each week; the vaccination program begins 16 weeks after, 8 weeks after, the same week as, 8 weeks before, and 16 weeks before the first cases of a novel influenza virus occur in the United States; and the efficacy is “H1N1pmd09 monovalent vaccine–like.” 2009 H1N1–like vaccine effectiveness: 2 doses of vaccine administered 3 weeks apart required to be fully effective (62% for persons aged <60 years and 43% for persons ≥60 years) in protecting against subclinical and clinical cases, hospitalizations, and deaths. We assumed 1 dose of vaccine to be 0% effective for all age groups.
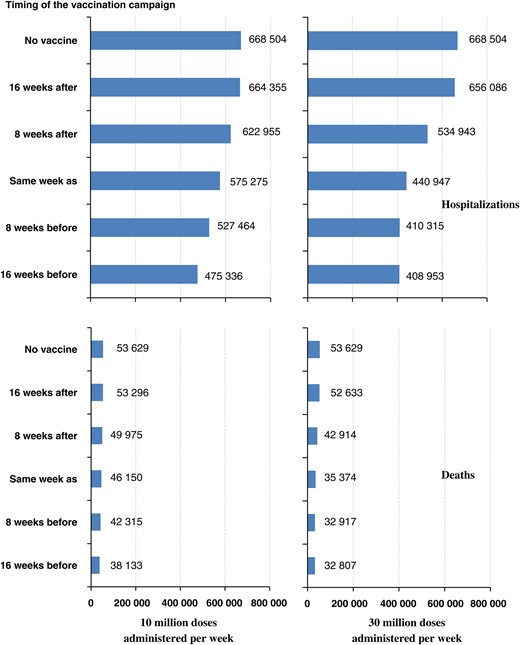
Number of hospitalizations (top) and deaths (bottom) if the overall clinical attack rate of the influenza pandemic is 20% and the overall case fatality ratio is 0.084% (low-severity scenario); 10 million doses (left) or 30 million doses (right) of vaccine are administered each week; the vaccination program begins 16 weeks after, 8 weeks after, the same week as, 8 weeks before, and 16 weeks before the first cases of a novel influenza virus occur in the United States; and the efficacy is “H1N1pmd09 monovalent vaccine–like.” 2009 H1N1-like vaccine effectiveness: 2 doses of vaccine administered 3 weeks apart required to be fully effective (62% for persons aged <60 years and 43% for persons ≥60 years) in protecting against subclinical and clinical cases, hospitalizations, and deaths. We assumed 1 dose of vaccine to be 0% effective for all age groups.
Effects of a Program Beginning Before (8 or 16 Weeks) the Introduction of Influenza Infections
For an influenza pandemic with a 20% overall cumulative attack rate and high clinical severity, we estimated that a vaccination program beginning 8 weeks before the pandemic started in the United States and that administered 10 million doses of vaccine with the moderate VE per week could avert 568 000 hospitalizations and 71 000 deaths (21% reduction relative to no vaccine). Starting the vaccination program 16 weeks before the pandemic started would avert 777 000 hospitalizations and 97 000 deaths (29% reduction) (Tables 2 and 3; Figures 2 and 3). A vaccine program administering 30 million doses per week that started 8 or 16 weeks before the pandemic would avert 1 000 000 hospitalizations and 130 000 deaths (39% reduction) (Tables 2 and 3; Figures 2 and 3). Assuming that the VE would be 80% and 60% for persons aged <60 years and ≥60 years, respectively (compared with the base assumption of 62% and 43% for persons aged <60 years and ≥60 years, respectively) would further reduce hospitalizations and deaths by at least an additional 10% relative to no vaccine for both the 10 and 30 million administration scenarios (Tables 2 and 3).
Number and Percentage of Hospitalizations Averted Relative to the Number of Hospitalizations Without Vaccination
| Timing of the Vaccination Program Relative to the Start of Cases in the United States | No. of Hospitalizations Averted in High-Severitya (H) or Low-Severitya (L) Scenarios, % Hospitalizations Averted Relative to No Vaccine | |||||||
|---|---|---|---|---|---|---|---|---|
| 10 Million Doses Administered per Week | 30 Million Doses Administered per Week | |||||||
| Cumulative Clinical Attack Rate of 20% | Cumulative Clinical Attack Rate of 30% | Cumulative Clinical Attack Rate of 20% | Cumulative Clinical Attack Rate of 30% | |||||
| 2009 H1N1-like Efficacyb | High Efficacyc | 2009 H1N1-like Efficacyb | High Efficacyc | 2009 H1N1-like Efficacyb | High Efficacyc | 2009 H1N1-like Efficacyc | High Efficacyc | |
| 16 wk before | 777 456 (H) | 1 105 624 (H) | 924 056 (H) | 1 362 815 (H) | 1 044 632 (H) | 1 417 695 (H) | 1 656 461 (H) | 2 252 778 (H) |
| 193 168 (L) | 274 706 (L) | 229 153 (L) | 338 608 (L) | 259 551 (L) | 352 243 (L) | 411 568 (L) | 559 730 (L) | |
| 29% | 41% | 21% | 32% | 39% | 53% | 38% | 52% | |
| 8 wk before | 567 650 (H) | 836 312 (H) | 569 629 (H) | 875 376 (H) | 1 039 148 (H) | 1 413 622 (H) | 1 441 707 (H) | 2 066 515 (H) |
| 141 040 (L) | 207 792 (L) | 141 531 (L) | 217 498 (L) | 258 189 (L) | 351 231 (L) | 358 209 (L) | 513 451 (L) | |
| 21% | 31% | 13% | 20% | 39% | 53% | 33% | 48% | |
| Same week as | 375 224 (H) | 572 394 (H) | 259 566 (H) | 448 871 (H) | 915 864 (H) | 1 303 629 (H) | 776 967 (H) | 1 326 099 (H) |
| 93 229 (L) | 142 218 (L) | 64 492 (L) | 111 527 (L) | 227 557 (L) | 323 902 (L) | 193 047 (L) | 329 485 (L) | |
| 14% | 21% | 6.0% | 10% | 34% | 48% | 18% | 31% | |
| 8 wk after | 183 325 (H) | 308 448 (H) | 12 132 (H) | 68 936 (H) | 537 550 (H) | 877 110 (H) | 36 394 (H) | 206 782 (H) |
| 45 549 (L) | 76 638 (L) | 3014 (L) | 17 128 (L) | 133 561 (L) | 217 929 (L) | 9043 (L) | 51 377 (L) | |
| 6.8% | 11% | 0.3% | 1.6% | 20% | 33% | 0.8% | 4.8% | |
| 16 wk after | 16 700 (H) | 52 206 (H) | 5 (H) | 79 (H) | 49 979 (H) | 156 030 (H) | 16 (H) | 236 (H) |
| 4149 (L) | 12 971 (L) | 1 (L) | 20 (L) | 12 418 (L) | 38 768 (L) | 4 (L) | 59 (L) | |
| 0.6% | 1.9% | 0% | 0% | 1.9% | 5.8% | 0% | 0% | |
Shown by number of vaccine doses administered per week (10 million or 30 million), cumulative clinical attack rate (20% vs 30%), clinical severity (high vs low), start of vaccination relative to cases (from 16 weeks before to 16 weeks after), and vaccine efficacy (moderate vs high).
a Overall case hospitalization ratio is 4.23% (high) or 1.05% (low).
b Two doses of vaccine administered 3 weeks apart required to be fully effective (62% for persons aged <60 years and 43% for persons ≥60 years) in protecting against subclinical and clinical cases, hospitalizations, and deaths. We assumed 1 dose of vaccine to be 0% effective for all age groups.
c Two doses of vaccine administered 3 weeks apart required to be to fully effective (80% for persons aged <60 years and 60% for persons ≥60 years) in protecting against subclinical and clinical cases, hospitalizations, and deaths. We assumed 1 dose of vaccine is 40% effective for persons aged <60 years and 30% for persons ≥60 years.
Number and Percentage of Deaths Averted Relative to the Number of Deaths Without Vaccination
| Timing of the Vaccination Program Relative to the Start of Cases in the United States | No. of Deaths Averted in High-Severitya (H) or Low-Severitya (L) Scenarios, % Deaths Averted Relative to No Vaccine | |||||||
|---|---|---|---|---|---|---|---|---|
| 10 Million Doses Administered per Week | 30 Million Doses Administered per Week | |||||||
| Cumulative Clinical Attack Rate of 20% | Cumulative Clinical Attack Rate of 30% | Cumulative Clinical Attack Rate of 20% | Cumulative Clinical Attack Rate of 30% | |||||
| 2009 H1N1-like Efficacyb | High Efficacyc | 2009 H1N1-like Efficacyb | High Efficacyc | 2009 H1N1-like Efficacyb | High Efficacyc | 2009 H1N1-like Efficacyb | High Efficacyc | |
| 16 wk before | 97 182 (H) | 138 203 (H) | 115 507 (H) | 170 352 (H) | 130 579 (H) | 177 212 (H) | 207 058 (H) | 281 597 (H) |
| 15 496 (L) | 22 037 (L) | 18 418 (L) | 27 164 (L) | 20 822 (L) | 28 258 (L) | 33 017 (L) | 44 902 (L) | |
| 29% | 41% | 21% | 32% | 39% | 53% | 38% | 52% | |
| 8 wk before | 70 956 (H) | 104 539 (H) | 71 204 (H) | 109 422 (H) | 129 893 (H) | 176 703 (H) | 180 213 (H) | 258 314 (H) |
| 11 314 (L) | 16 669 (L) | 11 354 (L) | 17 448 (L) | 20 712 (L) | 28 176 (L) | 28 736 (L) | 41 190 (L) | |
| 21% | 31% | 13% | 20% | 39% | 53% | 33% | 48% | |
| Same week as | 46 903 (H) | 71 549 (H) | 32 446 (H) | 56 109 (H) | 114 483 (H) | 162 954 (H) | 97 121 (H) | 165 762 (H) |
| 7479 (L) | 11 409 (L) | 5174 (L) | 8947 (L) | 18 255 (L) | 25 984 (L) | 15 487 (L) | 26 432 (L) | |
| 14% | 21% | 6.0% | 10% | 34% | 48% | 18% | 31% | |
| 8 wk after | 22 916 (H) | 38 556 (H) | 1516 (H) | 8617 (H) | 67 194 (H) | 109 639 (H) | 4549 (H) | 25 848 (H) |
| 3654 (L) | 6148 (L) | 242 (L) | 1374 (L) | 10 715 (L) | 17 483 (L) | 725 (L) | 4122 (L) | |
| 6.8% | 11% | 0.3% | 1.6% | 20% | 33% | 0.8% | 4.8% | |
| 16 wk after | 2088 (H) | 6526 (H) | 1 (H) | 10 (H) | 6247 (H) | 19 504 (H) | 2 (H) | 30 (H) |
| 333 (L) | 1041 (L) | 0 (L) | 2 (L) | 996 (L) | 3110 (L) | 0 (L) | 5 (L) | |
| 0.6% | 1.9% | 0% | 0% | 1.9% | 5.8% | 0% | 0% | |
Shown by number of vaccine doses administered per week (10 million or 30 million), cumulative clinical attack rate (20% vs 30%), clinical severity (high vs low), start of vaccination relative to cases (from 16 weeks before to 16 weeks after), and vaccine efficacy (moderate vs high).
a Overall case fatality ratio is 0.53% (high) or 0.084% (low).
b Two doses of vaccine administered 3 weeks apart required to be fully effective (62% for persons aged <60 years and 43% for persons ≥60 years) in protecting against subclinical and clinical cases, hospitalizations, and deaths. We assumed 1 dose of vaccine to be 0% effective for all age groups.
c Two doses of vaccine administered 3 weeks apart required to be to fully effective (80% for persons aged <60 years and 60% for persons ≥60 years) in protecting against subclinical and clinical cases, hospitalizations, and deaths. We assumed 1 dose of vaccine is 40% effective for persons aged <60 years and 30% for persons ≥60 years.
For an influenza pandemic with a 30% overall cumulative attack rate and high clinical severity, we estimated that a vaccination program beginning 8 weeks before the pandemic started in the United States that administered 10 million doses of vaccine with the moderate VE per week could avert 570 000 hospitalizations and 71 000 deaths (13% reduction relative to no vaccine). Starting the vaccination program 16 weeks before the pandemic started would avert 924 000 hospitalizations and 116 000 deaths (21% reduction) (Tables 2 and 3; Figures 2 and 3). A vaccine program administering 30 million doses per week that started 8 weeks before the pandemic would avert more than 1 400 000 hospitalizations and 180 000 deaths (33% reduction), whereas one that started 16 weeks before the pandemic would avert 1 700 000 hospitalizations and 207 000 deaths (38% reduction) (Tables 2 and 3; Figures 2 and 3). Using the high VE would further reduce hospitalizations and deaths relative to no vaccine for both the 10 and 30 million administration scenarios by at least an additional 7% (Tables 2 and 3).
Effects of a Program Beginning the Same Week as the Introduction of Influenza Infections
For an influenza pandemic with a 20% overall cumulative attack rate and high clinical severity, we estimated that a vaccination program beginning the same week as the pandemic started in the United States that administered 10 million doses of vaccine with the moderate VE per week could avert 375 000 hospitalizations and 47 000 deaths (14% reduction). A vaccine program administering 30 million doses per week that started the same week as the pandemic would avert 916 000 hospitalizations and 114 000 deaths (34% reduction) (Tables 2 and 3; Figures 2 and 3). Using the high VE would further reduce hospitalizations and deaths by at least an additional 7% relative to no vaccine for both the 10 million and 30 million administration scenarios (Tables 2 and 3).
For an influenza pandemic with a 30% overall cumulative attack rate and high-severity scenario, we estimated that a vaccination program beginning the same week as the pandemic started in the United States that administered 10 million doses of vaccine with the moderate VE per week could avert 260 000 hospitalizations and 32 000 deaths (6% reduction) (Tables 2 and 3; Figures 2 and 3). A vaccine program administering 30 million doses per week would avert 777 000 hospitalizations and 97 000 deaths (18% reduction) (Tables 2 and 3; Figures 2 and 3). Using the high VE would reduce hospitalizations and deaths by at least an additional 4% relative to no vaccine for both the 10 million and 30 million administration scenarios (Tables 2 and 3).
Effects of a Program Beginning After (8 or 16 Weeks) the Introduction of Influenza Infections
For an influenza pandemic with a 20% overall cumulative attack rate and high clinical severity, we estimated that a vaccination program beginning 8 weeks after the pandemic started in the United States that administered 10 million doses of vaccine with the moderate VE per week could avert 183 000 hospitalizations and 23 000 deaths (6.8% reduction relative to no vaccine). Beginning the vaccination program 16 weeks after the pandemic started would avert 17 000 hospitalizations and 2000 deaths (0.6% reduction) (Tables 2 and 3; Figures 2 and 3). A vaccine program administering 30 million doses per week that started 8 weeks after the pandemic would avert more than 538 000 hospitalizations and 67 000 deaths (20% reduction), whereas one that started 16 weeks after the pandemic would avert 50 000 hospitalizations and 6000 deaths (1.9% reduction) (Tables 2 and 3; Figures 2 and 3). Using the high VE would reduce hospitalizations and deaths by at least an additional 1% relative to no vaccine for both the 10 million and 30 million administration scenarios (Tables 2 and 3).
For an influenza pandemic with a 30% overall cumulative attack rate and high clinical severity, we estimated that no vaccination program that began 8 or 16 weeks after the pandemic started in the United States would avert more than 36 000 hospitalizations and 4600 deaths (<1% reduction), regardless of whether 10 million or 30 million doses of vaccine per week with the moderate VE were administered (Tables 2 and 3; Figures 2 and 3). Using the high VE would reduce hospitalizations and deaths by no more than 5% relative to no vaccine for the vaccination programs beginning 8 weeks after the pandemic started in the United States. For the high VE scenarios starting 16 weeks after the pandemic started in the United States, no additional reductions in hospitalizations or deaths were observed (Tables 2 and 3).
DISCUSSION
In our analysis, the clinical attack rate and case hospitalization and case fatality ratios had the greatest impact on the number of severe outcomes averted in the United States, whereas the vaccination program factor with the greatest impact was the timing of the start of vaccination relative to the start of a pandemic. For example, under the 30% clinical attack rate and 30 million doses per week scenario, a vaccination program starting 16 weeks before the start of the pandemic in the United States results in a 38% reduction in hospitalizations and deaths. Delaying the start of vaccination to the same week as the pandemic starts in the United States drops the reductions to 18%. The number of vaccine doses administered each week is also very important. Decreasing the doses administered to 10 million per week causes the impact of vaccination in the above 2 scenarios to decline to 21% and 6% reductions, respectively. The assumptions related to VE of the first and second doses were relatively less important.
This study highlights several key components to pandemic influenza preparedness, especially for a severe pandemic, including the importance of ensuring readiness to initiate large-scale vaccination programs as early as possible and ideally before the introduction of a novel influenza virus into the United States [18, 21]. Factors that may impact vaccine dose availability include how soon we develop an appropriate vaccine virus candidate, growth characteristics of vaccine virus candidates, influenza vaccine production capacity, efficiency of vaccine allocation and distribution, and vaccine administration capacity. Increased investment and research in vaccine production technologies, including the use of cell-derived recombinant proteins [22], virus-like particles [23], or adjuvants (by conserving the use of hemagglutinin antigen), have the potential to increase the speed with which the number of vaccine doses can be produced.
Also important is the need to identify ways to invest in improvements that will notably increase the capacity to administer large number of doses of pandemic influenza vaccine. Currently, the peak administration rate for seasonal influenza in the United States is between 5 and 12 million doses per week. The CDC is working with state and local health officials and vaccine providers to identify means to enhance vaccination administration capabilities. In addition to exercising large-scale mass vaccination clinics, this includes increasing partnerships with nontraditional vaccine providers, such as pharmacies, supermarket chains, and other community vaccine providers including diverse health, faith, and community based-organizations that reach vulnerable, at-risk, hard-to-reach, and minority populations [24, 25].
We evaluated a wide range of vaccine program initiation times relative to disease introduction in the United States in this article. Although this information cannot be known in advance, beginning vaccination 16 weeks prior to the introduction of disease in the United States might be possible if the pandemic virus was identified, a stockpiled influenza vaccine were available and appropriate for use, officials were prepared to administer vaccine, and the decision to vaccinate was made at least 28 weeks before the establishment of the virus in the United States (based on current estimates of 12 weeks to fill and finish and begin distribution of stockpiled pandemic vaccine) [26]. This timeline is dependent on robust novel influenza virus surveillance that can identify influenza viruses with pandemic potential before widespread transmission has occurred. During the 2009 H1N1 pandemic, however, the first cases were identified in the United States after widespread transmission had already occurred, and no stockpiled vaccine or vaccine candidate seed viruses were available. In this example, the first doses of vaccine became available 26 weeks after identification of the first case in the United States and 8 weeks after the start of the main wave of pandemic illness in the fall of 2009 [27]. This situation is demonstrated by the scenarios beginning 8 or 16 weeks after the introduction of the virus into the United States [28].
This study has several limitations. Most important, because infections with influenza A(H7N9) so far have been rare [5], the modeled number of pandemic-related hospitalizations and deaths, and the numbers of such that would be prevented by a vaccination program, can only be considered as illustrative and are not based on the current epidemiology of H7N9 or other novel influenza virus illnesses. These results, therefore, should not be interpreted as a prediction of the impact of a widespread outbreak of H7N9 or any other novel influenza A virus with pandemic potential. Additionally, we did not account for the effects of other interventions (eg, nonpharmaceutical interventions such as canceling mass gatherings or closing schools), the seasonality of when a novel virus might be introduced into the United States, or “waves of illness,” which are thought to have occurred in 3 modern pandemics [1, 2]. These factors could slow the course of the pandemic and thereby increase the amount of time to initiate and complete a vaccine program, increasing the number of hospitalizations and deaths averted. For ease of estimation, we also did not account for any adverse events associated with vaccination or for the indirect effects of vaccination (eg, herd immunity). Theoretically, accounting for indirect effects would likely increase the number of hospitalizations and deaths averted for those vaccination programs assumed to start before the pandemic; this effect would likely be lower for those programs assumed to start the same time as or after the pandemic. Another important assumption is that 80% of the population would want to be vaccinated. This is distinctly different from recent seasonal influenza coverage estimates of approximately 45% [14]. We do not know the precise correlation between severity of an influenza pandemic and public demand for vaccination, but 80% coverage may be an overestimate. Another potential limitation is that no data are available on the VE of a possible H7N9 vaccine. Thus, we based our estimates of VE of either an nonadjuvanted influenza vaccine, using data from the 2009 H1N1 pandemic, or a hypothetical vaccine with high VE based on data from adjuvanted 2009 H1N1 vaccine VE estimates. Limited data indicate that H7 vaccines have lower immunogenicity than seasonal influenza vaccines, which may result in lower VE [29, 30]. The population coverage or the effectiveness of a H7N9 or other future pandemic vaccine may be lower than what is assumed here, leading to a smaller number of averted outcomes.
Historically, influenza pandemics have been largely unpredictable events, and it is likely that the set of assumptions used in this study will vary from the actual events seen in the next pandemic, even if influenza A(H7N9) is the virus involved. However, the finding that variations in the timing of vaccination administration yield the greatest effect on the reduction in hospitalizations and deaths than do variations in rate of vaccine administration or effectiveness would likely remain consistent. Continued research and investment in work that improves the timeliness of vaccine production and administration will have the greatest benefits in the event of another influenza pandemic.
Notes
Disclaimer. The findings and conclusions in this report are those of the authors and do not necessarily represent the official position of the Centers for Disease Control and Prevention (CDC).
Supplement sponsorship. This article appears as part of the supplement titled “CDC Modeling Efforts in Response to a Potential Public Health Emergency: Influenza A(H7N9) as an Example,” sponsored by the CDC.
Potential conflicts of interest. All authors: No reported conflicts.
All authors have submitted the ICMJE Form for Disclosure of Potential Conflicts of Interest. Conflicts that the editors consider relevant to the content of the manuscript have been disclosed.
References


Comments