


Abstract
Because of the diverse etiologies of community-acquired pneumonia (CAP) and the limitations of current diagnostic modalities, serum procalcitonin levels have been proposed as a novel tool to guide antibiotic therapy. Outcome data from procalcitonin-guided therapy trials have shown similar mortality, but the essential question is whether the sensitivity and specificity of procalcitonin levels enable the practitioner to distinguish bacterial pneumonia, which requires antibiotic therapy, from viral pneumonia, which does not. In this meta-analysis of 12 studies in 2408 patients with CAP that included etiologic diagnoses and sufficient data to enable analysis, the sensitivity and specificity of serum procalcitonin were 0.55 (95% confidence interval [CI], .37–.71; I2 = 95.5%) and 0.76 (95% CI, .62–.86; I2 = 94.1%), respectively. Thus, a procalcitonin level is unlikely to provide reliable evidence either to mandate administration of antibiotics or to enable withholding such treatment in patients with CAP.
Community-acquired pneumonia (CAP) is a major cause of morbidity and mortality [1], and its incidence is only increasing with an aging global population [2]. The etiology of CAP is complex, with bacteria and viruses playing major roles [3–6]. In cases of bacterial pneumonia, initial antibiotic treatment is important for infection resolution [7], and a shorter time between diagnosis and treatment improves prognosis [8, 9]. However, because of the diverse etiologies and the limitations of extant diagnostic techniques, empiric antibiotic therapy is a standard recommendation for all adults with CAP [10], and the clinician finds him/herself with the conundrum of having to select recommended antibiotics versus avoiding unnecessary ones [11].
Procalcitonin, a peptide with serum levels that are believed to increase during bacterial, but not during viral, infections, was approved by the US Food and Drug Administration to guide initiation and duration of antibiotic treatment in suspected lower respiratory tract infections [12–14]. However, many clinical studies that are cited to support this concept have centered on pediatric patients in whom etiologies have not been well established and/or adults who have a variety of respiratory disorders [15]. Furthermore, studies that have evaluated outcomes from procalcitonin-based protocols have allowed physicians to overrule the procalcitonin-guided protocol based on “clinical judgment,” thereby clouding results [16, 17]. We have recently suggested that procalcitonin levels in pneumonia vary widely in their sensitivity and specificity [18, 19]. Despite these uncertainties, this test appears to be in widespread use in US hospitals for patients admitted with CAP [20].
The aim of the present systematic review and meta-analysis is to evaluate studies that deal exclusively with CAP in adults and stratify patients based on established etiology, in order to determine whether an elevated serum procalcitonin level can distinguish bacterial from viral pneumonia.
METHODS
Literature Review
We sought studies that focused on serum procalcitonin levels in adult patients with CAP in whom the etiology was established. The PubMed database was used to identify all English-language articles using the following subject terms: “procalcitonin community acquired pneumonia adults,” “procalcitonin sepsis adults,” and “procalcitonin respiratory tract infection adults.” In addition, manual searches of reference lists from potentially relevant papers were performed to identify additional articles. This search returned 1513 results (Figure 1). After filtering by titles and abstracts and removing duplicates, 571 papers remained. Only 40 papers specifically stratified procalcitonin levels based on a documented bacterial versus nonbacterial etiology of CAP. Of these 40 studies, 12 that included a total of 2408 patients reported sufficient statistics to allow calculation of true-positive, true-negative, false-positive, and false-negative values and were included in our analysis [5, 21–31]. Authors of the present meta-analysis reviewed these 12 remaining articles, extracting data from text, tables, and figures. In the entire review process, discrepancies among the authors were resolved by discussion and consensus.
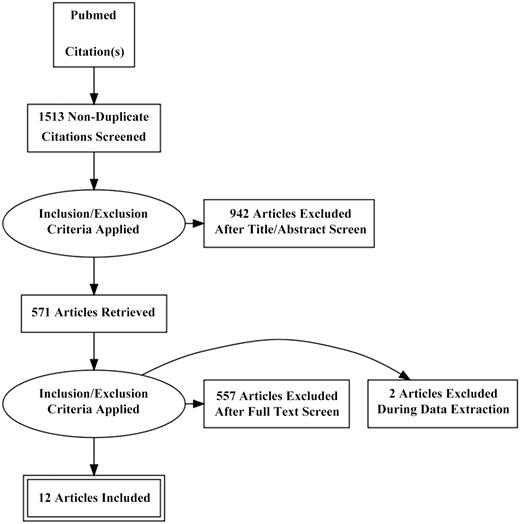
Preferred Reporting Items for Systematic Reviews and Meta-analyses diagram indicating method for selection of papers included in the present study.
Assessing for Risk of Bias
The Quality Assessment of Diagnostic Accuracy Studies 2 (QUADAS-2) tool was used to assess the methodological quality of the studies [32]. Each study was evaluated for risk of bias regarding patient selection, index test, reference standard, and flow (eg, lost to follow-up) and timing (eg, time between index test and reference standard). In addition, each study was evaluated for concerns of applicability regarding patient selection, index test, and reference standard. The interpretations are seen in Supplementary Table 1.
Classification of Pneumonia
We included studies that stratified data based on presumptive or proven etiologic diagnoses of viral, bacterial, or atypical infection. Patients coinfected with bacteria and viruses and those infected with so-called atypical agents (Legionella, Chlamydia, Mycoplasma, or Coxiella) were included with bacterial pneumonia.
Data Analysis
A meta-analysis of sensitivity and specificity was conducted with a bivariate random-effects model allowing for heterogeneity among studies. Summary statistics with 95% confidence intervals (CIs) were obtained for sensitivity and specificity. A hierarchical summary receiver operating characteristic (ROC) curve was plotted with a 95% confidence contour and area under the curve (AUC) [33]. Forest plots were constructed to demonstrate study sensitivity and specificity [34]. Heterogeneity among studies was assessed using the I2 test. Scores above 50% indicate moderate heterogeneity [35]. The Deeks funnel plot was used to assess for bias [36]. All data analyses were performed with Stata version 15 (StataCorp) using the user written command MIDAS (MIDAS: Stata module for meta-analytical integration of diagnostic test accuracy studies. Statistical Software Components).
RESULTS
Table 1 shows the characteristics of 12 studies, totaling 2408 patients, that met our criteria for inclusion in this meta-analysis. Studies were classified as observational cohort or case-control studies; these studies were further characterized as prospective or retrospective. Four papers included only patients who were receiving intensive care unit level of care; the remaining studies included all patients who were hospitalized for CAP, except for 1 study that included patients who had pneumonia together with acute exacerbation of chronic obstructive pulmonary disease.
Studies Included in the Present Meta-analysis
| First Author, Year [Reference] | Study Type | Subjects, N | Procalcitonin Cutoff, µg/L | Sensitivity | Specificity |
|---|---|---|---|---|---|
| Masiá, 2005a,b [27] | Prospective cohort | 104 | 0.5 | 0.101 | 0.867 |
| Hirakata, 2008a,b [24] | Prospective cohort | 88 | 0.5 | 0.450 | 0.750 |
| Daubin, 2009c [23] | Prospective cohort | 15 | 0.5 | 0.692 | 0.500 |
| Ingram, 2009c [25] | Retrospective cohort | 25 | 0.8 | 1.000 | 0.625 |
| Cuquemelle, 2010c [22] | Retrospective cohort | 52 | 1.5 | 0.895 | 0.667 |
| Ahn, 2011a [21] | Retrospective cohort | 60 | 0.8 | 0.563 | 0.841 |
| Kasamatsu, 2011a [26] | Prospective cohort | 116 | 0.5 | 0.398 | 1.000 |
| Song, 2011a [31] | Retrospective case control | 54 | 0.35 | 0.800 | 0.667 |
| Menéndez, 2012a [28] | Prospective cohort | 236 | 0.5 | 0.691 | 0.889 |
| Musher, 2013a [5] | Prospective cohort | 102 | 0.5 | 0.617 | 0.833 |
| Rodríguez, 2015c [29] | Prospective cohort | 972 | 0.5 | 0.781 | 0.465 |
| Self, 2017a [30] | Prospective cohort | 582 | 0.5 | 0.692 | 0.731 |
aPatients in a hospitalized setting.
bPatients in an outpatient setting.
cPatients in an intensive care unit setting.
Published studies used different threshold levels of serum procalcitonin to distinguish bacterial from nonbacterial causes of CAP. Eight papers presented data on multiple procalcitonin levels; several used ROC analysis to justify a cutoff point. The cutoff point that appeared to be most relevant was 0.5 µg/L, which is the one we used in this analysis. In papers that did not present data for a procalcitonin level of 0.5 µg/L, we used the closest value available, ranging from 0.35 µg/L to 1.5 µg/L.
From the 8 studies using the procalcitonin cutoff of 0.5 µg/L, the pooled sensitivity and specificity estimates are 0.55 (95% CI, 0.37–0.71; I2 = 95.5%) and 0.76 (95% CI, 0.62–0.86; I2 = 94.1%), respectively (Figure 2). The hierarchical summary ROC curve has an AUC of 0.73 (95% CI, 0.69–0.76), which is a moderate result (Figure 3). Forest plots for sensitivity and specificity (Figure 2) suggest substantial variability among individual studies. In general, studies showing the greatest sensitivity showed the lowest specificity and vice versa. The Deeks funnel plot (Figure 4) is symmetric, showing that bias and systematic heterogeneity were not significant (P = .94).
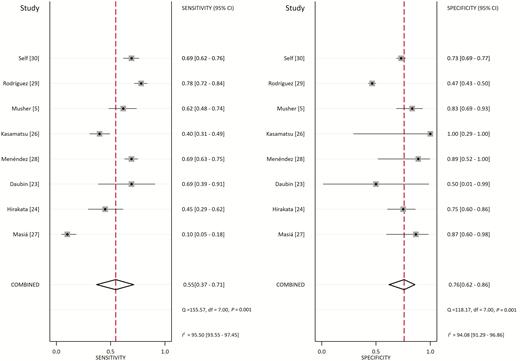
Forest Plot for Sensitivity and Specificity with 95% CI. Pooled sensitivity is 0.55 (95% CI: .37–.71) and pooled specificity is 0.76 (95% CI: .62–.86). Abbreviations: CI, confidence interval; df, degrees of freedom; I2, I2 index; p, p value; Q, Q statistic.
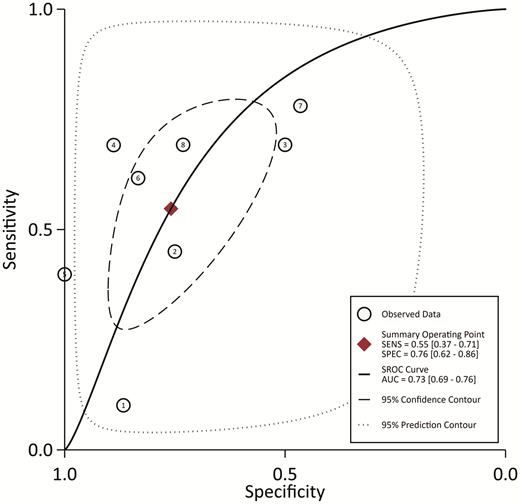
Hierarchical SROC. The AUC is 0.73 (95% CI: .69–.76), showing moderate diagnostic power for serum procalcitonin. Abbreviations: AUC, area under the curve; SENS, sensitivity; SPEC, specificity; SROC, summary receiver-operating characteristic.
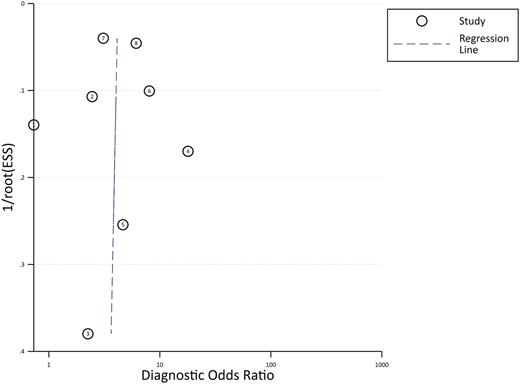
Deeks’ Funnel Plot Asymmetry Test. The plot is symmetric, showing bias and heterogeneity were not significant. Abbreviations: ESS, effective sample size.
DISCUSSION
The present meta-analysis suggests that, in managing CAP, an infection of broad and diverse etiology, a serum procalcitonin level is unlikely to provide information that will enable clinicians to immediately address whether the infection is bacterial and antibiotics need to be administered or whether it is viral and antibiotics may be withheld. The sensitivity and specificity are both too low and variable for the results to be confidently used in the decision-making process. Although, for the sake of simplicity, we selected a single procalcitonin level of 0.5 µg/L as a threshold for presenting our results, the use of other cutoff points in individual papers did not seem to change this conclusion (data not shown); as expected, lower cutoff points generally increased sensitivity but decreased specificity, and vice versa for higher cutoff points.
Several investigators have reported that serial procalcitonin measurements might help determine the duration of antibiotic therapy [37, 38]. With an overall sensitivity of 55% for detecting bacterial infection, it is difficult to understand how a procalcitonin level would augment clinical judgment or change adherence to generally recommended treatment schedules in order to shorten duration of antibiotic therapy. In fact, a randomized trial in 1656 patients showed that physicians who were provided real-time results of procalcitonin assays did not alter their prescribing patterns when compared with physicians who did not have these results [38].
In our analysis, we excluded papers that did not clearly separate patients with bacterial from those with nonbacterial infections. We also did not include papers that commingled data from patients with CAP with those who had asthma, bronchitis, or “respiratory infections,” although we did include a study of acute exacerbation of chronic obstructive pulmonary disease from which we could clearly abstract bacteriologic as well as specificity and sensitivity data on patients who also had pneumonia. We included patients who were coinfected with a bacterium and a virus in the bacterial group, since these individuals would require antibiotic treatment. Similarly, regarding patients with so-called atypical pneumonia, which might be due to Mycoplasma, Chlamydia, or Legionella, we grouped the reported results as bacterial infections since these individuals would also respond to guidelines-directed antibiotic therapy.
Limitations
There are, of course, limitations to this kind of meta-analysis. First, it is not possible to exclude publication bias [39]. Second, our exclusion criteria may have led us to disregard studies that might have been valid. Furthermore, we could not identify patients with conditions that may independently confound procalcitonin levels. Third, most of the initial procalcitonin-guided therapy trials took place in Europe, where the proportion of CAP caused by Streptococcus pneumoniae substantially exceeds that in the United States [40], and the generalizability of the results to the US population is unclear [38]. Additionally, even though the Deeks funnel plot does not suggest heterogeneity, this possibility cannot be excluded due to diversity in geographic location and patient population. Finally, another limitation lies in the fact that establishing the etiology of CAP is difficult. If the etiological diagnostics yield unreliable results in the studies included in this meta-analysis, the resulting sensitivities and specificities of procalcitonin will not reflect the true performance of the test. Thus, future research on this topic should be directed at prospective trials on the diagnostic ability of procalcitonin in cases in which the etiology has been determined, but this will prove to be very difficult for the reasons stated. The problem inherent in this approach is that, because of the difficulties in determining the etiology of CAP, the number of patients that can be included will be severely restricted, and one will not know how representative that population might be.
Supplementary Data
Supplementary materials are available at Clinical Infectious Diseases online. Consisting of data provided by the authors to benefit the reader, the posted materials are not copyedited and are the sole responsibility of the authors, so questions or comments should be addressed to the corresponding author.
Notes
Acknowledgments. The authors thank Dr Andre Kalil for his guidance in conducting statistical analyses.
Potential conflicts of interest. The authors: No reported conflicts of interest. All authors have submitted the ICMJE Form for Disclosure of Potential Conflicts of Interest. Conflicts that the editors consider relevant to the content of the manuscript have been disclosed.
References
US Food and Drug Administration. FDA News Release.


Comments