


Abstract
Foods prone to deteriorate renal function are rich in fat and in phosphorus (P), but the interaction between these two factors is not well studied.
Detailed structural and ultrastructural histopathological studies were performed on the kidneys of rats fed different amounts of fat and P: low (4%) fat (LF) and normal (0.6%) P (NP), LF and high (1.2%) P (HP), high (35%) fat (HF) and NP, HF and HP, and HF with low (0.2%) P (LP) for 28 weeks.
Glomeruli of the HF groups showed segmental areas of retraction, sclerosis and thickening of the Bowman’s capsule and basal membranes, which were more accentuated in the HF–HP group. Ultrastructural lesions in the glomeruli also were prominent in rats fed HF, particularly in the HF–HP group, and included thickening of the capillary membrane, endothelial damage, mesangial matrix hypercellularity and podocyte effacement. P restriction reduced the severity of endothelial damage, mesangial matrix hypercellularity, thickening of capillary basement membrane and podocyte effacement. The kidneys of rats fed HP showed significant tubular atrophy and dilatation, focal tubular hyperplasia, thickening of the tubular basal membrane, interstitial edema, inflammation and calcification. All groups fed HF also showed tubular lesions that were more prominent in the HF–HP group. P restriction had a beneficial effect on inflammation and calcification.
Intake of both HF and HP damages the kidneys and their noxious effects are additive. HF intake was preferentially associated with glomerular lesions, while lesions related to HP intake were located mainly in the tubuli and in the interstitium.
INTRODUCTION
Frequent intake of energy-dense foods in Western-style diets is the main cause of obesity and its related complications, including renal disease. In addition to their high-fat (HF) content, energy-dense foods usually have a high-phosphorus (P) concentration because P is an additive commonly used in food processing [1, 2]. The inorganic P added to processed foods is more readily absorbed by the intestine than the organic P naturally present in foodstuffs [3]. Moreover, the HF content of many processed foods also enhances intestinal P absorption [4]. Furthermore, energy-dense foods are often accompanied by seasonings and soft drinks containing a high amount of easily absorbable inorganic P [5]. Therefore, individuals eating Western-style diets ingest excessive quantities of both fat and P.
High caloric intake leads to obesity and Type II diabetes, which are associated with renal disease [6]. Obesity may influence the progression of chronic kidney disease due to its direct effects on renal hemodynamics, hyperfiltration, increased glomerular pressure and podocyte damage [7, 8]. Type II diabetes causes renal disease secondary to microvascular changes within the kidney and metabolic abnormalities leading to thickening of the glomerular basement membrane, expansion of the mesangial matrix, nodular glomerulosclerosis, arteriolar hyalinosis, endothelial dysfunction and podocyte injury [9]. In addition to their indirect effects, diets with HF content have also been reported to damage the kidney in nonobese animals that did not develop Type II diabetes, suggesting a direct effect of HF intake on the kidney [10]. Podocyte injury secondary to inflammasome activation [11] and down-regulation of the Sirt 1–adiponectin axis [12] have been implicated in HF diet nephrotoxicity. HF intake is also known to alter the expression of genes related to cytoskeleton remodeling, fibrosis and hypoxia [13]. Moreover, a HF diet has been reported to decrease renal klotho expression in apolipoprotein E knockout mice [14] and in Wistar rats [15].
Elevated P intake is also a well-known cause of kidney deterioration. Renotoxicity of P augments as functional renal mass is reduced [16], because the tubular load of P increases with the reduction of functioning nephrons. Therefore, P binding ameliorates renal injury [17]. In humans and in experimental animals, high P intake increases phosphaturia and provokes oxidative damage and inflammation in the kidneys [18]. High P concentrations are toxic and proapoptotic to renal tubular cells [19, 20]. In addition, mineral deposition secondary to high P intake also damages the kidneys [21].
Although foods prone to deteriorate renal function are often rich in fat and in P, the effect of the interaction between these two factors on the kidneys is not well studied. Moreover, the renal effect of fat or P has been assessed mostly in short-term experimental protocols. The aim of this study was to evaluate the consequences of feeding HF and HP diets, alone or in combination, on the kidneys. To this effect, detailed structural and ultrastructural histopathological studies were performed on the kidneys of rats that had been fed on these diets for a prolonged time (28 weeks). In addition, the influence of restricting P intake in rats fed a HF diet was also studied.
MATERIALS AND METHODS
Ethics
All experimental protocols were reviewed and approved by the Ethics Committee for Animal Research of the University of Cordoba (Cordoba, Spain). All protocols were carried out in accordance with the approved guidelines. They followed the guiding principle laid down by the Higher Council of Scientific Research of Spain following the normal procedures directing animal welfare (Real Decreto 223/88, of 18 March) and adhered to the recommendations included in the Guide for Care and Use of Laboratory Animals (US Department of Health and Human Services, National Institutes of Health) and European laws and regulations on the protection of animals (Directive 2010/63/EU of the European Parliament), under the advice of specialized personnel.
Animals and diets
Forty Wistar rats, provided by the Animal Housing Facilities of the University of Cordoba (Cordoba, Spain), were housed with a 12 h/12 h light/dark cycle. Only female rats were used in order to minimize data variability associated with the influence of sexual dimorphism on the progression of renal disease. The rats were 2 months old at the beginning of the experiments. Appropriate measures were taken to ensure animal welfare and to address the basic behavioral and physiological needs of rats.
Two diets with low fat (LF) content (4% fat, 20% reduction in fat content when compared with standard rat chow, which contains 5% fat) that provided Metabolizable Energy = 3518 kcal/kg (Altromin C 1090-10, AltrominSpezialfutter GmbH, Germany) were used in the experiments. One of these diets contained normal (0.6%) P concentration (LF–NP) and the other contained high (1.2%) P concentration (LF–HP). Three diets with HF content (35% fat) that provided Metabolizable Energy = 5241 kcal/kg (Altromin C 1090-60, AltrominSpezialfutter GmbH, Germany) were also used. These diets contained either normal (0.6%) P (HF–NP), high (1.2%) P (HF–HP) or low (0.2%) P (HF–LP). All diets contained 0.6% of calcium and 500 IU/g of vitamin D.
Experimental design
Rats were randomly allotted to five groups (n = 8 each) that were fed ad libitum the study diets for 28 weeks. Rats in Group 1 were fed LF–NP, rats in Group 2 were fed LF–HP, rats in Group 3 were fed HF–NP, rats in Group 4 were fed HF–HP and rats in Group 5 were fed HF–LP. At the end of the experiment, rats were sacrificed by exsanguination under general anesthesia (inhaled sevoflurane) to obtain blood and tissue samples.
Blood chemistries
Blood was collected from the abdominal aorta at the time of sacrifice. Blood glucose concentration was measured immediately after collection using a glucose meter (Bayer Consumer Care AG, Basel, Switzerland). Then plasma was separated by centrifugation and stored at –20°C until assayed. Plasma concentrations of cholesterol, triglycerides, urea, creatinine and P were measured by spectrophotometry (BioSystems SA, Barcelona, Spain). Enzyme linked immunosorbent assay tests were used to quantify plasma insulin, leptin and adiponectin (EMD Millipore Corporation, MO, USA).
Tissue sampling
Both kidneys and visceral fat were collected immediately after sacrifice. The unperfused kidneys were weighed and then fixed for histology processing. Visceral fat was carefully removed from the abdomen by trimming all fat surrounding the intestine and, when present, by scraping the fat layer from the internal wall of the abdominal cavity. Subsequently, fat was weighed with a scale.
Renal histopathology
The tissues for light microscopy (LM) evaluation were immersion fixed in 10% buffered formalin, serially dehydrated, processed and embedded in paraffin. Tissues were serially sectioned five times at 3-mm thickness and stained with: (i) hematoxylin and eosin (HE), (ii) periodic acid–Schiff (PAS), (iii) Masson trichrome (TRI), (iv) Jones-methenamine silver (JMS) and (v) Von Kossa (VK). All histochemical procedures were performed using established routine methods of pathology laboratory. For ultrastructural analysis by transmission electron microscopy (TEM), tissues were fixed in 2.5% phosphate-buffered glutaraldehyde. Specimens were postfixed in 1% osmium tetroxide and serially dehydrated, infiltrated in an acetone/epoxy plastic and embedded in resin PolyBed 812 (Electron Microscopy Sciences, Fort Washington, PA, USA). Blocks were cut with an Ultracut R ultramicrotome (Leica Mycrosystems, Wetzlar, Germany). Thick sections (1 mm) were stained with toluidine blue. These sections were evaluated and appropriate areas identified for thin sectioning. Thin sections were cut at 80–100 nm and placed on copper 200 mesh grids. Grids were contrasted with uranyl acetate and lead citrate and examined with a JEOL 1400 transmission electron microscope, and digital photomicrographs were obtained. TEM was performed at the University of Cordoba (Cordoba, Spain) at Electron Microscopy Unit of University Research Central Services.
The LM lesions were evaluated in blind mode by counting 30 fields in 10–40× magnification and the lesions were graduated with a semi-quantitative scale of 0–3: 0 (absent), 1 (mild), 2 (moderate) and 3 (severe), or as a percentage (to count retracted glomeruli). Retracted glomeruli were identified by their characteristic pattern of shrinking and collapse of the tuft, more evident in PAS stain and by diminution or disappearance of the urinary space. For evaluation of glomerular retraction, a minimum of 100 glomeruli located in 20 randomly chosen fields was quantified identifying the percentage (%) of glomeruli that were retracted. Tubular hyperplasia was defined as epithelial cell proliferation (increase in the number of cells per area of the epithelial basement membrane) with focal crowding and piling up of cells and increased nuclear activity. Interstitial edema and inflammation were quantified by evaluating fluid accumulation in the interstitium and by the presence of inflammatory infiltrate.
Statistical analysis
Values are expressed as the mean ± standard error. The difference between means for two different groups was determined by t-test; the difference between means for three or more groups was assessed by analysis of variance. Fisher least significant difference test was used as a post hoc procedure. P < 0.05 was considered significant.
RESULTS
Nutritional and biochemical data
Fat intake was much lower in the LF groups, 0.66–0.69 g/day, than in the HF groups, 4.01–4.20 g/day. P intake ranged from 22.9 to 159.2 mg/day and changed in accordance with the P concentration of the diet but was not influenced by the fat content of the diet. During the 28 weeks of the experiment, rats experienced an increase in body weight that was more accentuated in the groups fed a HF diet, although the difference only was significant in the HF–NP group. Visceral fat mass was consistently more abundant, 24.0–30.8 g, in rats fed HF than in rats fed LF 12.5–15.4 g (Table 1).
Parameters related to nutritional intake, body weight and adiposity in rats (n = 8 per group) fed diets with LF–NP, LF–HP, HF–NP, HF–HP and HF–LP
| Parameters | LF–NP | LF–HP | HF–NP | HF–HP | HF–LP |
|---|---|---|---|---|---|
| Fat intake, g/day | 0.66 ± 0.01 | 0.69 ± 0.02 | 4.20 ± 0.08* | 4.15 ± 0.08* | 4.01 ± 0.07* |
| Energy from fat, % | 5.96 ± 0.12 | 6.20 ± 0.15 | 38.19 ± 0.79* | 37.64 ± 0.77* | 36.31 ± 0.64* |
| Phosphorus intake, mg/day | 74.4 ± 6.4 | 159.2 ± 9.4* | 77.9 ± 3.7 | 136.2 ± 8.8* | 22.9 ± 1.4* |
| Delta body weight, g | 73.8 ± 7.7 | 63.1 ± 6.8 | 100.2 ± 6.5* | 84.9 ± 6.0 | 91.8 ± 4.9 |
| Visceral fat weight, g | 15.4 ± 1.4 | 12.5 ± 1.0 | 30.8 ± 2.2* | 24.0 ± 2.1* | 24.6 ± 1.9* |
Food intake was measured weekly and the nutritional parameters were calculated based on diet composition. The reported values are the means of the weekly values obtained during the whole experiment (28 weeks).
Values are mean ± SE.
P < 0.05 versus LF–NP.
No significant changes in plasma concentrations of either glucose or insulin were detected between the experimental groups. Accordingly, the homeostatic model assessment of insulin resistance (HOMA-IR) index did not show significant intergroup differences. Plasma triglycerides were higher in HF–NP group, 83.1 ± 11.4 mg/dL, than in the LF–NP group, 51.7 ± 10.1 mg/dL. Groups fed HP tended to have lower triglycerides than groups fed NP, and significant differences were found between HF–NP and HF–HP. Feeding HF did not modify plasma cholesterol concentrations but HP significantly decreased plasma cholesterol in both LF and HF fed rats. Leptin values were higher in rats fed HF than in rats fed LF, and the differences were significant in the HF–NP and HF–LP groups. Plasma adiponectin concentrations were higher in rats fed LF than in rats fed HF, and significant differences were found for the LF–HP group (Table 2).
Plasma concentrations of parameters related to glucose and lipid metabolism in rats (n = 8 per group) fed diets with LF–NP, LF–HP, HF–NP, HF–HP and HF–LP
| Parameters | LF–NP | LF-HP | HF–NP | HF–HP | HF–LP |
|---|---|---|---|---|---|
| Glucose, mg/dL | 99.9 ± 4.9 | 93.8 ± 3.2 | 100.4 ± 6.1 | 103.6 ± 4.4 | 104.6 ± 3.3 |
| Insulin, ng/mL | 1.71 ± 0.57 | 0.89 ± 0.19 | 2.84 ± 1.02 | 1.96 ± 1.01 | 1.64 ± 0.36 |
| HOMA-IR index | 0.14 ± 0.03 | 0.07 ± 0.01 | 0.24 ± 0.09 | 0.17 ± 0.09 | 0.14 ± 0.03 |
| Triglycerides, mg/dL | 51.7 ± 10.1 | 35.3 ± 2.7 | 83.1 ± 11.4* | 39.6 ± 3.4** | 56.0 ± 5.2** |
| Cholesterol, mg/dL | 48.3 ± 0.1 | 33.5 ± 2.5* | 49.4 ± 6.1 | 37.9 ± 6.2* | 53.0 ± 5.3 |
| Leptin, ng/mL | 3.91 ± 0.49 | 3.15 ± 0.25 | 5.25 ± 0.79* | 4.14 ± 0.47 | 5.78 ± 0.53* |
| Adiponectin, ng/mL | 7.91 ± 1.02 | 11.6 ± 1.47*,** | 5.67 ± 0.52 | 7.70 ± 0.82 | 6.42 ± 1.09 |
Values are mean ± SE.
P < 0.05 versus LF–NP, **P < 0.05 versus HF–NP.
Renal weight corrected by body weight (ratio kidney/body weight × 100) was increased by HP in rats fed LF, 0.33 ± 0.01 versus 0.29 ± 0.01. A HF diet did not modify renal weight except in the group fed HF–HP (0.37 ± 0.01, P < 0.05 versus LF–NP). Plasma creatinine concentrations tended to be higher in the HF groups but were significantly increased only in the HF–HP group (0.83 ± 0.03 versus 0.73 ± 0.05 mg/dL in the LF–NP group). Plasma urea also was higher in the HF groups than in the LF groups but significant differences were observed only between LF–NP and HF–HP rats (18.9 ± 1.5 versus 29.5 ± 2.9 mg/dL, P < 0.05). No major changes were observed in plasma P concentrations, although they were lower in the HF–NP and in the HF–LP groups when compared with the LF–NP rats (Table 3).
Parameters related to renal function in rats (n = 8 per group) fed diets with LF–NP, LF–HP, HF–NP, HF–HP and HF–LP
| Parameters | LF–NP | LF–HP | HF–NP | HF–HP | HF–LP |
|---|---|---|---|---|---|
| Kidney/body weight × 100 | 0.29 ± 0.01 | 0.33 ± 0.01* | 0.29 ± 0.01 | 0.37 ± 0.01*,** | 0.30 ± 0.01 |
| Plasma creatinine, mg/dL | 0.73 ± 0.05 | 0.73 ± 0.01 | 0.77 ± 0.01 | 0.83 ± 0.03*,*** | 0.81 ± 0.02 |
| Plasma urea, mg/dL | 18.9 ± 1.5 | 20.1 ± 3.6 | 23.2 ± 1.8 | 29.5 ± 2.9* | 25.8 ± 2.1 |
| Plasma phosphorus, mg/dL | 3.78 ± 0.21 | 3.86 ± 0.26 | 3.15 ± 0.22*,*** | 4.02 ± 0.11** | 3.23 ± 0.23*** |
Values are mean ± SE.
P < 0.05 versus LF–NP, **P < 0.05 versus HF–NP, ***P < 0.05 versus LF–HP.
Renal histopathology
Histopathological findings will be presented in two sections: glomerular lesions and tubular/interstitial lesions.
Glomerular lesions
When compared with the LF–NP group, glomerular retraction significantly increased in the LF–HP group, 15.0 ± 1.5 versus 10.0 ± 1.3%, and in all HF groups (16.9–38.5%). High P also increased glomerular retraction in HF groups, 38.5 ± 1.7 versus 16.9 ± 1.3%, but P restriction did not alleviate glomerular retraction. Glomeruli of the HF groups showed segmental areas of decreased size, retraction and thickening of the basal membrane of the Bowman’s capsule and the capillaries. Glomerular sclerosis was only evident in the HF groups and was more accentuated in the HF–HP group, 1.75 ± 0.16 versus 0.50 ± 019 in the HF–NP group (Table 4 and Figure 1).
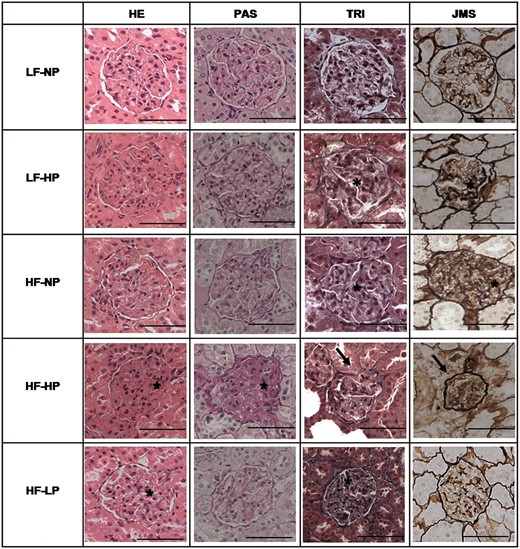
Glomerular lesions in kidney samples stained with HE, PAS reagent, TRI and JMS in rats fed diets with LF–NP, LF–HP, HF–NP, HF–HP and HF–LP. InLM, the group LF–NP did not show evident glomerular changes. Increased percentage of retracted glomeruli (asterisks) was observed in LF–HP and the HF groups, with a decrease in the urinary space, obliteration of capillary loops and thickening of the basal membrane. Glomerular sclerosis (arrow), with a marked reduction in glomerular size, retraction of capillary loops, mesangial expansion and thickening of Bowman’s capsule and basal membrane, was more severe in the HF–HP group. Scale bar: 50 µm.
Histopathological score (scale 0–3) of renal lesions observed by LM in the kidneys of rats (n = 8 per group) fed diets with LF–NP, LF–HP, HF–NP, HF–HP and HF–LP
| Renal lesions (LM) | LF–NP | LF–HP | HF–NP | HF–HP | HF–LP |
|---|---|---|---|---|---|
| Glomerular retraction, % | 10.0 ± 1.3 | 15.0 ± 1.5* | 16.9 ± 1.3* | 38.5 ± 1.7*,**,*** | 18.1 ± 1.6* |
| Glomerular sclerosis | 0 | 0 | 0.50 ± 0.19*,*** | 1.75 ± 0.16*,**,*** | 0.88 ± 0.13*,*** |
| Tubular dilatation | 0.75 ± 0.16 | 1.86 ± 0.14* | 1.25 ± 0.16*** | 2.25 ± 0.25*,** | 1.25 ± 0.16*** |
| Tubular atrophy | 0.13 ± 0.13 | 1.57 ± 0.20*,** | 1.0 ± 0*,*** | 1.75 ± 0.16*,** | 0.75 ± 0.25*,*** |
| Tubular hyperplasia | 0.13 ± 0.13 | 1.14 ± 0.14* | 1.0 ± 0* | 1.25 ± 0.16* | 0.50 ± 0.19**,*** |
| Basal membrane thickening (glomeruli and tubules) | 0 | 1.14 ± 0.14* | 1.5 ± 0.19* | 1.88 ± 0.13*,*** | 1.50 ± 0.19* |
| Interstitial edema/inflammation | 0.25 ± 0.06 | 0.99 ± 0.25* | 0.97 ± 0.24* | 1.43 ± 0.18*,** | 0.53 ± 0.21**,*** |
| Interstitial fibrosis | 0 | 1.71 ± 0.18* | 0.88 ± 0.23*,*** | 2.25 ± 0.25*,** | 0.75 ± 0.16*,*** |
| Calcification | 0 | 1.57 ± 0.20*,** | 0 | 2.25 ± 0.25*,**,*** | 0 |
Values are mean ± SE.
P < 0.05 versus LF-NP, **P < 0.05 versus HF–NP, ***P < 0.05 versus LF–HP.
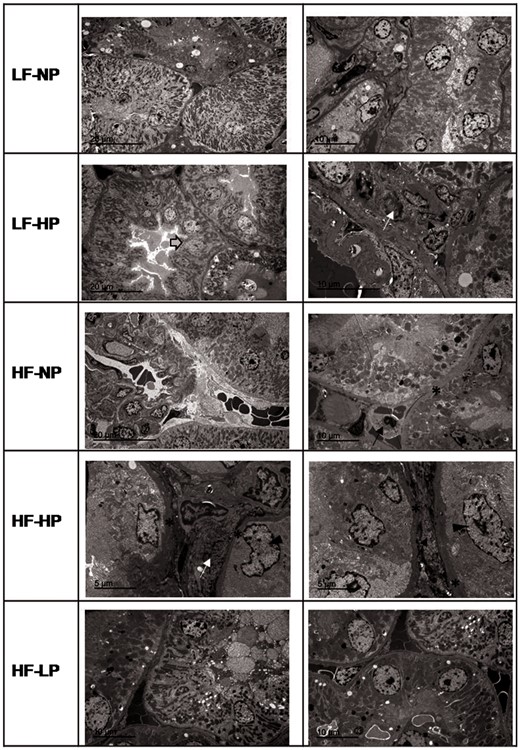
Ultrastructural lesions detected by TEM in the glomeruli included thickening of the capillary membrane, endothelial damage, mesangial matrix hypercellularity and podocyte fusion. All these lesions were more prominent in rats fed HF, particularly in the HF–HP group. P restriction in the HF–LP group reduced the severity of endothelial damage, mesangial matrix hypercellularity, thickening of capillary basement membrane and podocyte fusion. In addition to the HF groups, podocyte hyperplasia was also significant in rats fed LF–HP (Figure 2).
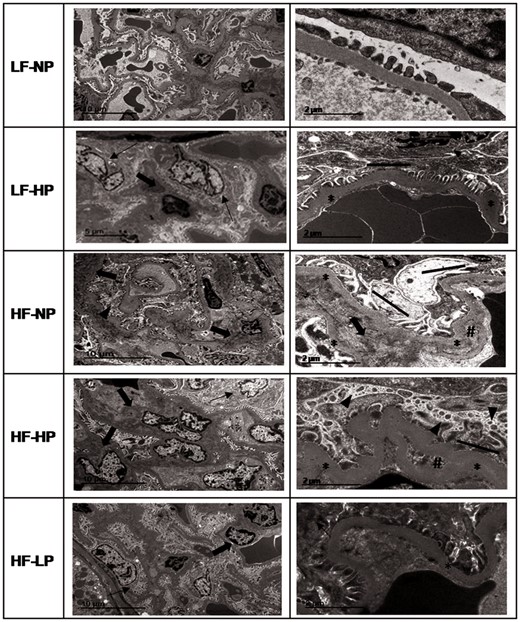
Glomerular lesions observed by TEM in rats fed diets with LF–NP, LF–HP, HF–NP, HF–HP and HF–LP. In ultrastructure, changes like podocyte hypertrophy (thin arrow), focal podocyte injury: fractional foot process effacement (solid line) and microvillus transformation (arrow head), increased mesangial matrix (arrow), glomerular basement membrane thickening (asterisks) and capillary remodeling identified as double contours (hash) were more evident in the HF and HP groups.
Tubular and interstitial lesions
The kidneys of the LF–HP group showed significant tubular atrophy with dilatation, focal tubular hyperplasia and thickening of the basal membrane. In general, all these lesions were more accentuated in the LF–HP group than in the HF–NP group, and in the case of tubular atrophy the differences were statistically significant. All groups fed HF also showed tubular lesions, mainly tubular dilation and tubular atrophy, which were more prominent in the HF–HP group. P restriction attenuated tubular lesions but a significant difference between HF–LP and HF–NP was only observed in tubular hyperplasia. Feeding LF–HP resulted in significant interstitial edema and focal inflammation similar to the lesions found in the HF–NP group. Interstitial edema and inflammation were more marked in the HF–HP group. P restriction (HF–LP group) significantly decreased inflammation. Fibrosis was also prominent in the LF–HP group (1.71 ± 0.18), and was potentiated in the HF–HP group (2.25 ± 0.25). P restriction in the HF–LP group did not decrease fibrosis when compared with the HF–NP group (0.75 ± 0.16 versus 0.88 ± 0.23). Finally, calcification was only evident in the HP groups and was more severe in rats fed HF–HP(2.25 ± 0.25) than in rats fed LF–HP (1.57 ± 0.20) (Table 4 and Figure 3).
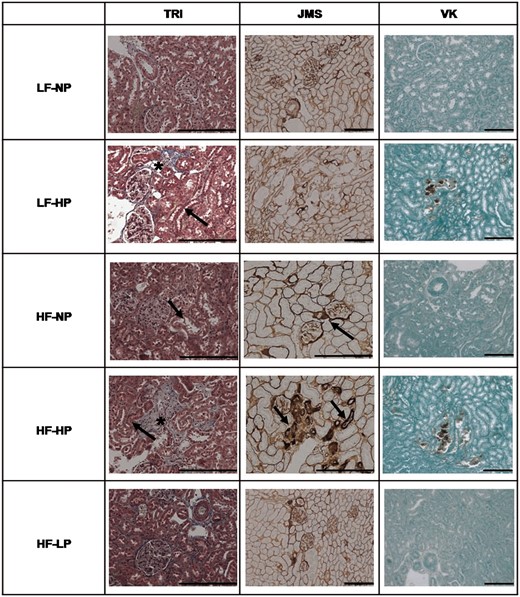
Tubular and interstitial lesions in kidney samples stained with TRI, JMS and VK staining in rats fed diets with LF–NP, LF–HP, HF–NP, HF–HP and HF–LP. No lesions were observed in kidneys of LF–NP rats. In HF and HP, mild nephropathy (arrow) with tubular hyperplasia, tubular atrophy and thickening of the basal membrane was observed. Mineral deposits were observed only in HP groups and they were depicted by brown color in VK stain. Interstitial fibrosis (asterisks) was more evident in HP groups than in the NP and LP groups. Scale bar: 200 µm.
Significant tubular lesions were also detected by TEM. These lesions, which included epithelial cell hypertrophy and thickening of the basal membrane, were present in the HF groups and in the LF–HP group. Within the HF groups, tubular damage was magnified by HP diet and attenuated by LP diet. Interstitial lesions, mainly fibrosis, edema and focal inflammation, were also evident by TEM and followed a similar pattern as described above (Figure 4).
Tubular and interstitial lesions observed by TEM in rats fed diets with LF–NP, LF–HP, HF–NP, HF–HP and HF–LP. In ultrastructure, the HF and HP groups showed focal tubular changes. Tubules with thickened basal membrane (asterisks), tubular hypertrophy (arrow head), hyperplasia (grey arrow), focal collagen deposits and inflammatory cells (arrow) were observed.
DISCUSSION
This study was designed to investigate the independent and combined effects of HF and HP intake on renal histopathology. A secondary objective was to determine whether P restriction could alleviate the deleterious effect of HF intake. Our results demonstrate that prolonged (28 weeks) intake of both HF and HP damages the kidneys and that the noxious effect of HF and HP is additive. HF intake was preferentially associated with glomerular lesions while lesions related to HP intake were located mainly in the tubuli and in the interstitium. P restriction in rats fed HF did not eliminate the detrimental effect of HF on the kidney but reduced some glomerular and tubulointerstitial lesions.
The deleterious consequences of HF intake for human health are widely known by both the medical community and the general population. However, HP intake is not considered a significant danger for health except in the case of renal patients [5]. P content is high and readily available in many processed foods; thus, there is growing evidence that Western diets provide excessive P intake and that this may be harmful even in individuals with normal renal function [22]. Although there have been many previous studies on the effect of HF diet on the kidneys, the effect of HP on the kidneys of individuals with normal renal function has been sparsely studied. Moreover, the interaction of HF and HP is not well known and it is also unclear whether reducing the P content of the diet could prevent the negative effects of HF feeding.
The effects of high-calorie intake on the kidneys are mainly secondary to the development of obesity and Type II diabetes, both of which are well-known causes of renal disease [6, 9]. In our experimental model, rats showed no evidence of insulin dysregulation based on plasma glucose and insulin concentrations. Feeding an HF diet only resulted in minor changes in body weight; thus, obesity by itself should not be a major factor in the development of the renal lesions observed in this study. The rats fed HF showed moderate adiposity and some changes in blood lipids and in the adipokine profile, which may have contributed to the direct effect of HF feeding on the kidneys [23].
HF intake was associated preferentially with severe glomerular lesions and the combination of HF and HP aggravated glomerular damage. Some degree of glomerular retraction was present in the control group (LF–LP). This is not surprising since glomerular retraction has been previously reported to be a common feature of the kidney in rodents that is associated with normal aging [24]. Although P restriction in rats fed HF ameliorated some ultrastructural lesions in the glomeruli (e.g. mesangial matrix hypercellularity), it did not influence glomerular retraction or glomerular sclerosis. This is in line with previous data showing that the P restriction is not able to normalize some of the changes induced by HF, like an increase in fibroblast growth factor 23 and a decrease in renal klotho expression [10].
Even though both HF and HP resulted in significant tubular lesions and their effect was potentiated in combination, tubular dilation, atrophy and hyperplasia were more severe in rats fed HP than in rats fed HF. The preferential location of P-induced lesions in the tubuli would be in agreement with previous studies that have linked a high concentration of P in the tubule with progression of renal disease [18]. High P also played a major role in the development of interstitial edema, inflammation and fibrosis, and P restriction was able to ameliorate edema/inflammation but not fibrosis in rats fed HF.
Calcification was only present in rats fed HP, thus highlighting that elevated P is necessary for the development of nephrocalcinosis [21]. However, HF–HP diet aggravated mineral deposition in the kidneys, probably because of the combined effects of inflammation and mineral disturbance.
Analysis of the interaction of HF and HP diets on the kidney is of particular interest because, although HP diets are believed to damage the kidney, they have also been reported to improve the blood lipid and adipokine profile [25, 26]. Amelioration of dyslipidemia could prevent renal lipid accumulation [23] and this would counteract some of the deleterious effects of HF feeding. Also, the increase in adiponectin in HP groups may protect against renal injury [27]. In this study, HP intake tended to improve the lipid and adipokine profile in rats fed HF, but did not reduce renal lesions. This finding would support the contention that the moderate changes in lipids and adipokines found in our study after HF feeding do not play a major role in the development of renal lesions.
In fact, what we found was a synergistic deleterious effect of HF and HP intake on the kidneys. This additive effect is of great interest since, as previously commented, Western-style diets tend to be high in both fat and P. The synergistic action of HF and HP may be explained by potentiation of inflammation and oxidative stress induced by both factors [18, 28]. Interestingly, P restriction was able to prevent some of the lesions induced by HF intake, lending support to the hypothesis that both noxious agents, HF and HP diets, may share common pathophysiologic mechanisms.
The limitation of this study is the lack of male rats, which may differ in their response to dietary manipulations. Based on the literature on the influence of sexual dimorphism on progression of renal disease [29], male rats would be expected to develop more severe lesions in response to fat and P nephrotoxicity. Another limitation of the study is the lack of quantification of electron microscopy results.
In conclusion, the results of this study show that both HF and HP intake are deleterious to the kidney and have a synergistic action. However, they show a differential anatomic effect because HF promotes preferentially glomerular damage, while HP promotes preferentially tubular and interstitial damage and is necessary for calcification.
FUNDING
This research was supported by a Spanish Government Grant from the Instituto de Salud Carlos III, grant number PI17/00169, with co-financing from European Funds.
AUTHORS’ CONTRIBUTIONS
E.A.-T. and I.L. conceived and designed the study. P.E., R.R., A.I.R. and C.P. performed experiments. P.E., E.A.-T. and A.I.R. analyzed data. P.E., M.R., E.A.-T. and I.L. drafted the manuscript. All authors reviewed and provided comments on the article and approved the final version. E.A.-T. is the guarantor of the article.
CONFLICT OF INTEREST STATEMENT
The authors declare no conflict of interest. Part of the data of the present paper was presented in poster format at the ASN Kidney Week 2017 Annual Meeting, 31 October to 5 November in New Orleans, LA, USA.


Comments