


ABSTRACT
In animal models, the mammalian target of rapamycin inhibitors (mTORIs) may prevent atherogenesis by the regulation of homeostasis of cholesterol and by a reduced inflammatory response. The aim of this study is to compare the carotid intima–media thickness (cIMT) between de novo tacrolimus/mycophenolate and tacrolimus/sirolimus at low doses. The cIMT is considered a surrogate marker of atherosclerosis.
We evaluated cIMT at baseline and at 6 and 12 months after kidney transplantation in a database derived from a previously published trial. That trial had prospectively randomly assigned kidney transplant recipients older than 60 years of age to one of two groups: tacrolimus/sirolimus (n = 21) or tacrolimus/mycophenolate (n = 23). The cIMT was evaluated by using ultrasound in the common carotid artery wall on both sides.
The total and high-density lipoprotein cholesterol levels were higher in the sirolimus group at 6 and 12 months. The cIMT decreased over time at 6 and 12 months in the sirolimus group (P = 0.012); this decrease continued to be significant in a model adjusted for age, sex, presence of diabetes, statin use and smoking.
The use of sirolimus plus tacrolimus de novo in kidney transplantation is associated with a reduction in cIMT after 12 months, a decrease more significant than seen with the combination of mycophenolate plus tacrolimus. This suggests a class effect of mTORI in the prevention of atherosclerosis.
INTRODUCTION
The mammalian target of rapamycin inhibitors (mTORIs; sirolimus and everolimus) have been used in renal transplantation for the past 20 years [1]. Recently, studies of the combination of these agents with calcineurin inhibitors at low doses in de novo transplantation have shown clinical advantages, such as lower rates of cytomegalovirus (CMV) infections [2–4]. However, there are still doubts about the cardiovascular safety of mTORI. Some studies are favorable to mTORI and have shown reduction of left ventricular mass compared with patients not using mTORI [5, 6]. The negative effects are dyslipidemia, increased incidence of diabetes after transplantation and anemia caused by mTORI, which could increase cardiovascular risk [7]. However, many points need to be clarified regarding the hyperlipidemia caused by mTORI, which is a major risk factor for atherosclerosis.
In experimental models of atherosclerosis in mice, the administration of mTORI resulted in the reduction of aortic atherosclerosis independent of elevations in plasma cholesterol levels [8, 9]. This suggests that mTORI could prevent atherogenesis by the regulation of homeostasis of cholesterol and by a reduced inflammatory response [10]. The primary effect is reduced accumulation of cholesterol in the artery wall [11] due to decreased expression of lipoprotein receptors and reduced monocyte chemotaxis to the atherosclerotic plaque [12]. However, few clinical trials show a reduction of atherosclerosis with the use of mTORI [13]. The aim of this study was to evaluate the carotid intima–media thickness (cIMT) in a prospective trial that compared de novo tacrolimus plus mycophenolate and tacrolimus plus sirolimus at low doses.
MATERIALS AND METHODS
Study design
This article evaluated the repeated measures of cIMT at baseline and at 6 and 12 months after kidney transplantation. Data from this study were derived from the database of a previously published trial [4]. Briefly, this single-center, prospective, 12-month randomized controlled trial included patients older than age 60 years and sought to compare mTORI plus tacrolimus in elderly renal transplant patients in terms of safety and incidence of CMV infection. The protocol was reviewed and approved by the Institutional Review Board, and written informed consent was obtained from the patients before participation. The study was registered on ClinicalTrials.gov (NCT02683291). Eligible patients were randomly assigned (1:1) before surgery to one of the two treatment regimens.
Treatments
The sirolimus group received tacrolimus (starting with 0.1 mg/kg twice daily adjusted to target serum levels of 4–8 ng/mL at the 3rd month and then 3–7 ng/mL from the 3rd to 12th month) and sirolimus 2 mg/day (adjusted serum levels to 4–8 ng/mL throughout the study period).
The mycophenolate (control) group was given tacrolimus (starting with 0.1 mg/kg twice daily adjusted to target serum levels of 4–8 ng/mL at the 3rd month and then 3–7 ng/mL from the 3rd to 12th month) and mycophenolate sodium 720 mg twice daily. In both groups the immunosuppressors were initiated in the day after the transplant.
All patients in both groups received prednisone 30 mg/day induction therapy, consisting of basiliximab or antithymocyte globulin (Thymoglobulin, Genzyme). Antithymocyte globulin was used in patients with panel reactivity class I > 50%. The flow chart of study is represented in Figure 1.
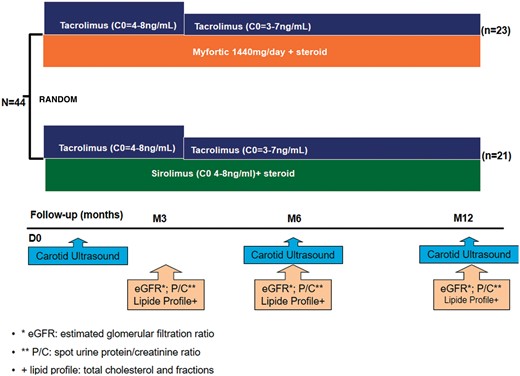
Flow chart diagram of study design.
Variables and measures
We evaluated estimated glomerular filtration ratio (eGFR) by using the Modification of Diet in Renal Disease equation, spot urine protein/creatinine ratio, new-onset diabetes after transplantation (NODAT), mean arterial pressure and lipid profiles (total cholesterol and fractions). These measures were taken at 3, 6 and 12 months after transplantation. We evaluated the use of statins at baseline and at the end of study, the use of angiotensin-converting enzyme inhibitor (ACEi) and angiotensin II receptor antagonists (ARA-II). The NODAT was defined by glucose levels >200 mg/dL after 2 h of oral glucose tolerance test.
Evaluated endpoint
We evaluated the cIMT at baseline and at 6 and 12 months in all patients. All ultrasound measurements were of the common and internal carotid artery walls and were performed by using a GE Vivid I device with 7-MHz linear array transducer. The images obtained were evaluated according to the Mannheim Carotid Intima–Media Thickness Consensus (2004–06) [14]. The cIMT was measured from multiple segments of the posterior wall of both sides of the common carotid artery at 1 cm before the bifurcation in the longitudinal view. With use of computer software, the mean value, maximum and SD of cIMT were calculated. For the analysis, the dependent variable was the mean of cIMT on both sides. All measures were evaluated by a single researcher, who was blinded to the groups.
Statistics
Continuous variables are presented as mean and SD and categorical variables are presented as frequencies and percentages. A t-test or the Mann–Whitney test was used for the analysis of continuous variables where appropriate. For categorical variables, the chi-square test or Fisher’s exact test was used where appropriate.
We used a mixed linear model with normal distribution for the analysis of repeated measures of eGFR, proteinuria and cholesterol. The group and time of observation were considered as fixed factors.
First, for cIMT analysis, we considered the mean difference between the last and the first observations (12 months and baseline); comparisons were made between the groups with the Mann–Whitney test. Second, to assess the variation of the cIMT over time, we used the generalized mixed model. This analysis considers the repeated measures and the covariance structure. Because cIMT has non-normal distribution, the model was adjusted with the gamma distribution with logarithmic link. For the repeated measurements, the diagonal covariance structure was used. As fixed effects we used the group (mycophenolate or sirolimus) and the time of the evaluation (baseline, 6 months and 12 months). In an additional analysis to adjust for confounding variables, we added as fixed effects age, sex, presence of diabetes, smoking, use of statins, use of ACEi or ARA-II, eGFR and mean arterial pressure. A mixed model was chosen because it allows the analysis of all data, including those of patients with missing values. Statistical analyses were performed using SPSS software, version 20 (IBM, Armonk, NY, USA). The significance level was set at P < 0.05.
RESULTS
The average patient age was 65 ± 4 years in the mycophenolate group (n = 23) and 66 ± 4 years in the sirolimus group (n = 21). The predominant sex was male; smoking, biopsy-proven acute rejection and baseline cholesterol did not differ between groups (Table 1). The use of concomitant medications like statins and ACEi did not differ between groups. The mean arterial pressure decreased over time in both groups but did not differ between the two groups (Table 1). Total cholesterol was higher in the sirolimus group at 6 and 12 months. High-density lipoprotein cholesterol decreased over time in both groups but was higher in the sirolimus group than the mycophenolate group (P = 0.01). Triglycerides and low-density lipoprotein cholesterol did not differ between the groups and over time. The eGFR and urinary protein/creatinine ratio also did not differ between groups and over time (Table 1).
Baseline characteristics of the tacrolimus plus mycophenolate group and tacrolimus plus sirolimus group
| Mycophenolate | Sirolimus | P | |
|---|---|---|---|
| n = 23 | n = 21 | ||
| Age (years) | 65 ± 4 | 66 ± 4 | 0.577 |
| Diabetes, % | 13 | 22.7 | 0.142 |
| Men, % | 78.3 | 81.8 | 0.605 |
| White, % | 78.3 | 85.7 | 0.218 |
| Body mass index (kg/m2) | 25.25 ± 2.6 | 25.49 ± 8.3 | 0.697 |
| Smoking, % | 39 | 31.8 | 0.375 |
| Time in dialysis (months) | 42.2 ± 37.6 | 46.2 ± 44.5 | 0.69 |
| Biopsy-proven acute rejection (%) | 0 | 4.8 | 0.29 |
| Panel-reactive antibody (%) | 8 ± 24 | 3 ± 13 | 0.11 |
| HLA mismatches | 3 ± 1 | 3 ± 2 | 0.29 |
| Induction therapy (%) | |||
| Basiliximab | 91.3 | 81.0 | 0.31 |
| Thymoglobulin | 8.7 | 19.0 | |
| Concomitant medications | |||
| Statin (baseline) (%) | 52.2 | 59.1 | 0.420 |
| Statin (end of study) (%) | 69.6 | 72.7 | 0.815 |
| ACEi/ARA-II (%) | 60.9 | 45.5 | 0.300 |
| Number of antihypertensives | 1.8 ± 1 | 1.4 ± 0.7 | 0.190 |
| Donor characteristics | |||
| Donor age (years) | 41 ± 12 | 41 ± 11 | 0.85 |
| Donor creatinine (mg/dL) | 1.58 ± 0.8 | 1.61 ± 1.1 | 0.98 |
| Cause of donor death (%) | |||
| Cranial trauma | 47.8 | 38.1 | |
| Cerebrovascular | 47.8 | 47.6 | 0.48 |
| Others | 4.3 | 14.3 | |
| Sequential measures | |||
| Urinary protein/creatinine ratio (mg/mg) | |||
| 3 months | 0.42 ± 0.369 | 1.1 ± 1.9 | 0.125 between groups |
| 6 months | 0.13 ± 0.15 | 0.19 ± 0.22 | |
| 12 months | 0.22 ± 0.77 | 0.20 ± 0.37 | |
| eGFR (mL/min) | |||
| 3 months | 52 ± 26 | 46 ± 19 | 0.182 between groups |
| 6 months | 64 ± 23 | 54 ± 14 | |
| 12 months | 60 ± 15 | 60 ± 17 | |
| Mean arterial pressure (mmHg) | |||
| 3 months | 102 ± 5.8 | 102 ± 6.9 | 0.121 between groups |
| 6 months | 98 ± 4.8† | 91 ± 18† | |
| 12 months | 91 ± 3.4† | 90 ± 3.3† | |
| Total cholesterol (mg/dL) | |||
| Baseline | 179 ± 62 | 206 ± 34 | *0.023 between groups |
| 6 months | 170 ± 45 | 189 ± 34* | |
| 12 months | 149 ± 38 | 176 ± 32* | |
| HDL cholesterol (mg/dL) | |||
| Baseline | 52 ± 16 | 69 ± 18 | *0.01 between groups |
| 6 months | 46 ± 11 | 62 ± 24* | |
| 12 months | 45 ± 25 | 59 ± 28* | |
| TG (mg/dL) | |||
| Baseline | 234 ± 159 | 158 ± 59 | 0.245 between groups |
| 6 months | 173 ± 52 | 161 ± 44 | |
| 12 months | 167 ± 40 | 181 ± 77 | |
| LDL cholesterol (mg/dL) | |||
| Baseline | 83 ± 53 | 104 ± 20 | 0.185 between groups |
| 6 months | 89 ± 37 | 94 ± 26 | |
| 12 months | 69 ± 30 | 75 ± 28 | |
| cIMT (mm) | |||
| Baseline | 0.82 ± 0.27 | 0.77 ± 0.14 | *0.012 between groups |
| 6 months | 0.81 ± 0.16 | 0.72 ± 0.12* | |
| 12 months | 0.78 ± 0.15 | 0.69 ± 0.13* |
Data are presented as mean ± SD unless otherwise stated. Repeated analysis of total cholesterol, eGFR, protein/creatinine and cIMT at baseline, 6 and 12 months.
Statistical differences between groups at different time points
P < 0.001 over time.
HLA, human leukocyte antigen; LDL, low-density lipoprotein.
The mean difference between cIMT at 12 months and baseline was −0.03 ± 0.19 mm in the mycophenolate group and −0.11 ± 0.08 mm in sirolimus group (P = 0.05) (Figure 2). The mean cIMT decreased over time at 6 and 12 months in both groups, but only in the sirolimus group was this difference statistically significant (P = 0.012) (Table 1 and Figure 3). In the analysis adjusted for age, sex, presence of diabetes, statin use, ACEi, smoking, mean arterial pressure and eGFR a reduction in cIMT was seen only in the sirolimus group (P = 0.016) (Table 2). Another way to visualize the data is through a heatmap, which showed a more intensive drop of cIMT in the sirolimus group over time (Figure 4).
Analysis of the cIMT as a repeated measures considering the covariates using generalized mixed model with gamma distribution and log link function
| Fixed effects | F | df1 | df2 | P |
|---|---|---|---|---|
| Corrected model | 1.888 | 11 | 86 | 0.052 |
| Time (baseline, 6 and 12 months) | 0.508 | 2 | 86 | 0.604 |
| Sirolimus Group | 6.023 | 1 | 86 | 0.016 |
| Smoking | 1.985 | 1 | 86 | 0.162 |
| Diabetes | 1.549 | 1 | 86 | 0.217 |
| Statin use | 0.086 | 1 | 86 | 0.769 |
| Age | 0.244 | 1 | 86 | 0.623 |
| Sex | 1.117 | 1 | 86 | 0.293 |
| ACEi/ARA-II | 0.946 | 1 | 86 | 0.334 |
| Mean arterial pressure | 3.645 | 1 | 86 | 0.060 |
| eGFR | 0.495 | 1 | 86 | 0.484 |
Probability distribution: Gamma; Link function: log.
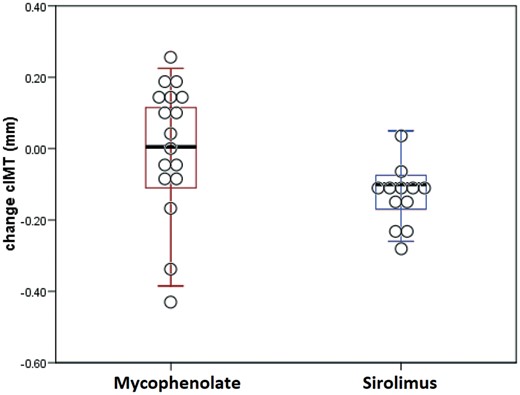
Mean change of cIMT between 12 months and baseline in mycophenolate and sirolimus groups. p = 0.05 x mycophenolate group.
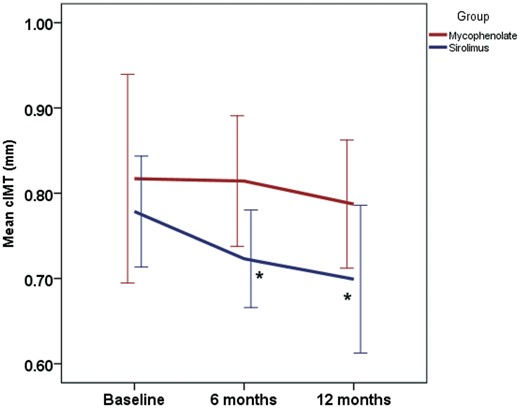
Evolution of cIMT in relation to the three time points and between groups (red: mycophenolate; blue: sirolimus). Analysis of generalized mixed models. *P = 0.012 × mycophenolate group.
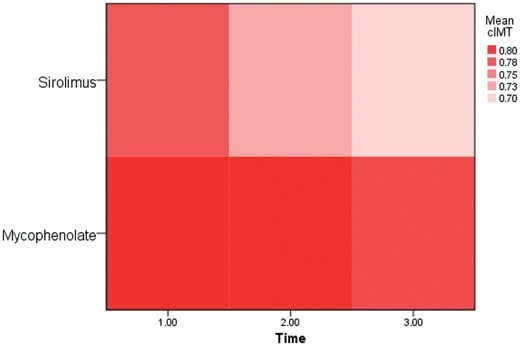
Heatmap showing the mean value of cIMT in the sirolimus and mycophenolate groups over time (1.00: baseline; 2.00: 6 months and 3.00: 12 months). Higher values of cIMT are represented in darker red. We observed a decreased cIMT in both groups; the change was most significant in the sirolimus group.
DISCUSSION
In this trial, we analyzed the cIMT measurements at baseline and at 6 and 12 months after transplantation in 44 patients. We observed a reduction in cIMT measures over time in the group taking sirolimus. Despite the higher total cholesterol levels in this group, cIMT decreased.
Several experimental animal studies showed a reduction of atherosclerosis with the use of mTORI [8, 9]. The reduced atherogenesis with mTORI has a theoretical basis in reducing monocyte chemotaxis and reducing the inflammatory mechanism [10]. The clinical translation of this fact is still uncertain because few clinical trials have evaluated this outcome. The A2310 cardiac transplant study was one of the few clinical trials that evaluated atherogenesis in transplantation [13]. This study assessed 189 patients by using endovascular ultrasound at baseline and 12 months. By Month 12, the mean increase in maximal intimal thickness of the coronary arteries was significantly smaller in the everolimus group than in the mycophenolate group. Conversely, Szymczak et al. [15] did not find a reduction of cIMT after renal transplantation with use of sirolimus. However, the study was performed 3–24 years after transplantation, and the lack of a prospective design makes comparisons difficult.
The IMT provides an alternative endpoint of cardiovascular outcomes in clinical trials because it may detect early signs of atherosclerosis. Several clinical trials have used IMT to assess cardiovascular risk [16, 17] and support the concept that IMT measurements can be used as a surrogate marker of atherosclerosis [18].
In this study, cIMT was decreased in all patients (both groups) because of the transplant effect, which has already been observed in previous studies that compared cIMT before and after transplantation [19]. The reduction of cIMT may be one of the factors responsible for declining cardiovascular risk after kidney transplantation. In this study we also observed a class effect in which the sirolimus group had a greater reduction in cIMT; this was also seen in a model adjusted for principal factors associated with variability of cIMT [20]. In addition, this drug class prevents intimal hyperplasia [21] and reduces atherosclerosis in animal models [8, 9, 22] and in a clinical trial [13]. These possible effects may explain our observations. Therefore, the dyslipidemia caused by mTORI is not such a major problem because the drug enhanced stability of atherosclerotic plaques, reducing the risk of rupture by promoting macrophage clearance and limiting the inflammatory response within smooth muscle cells in the artery walls [23, 24].
Another point to consider in the pathophysiology of atherogenesis related to mTORI use is the time of exposure and the dose of these medications. The mTORI preferentially inhibit the mTORC1 pathway, which is responsible for the major beneficial effects, including the anti-atherosclerotic responses. The inhibition of mTORC2, which was rapalog-insensitive, is related to increased insulin resistance and may be responsible for some serious undesired effects. Long-term treatment with mTORI may inhibit mTORC2 and may be responsible for the development of mTORC1 resistance, thus reversing its beneficial role in atherosclerosis [25]. This may explain the absence of effect on atherosclerosis in clinical trials with a long time of exposure to mTORI [15]. It also explains the beneficial effects in reducing atherosclerosis when mTORI were used in dosages controlled for a shorter period, as in study A2310 [13] and in the present trial.
Conversely some recent studies have failed to demonstrate benefit of mTORI related to cardiovascular endpoints. The Efficacy, Safety and Evolution of Cardiovascular Parameters in Renal Transplant Recipients (ELEVATE) study showed no reduction of left ventricular mass index and no reduction of arterial stiffness as measured by pulse wave velocity between groups (tacrolimus and everolimus) [22]. Similarly, Cruzado et al. in a 24 month open-label study did not show a reduction of left ventricular mass index in a conversion group from tacrolimus to everolimus [26]. However, neither study assessed atherogenesis through carotid plaque evaluation or cIMT. In addition, these studies are of conversion from tacrolimus to everolimus and have not used mTORI since beginning of transplantation.
The main limitation of this trial is that it was a single-center study with a small number of patients. We also evaluated only the cIMT and some authors report that carotid plaques are more correlated to coronary heart disease in older adults [27]. Also, other ultrasound-derived plaque metrics like maximum IMT that are predictors of cardiovascular disease were not evaluated in this trial [28].
However, it was a prospective randomized study in an elderly kidney transplant population with high cardiovascular risk. Repeated measures of cIMT were taken three times for each patient, and we used a robust statistical method to analyze the differences over time. This is one of the few studies that has evaluated atherosclerosis related to mTORI in a prospective controlled trial.
In conclusion, the use of sirolimus plus tacrolimus de novo in kidney transplantation is associated with a reduction in the cIMT after 12 months, a more significant difference than seen with the combination of mycophenolate and tacrolimus. This suggests a class effect of mTORI in the prevention of atherosclerosis. The results of this trial have to be confirmed with other studies focusing on clinical outcomes and in high cardiovascular risk patients.
FUNDING
This study has received no funding.
AUTHORS’ CONTRIBUTIONS
A.L.S., H.S.N., H.M.T., A.M.B., M.M.C., M.F.V. and L.G.M.d.A. participated in the performance of the research. D.R.F. and L.G.M.d.A. performed analysis and interpretation of data. A.L.S. contributed to the conception, design and final approval of the version to be published.
CONFLICT OF INTEREST STATEMENT
None declared. The results presented in this paper have not been published previously in whole or part, except in abstract format.


Comments