


Abstract
The recent emergence of severe acute respiratory syndrome coronavirus 2 (SARS-CoV-2) has resulted in a rapid proliferation of serologic assays. However, little is known about their clinical performance. Here, we compared two commercial SARS-CoV-2 IgG assays.
103 specimens from 48 patients with PCR-confirmed SARS-CoV-2 infections and 153 control specimens were analyzed using SARS-CoV-2 serologic assays by Abbott and EUROIMMUN (EI). Duration from symptom onset was determined by medical record review. Diagnostic sensitivity, specificity, and concordance were calculated.
The Abbott SARS-CoV-2 assay had a diagnostic specificity of 99.4% (95% CI; 96.41–99.98%), and sensitivity of 0.0% (95% CI; 0.00–26.47%) at <3 days post symptom onset, 30.0% (95% CI; 11.89–54.28) at 3–7d, 47.8% (95% CI; 26.82–69.41) at 8–13d and 93.8% (95% CI; 82.80–98.69) at ≥14d. Diagnostic specificity on the EI assay was 94.8% (95% CI; 89.96–97.72) if borderline results were considered positive and 96.7% (95% CI; 92.54–98.93) if borderline results were considered negative. The diagnostic sensitivity was 0.0% (95% CI; 0.00–26.47%) at <3d, 25.0% (95% CI; 8.66–49.10) at 3–7d, 56.5% (95% CI; 34.49–76.81) at 3–7d and 85.4% (95% CI; 72.24–93.93) at ≥14d if borderline results were considered positive. The qualitative concordance between the assays was 0.83 (95% CI; 0.75–0.91).
The Abbott SARS-CoV-2 assay had fewer false positive and false negative results than the EI assay. However, diagnostic sensitivity was poor in both assays during the first 14 days of symptoms.
Introduction
There has been a rapid proliferation of serologic tests for the novel severe acute respiratory syndrome coronavirus 2 (SARS-CoV-2), the causative pathogen of the ongoing Coronavirus 2019 (COVID-19) pandemic. In contrast to the mandatory emergency use authorization (EUA) that regulates molecular testing for SARS-CoV-2, the FDA did not originally mandate EUA for regulation of serologic tests, resulting in a rapid expansion in SARS-CoV-2 serologic tests with unknown clinical performance. There have been many suggested uses of SARS-CoV-2 serology, including seroprevalence studies and determination of immune status. Many of the studies that have attempted to examine these utilities have suffered from small sample size (1,) and/or have been published in nonpeer reviewed preprint servers (2, 3,). Some professional societies have also issued recommendations, but there has been no consensus so far on the primary indications of serology (4,). For example, the Infectious Diseases Society of America (IDSA) suggests that serology may be useful in: 1) patients with clinical symptoms highly suggestive of SARS-CoV-2 but who are COVID RNA negative; 2) selection of convalescent plasma donors; 3) evaluation of vaccine responses; and 4) epidemiologic studies (5,). Both the IDSA and the WHO have strongly cautioned against associating positive serology with immunity (6).
Since convalescent plasma has been used with some success to treat COVID-19 patients, antibodies are presumed to be protective against SARS-CoV-2 (7–9,). Nonetheless, the epitope specificity and titer required to achieve immunity have still not been established. IgG and/or IgM are typically measured in infectious disease antibody response, although IgA has also been utilized in some available SARS-CoV-2 assays. At the time of writing, of the 12 serologic assays that have received EUA, 5 assays measure IgG only, 3 assays measure both IgM and IgG, and 4 assays measure total immunoglobulins (10,). Longitudinal antibody studies have demonstrated conflicting results about anti-SARS-CoV-2 IgM and IgG titers throughout the course of disease (11, 12,). Furthermore, the appropriate antigen to use for detection of circulating antibodies against SARS-CoV-2 has not yet been defined. Several manufacturers have designed assays that measure antibodies targeted against the viral spike protein which mediates entry of SARS-CoV-2 into host cells (13,) or the nucleocapsid protein which is a highly immunogenic structural protein (14). There is considerable homology between SARS-CoV-2 and other seasonal coronaviruses, making antigen selection for immunoassays crucial for high specificity.
To date, no comparison of commercial ELISAs for SARS-CoV-2 antibodies exists in the peer-reviewed literature. Furthermore, due to the high demand for these assays during the pandemic, validations by some manufacturers have been abbreviated. Here, we compared the performance of two SARS-CoV-2 IgG antibody assays from Abbott and EUROIMMUN (EI).
Materials and Methods
Test Specimens
This investigation was approved by the Institutional Review Board of Washington University in St. Louis, MO. Residual patient specimens that had been sent to the Barnes Jewish Hospital laboratory for physician-ordered complete blood count in EDTA Vacutainer tubes (BD) were utilized. A subset of serum specimens obtained in 2015 and stored at −80 °C before the emergence of SARS-CoV-2 was used as control specimens.
Given the lack of clear guidance from professional societies regarding the utility of serologic assays, the validation protocol assumed that the primary purpose of testing would be for population-based screening (i.e., epidemiologic studies or screening asymptomatic patients) and for patients who present >10d after symptom onset who are PCR negative. 103 specimens from 48 patients with confirmed COVID-19 infections and 153 presumed negative specimens were analyzed. Control specimens included 80 patients who were symptomatic but PCR negative for SARS-CoV-2, 50 serum specimens collected and frozen in 2015 before the emergence of SARS-CoV-2, 5 specimens from patients with other coronaviruses confirmed by molecular testing but PCR negative for COVID-19 (including Coronaviruses HKU1, NL63, and 229E), and 4 specimens from patients with Influenza A or B. 14 specimens with potentially interfering antibodies were also included; 5 were positive for CMV IgG, 3 were positive for EBV VCA IgG, 3 were positive for EBV VCA IgM, 2 were positive for both EBV VCA IgG and IgM, and 1 was positive for rheumatoid factor.
Clinical Information
Duration from symptom onset was determined by review of the electronic medical record from 2 independent assessors and inferred from physician encounter notes. Symptoms were defined as chief complaint of the current encounter. The primary symptoms included respiratory (i.e., shortness of breath), cough, fever, loss of taste or smell, headache, and sore throat (15). Underlying medical conditions that could influence humoral immunity were documented when possible.
Instrumentation and analysis
Specimens were analyzed using 2 separate immunoassays. The Abbott SARS-CoV-2 IgG assay was performed on an Abbott Architect i2000 (Abbott Diagnostics) according to the manufacturer’s instructions. The Abbott method is a qualitative assay that detects IgG binding to an undisclosed epitope of the SARS-CoV-2 nucleocapsid protein. The EI SARS-CoV-2 IgG assay (EUROIMMUN) is a 96-well plate format that was performed on an automated Inova QUANTA-Lyser 240 (Inova Diagnostics Inc.) according to the manufacturer’s instructions. The EI assay detects anti-SARS-CoV-2 IgG directed against the S1 domain of viral spike protein. Both assays rely on an assay-specific calibrator to report a ratio of specimen absorbance to calibrator absorbance. The final interpretation of positivity is determined by ratio above a threshold value. Abbott’s assay can be interpreted as positive (ratio ≥1.4) or negative (ratio <1.4), while EI’s assay can be interpreted as positive (ratio ≥1.1), borderline (ratio <1.1 to ≥0.8) or negative (ratio <0.8). Quality controls (QC) as supplied by the manufacturer were analyzed on each day of testing. For interference studies, hemolysis index, icteric and lipemic index were determined on a Roche e 602 analyzer (Roche) according to manufacturer’s instructions.
Presence or absence of SARS-CoV-2 infections were adjudicated by detection of SARS-CoV-2 viral RNA from nasopharyngeal (NP) swabs, oropharyngeal (OP) swabs, or lower respiratory tract specimens tested in the Barnes Jewish Hospital laboratory with assays validated for clinical use. Due to reagent shortages, multiple platforms were used to assess the presence of SARS-CoV-2 RNA. The Quidel Lyra RT-PCR assay that detects the SARS-CoV-2 nonstructural Polyprotein (pp1ab) was the primary method used (limit of detection 800 copies/mL). Some patients were adjudicated based on results from molecular testing using the Xpert Xpress SARS-CoV-2 molecular assay (Cepheid) (limit of detection 250 copies/mL) and the Simplexa COVID-19 Direct Assay using a LIAISON MDX (Diasorin) (lower respiratory tract specimens only, limit of detection 500 copies/mL).
Remnant specimens were obtained and frozen at −80 °C in 500 µL aliquots until analysis. Each specimen was thawed within 24 h of analysis. The same aliquot was used for both assays.
Assay validation and precision
Precision studies were performed using a modified version of the CLSI EP12-A2 guidelines (16). For precision studies, QC materials (positive and negative) as supplied by Abbott and EI were analyzed. A patient pool from a single positive patient was also diluted into negative control plasma to a concentration near the positive cutoff for both assays. Repeatability was assessed by analyzing 20 replicates on one day on the Abbott assay. Owing to limited reagent availability, repeatability was assessed with 10 replicates on one day with the EI assay. Total imprecision was assessed in duplicate over 5 days. Interference was assessed for hemolysis, icterus, and lipemia using plasma from two positive patients, diluted into pools from a single negative patient.
Statistical Analysis
Diagnostic sensitivity and specificity for each assay were calculated using molecular testing as the gold standard. For the EI assay, sensitivity and specificity were calculated assuming that a borderline result was a positive or negative based on guidelines to manufacturers by the FDA (17,). However, given the concern for false positive results, borderline results are primarily reported as positives. Time from PCR+ was also used to calculate sensitivity and specificity. One patient was PCR-, but clinically adjudicated as COVID-19+ and was positive by both immunoassays. Therefore, a separate specificity analysis was performed for this discrepant specimen (5). Concordance was calculated using Cohen’s Kappa and percent agreement. For determining time to onset of symptoms, a sigmoidal, 4-parameter logistic regression was used to fit the data and interpolate the days to positivity for all patients who mounted an immune response (patients who did not mount immune responses were excluded). Sigmoidal modeling was chosen based on the kinetics of immune response by 12 patients monitored serially. All statistical analyses were performed with GraphPad Prism 8.
Results
The total diagnostic specificity of the Abbott assay was 99.4% (95% CI; 96.41–99.98) (Fig. 1A). The diagnostic sensitivity at < 3d of symptoms was 0.0% (95% CI; 0.00–26.47), at 3–7 d 30.0% (95% CI; 11.89–54.28), and at 8–13 d was 47.8% (95% CI; 26.82–69.41). For patients with 14d of symptoms or more, the sensitivity was 93.8% (95% CI; 82.80–98.69). Using the time from the positive SARS-CoV-2 PCR result, the sensitivity from <3d post-PCR testing was 47.6 (95% CI; 32.00–63.58%), for 3–7 d was 59.1% (95% CI; 36.35–79.29), for 8–13 d was 69.6% (95% CI; 47.08–86.79) and for 14d+ was 81.3% (95% CI; 54.35–95.95) on the Abbott assay (Fig. 1B). 12/27 patients would have been positive by serologic testing if tested simultaneously with PCR. In patients who were simultaneously tested for serology and molecular testing (i.e., 0d), the mean time to symptoms in the specimens from serologically positive patients was 12.2d (median = 14d) while the mean time to symptoms was 3.3d (median = 2d) for the serologically negative patients.
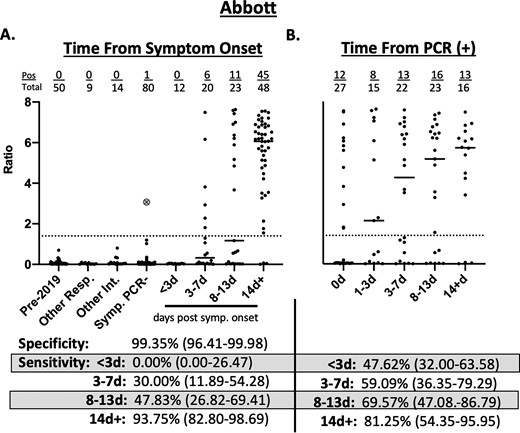
Clinical performance of Abbott SARS-CoV-2 IgG Immunoassay. a) Seropositivity in 153 expected negative specimens and 103 specimens from 48 patients with PCR-positive COVID-19 relative to days from symptom onset. b) Seropositivity in 103 specimens from 48 patients with PCR-positive COVID-19 relative to days from testing positive by PCR. Pre-2019–50 specimens collected in 2015 and stored at −80 °C. Other Resp.—specimens from patients with PCR confirmed influenza A (n = 2), influenza B (n = 2), other non-COVID-19 coronaviruses (n = 5). Other Int.—specimens from patients with positive CMV IgG (n = 5), EBV VCA IgG (n = 5), EBV VCA IgM (n = 3), rheumatoid factor (n = 1). Symp. PCR-—specimens from 80 patients presenting to the hospital with symptoms of respiratory infection and PCR negative for COVID-19. The large gray circle with an X represents a patient who was PCR negative but had symptoms consistent with COVID-19 and prolonged exposure to a family member with PCR confirmed COVID-19. Dotted line represents the cutoff off for positivity (Ratio ≥1.4). Values in parentheses represent 95% confidence interval.
The diagnostic specificity on the EI SARS-CoV-2 assay was 94.8% (95% CI; 89.96–97.72) if borderline results were considered positive and 96.7% (95% CI; 92.54–98.93) if borderline results were considered negative (Fig. 2A). The diagnostic sensitivity at < 3d was 0.0% (95% CI; 0.00–26.47%), at 3–7 d was 25.0% (95% CI; 8.66–49.10), at 8–13 d was 56.5% (95% CI; 34.49–76.81) and at 14d was 85.4% (95% CI; 72.24–93.93) if a borderline result was considered positive. Using time from the positive SARS-CoV-2 PCR result, the sensitivity at <3d was 38.1% (95% CI; 23.57–54.36), for 3–7 d was 63.6% (95% CI; 40.66–82.80), for 8–13 d was 69.6% (95% CI; 47.08–86.79) and for 14d+ was 75.0% (95% CI; 47.62–92.73) (Fig. 2B). Sensitivity calculations, if borderline results are considered negative, can be found in Supplemental Table 1.
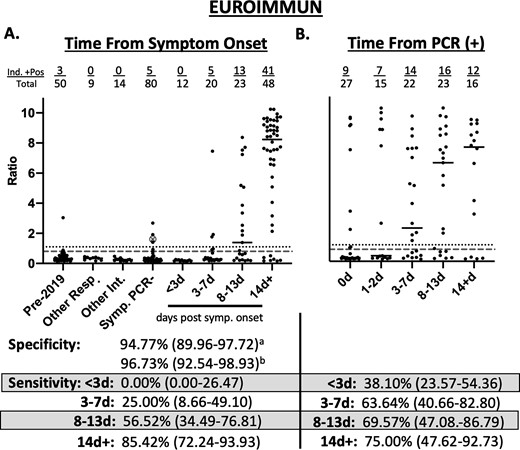
Clinical performance of EUROIMMUN Anti-SARS-CoV-2 IgG ELISA. a) Seropositivity in 153 expected negative specimens and 103 specimens from 48 patients with PCR-positive COVID-19 relative to days from symptom onset. b) Seropositivity in 103 specimens from 48 patients with PCR-positive COVID-19 relative to days from testing positive by PCR. Pre-2019—50 specimens collected in 2015 and stored at −80 °C. Other Resp.—specimens from patients with PCR confirmed influenza A (n = 2), influenza B (n = 2), other non-COVID-19 coronaviruses (n = 5). Other Int.—specimens from patients with positive CMV IgG (n = 5), EBV VCA IgG (n = 5), EBV VCA IgM (n = 3), rheumatoid factor (n = 1). Symp. PCR-—specimens from 80 patients presenting to the hospital with symptoms of respiratory infection and PCR negative for COVID-19. The large gray circle with an X represents a patient who was PCR negative but had symptoms consistent with COVID-19 and prolonged exposure to a family member with PCR confirmed COVID-19. Dotted line represents the cutoff off for positivity (Ratio ≥ 1.1). Dashed gray line represents cutoff for negativity (Ratio < 0.8). aSpecificity calculated with borderline results as positive. bSpecificity calculated with intermediate results as negative. Sensitivity calculated with intermediate results as positive. Values in parentheses represent 95% confidence interval.
There were 4 discordant results between the serologic assays and molecular testing. Of the 3 patients who did not mount an antibody response by day 14 on both assays, 2 were on chemotherapy for leukemia. The third had no noted immunodeficiency but was previously diagnosed with long-chain 3-hydroxyacyl-coenzyme A dehydrogenase deficiency. One patient (gray circle with an X, Figs 1 and 2) was negative by molecular testing but positive by both immunoassays; this patient was clinically adjudicated as COVID-19+ with greater than 10d of classical COVID symptoms (fever, headache, loss of taste and smell) and with multiple exposures to family members with confirmed COVID. If this patient was excluded from analysis, the diagnostic specificity of the Abbott assay was 100% (95% CI; 97.6–100.0) and of the EI assay was 95.39% (95% CI; 90.74–98.13) if borderline results were considered positive.
The overall positive percent agreement between the Abbott and EI SARS-CoV-2 assays was 94.3% and 96.4% if borderline results were considered negative or positive, respectively (Fig. 3). The overall negative percent agreement was 90.5% if borderline results were considered negative and 85.7% if considered positive. The overall concordance was 0.83 (95% CI; 0.75–0.91) regardless of how borderline results were adjudicated. Two specimens from patients who were negative for SARS-CoV-2 were weakly positive on the EI assay. Both patients had acute respiratory symptoms and recent infections attributed to other pathogens. The third discordant positive on the EI was from a specimen collected pre-pandemic.
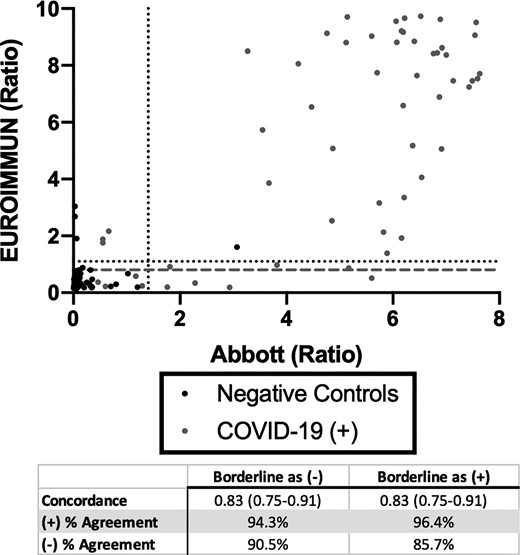
Concordance between Abbott and EUROIMMUN SARS-CoV-2 IgG Immunoassays Anti-SARS-CoV-2 IgG seropositivity in 153 expected negative specimens and 103 specimens from 48 patients with PCR-positive COVID-19 at 14 days from symptom onset. Dotted line represents the cutoff off for positivity. Dashed gray line represents cutoff for negativity.
The kinetics of IgG seroconversion was evaluated using specimens from 12 patients with serial results (Supplemental Fig. 1). A nonlinear regression fit of the data from symptom onset vs. signal revealed a positive IgG result by 9.5d (95% CI; 8.3–10.4) on the Abbott SARS-CoV-2 assay and 12.7d (95% CI; 12.3–14.1) on the EI assay (Fig. 4). Serial dilutions of a single specimen on both assays revealed a linear curve (Supplemental Fig. 2). The Abbott assay remained positive to a titer of 1:16 while the EI remained positive to 1:32 and was borderline at 1:64.
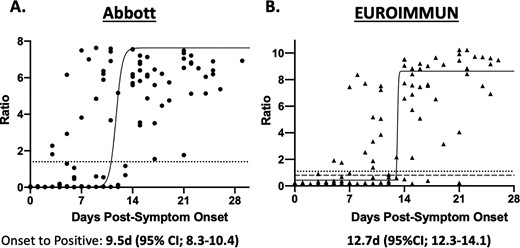
Seropositivity in 99 specimens from 45 patients with PCR-positive COVID-19 relative to days from symptom onset. a) Abbott SARS-CoV-2 IgG Immunoassay. Dotted line represents the cutoff off for positivity (Ratio ≥ 1.4). b) EUROIMMUN Anti-SARS-CoV-2 IgG ELISA. Dotted line represents the cutoff off for positivity (Ratio ≥ 1.1). Dashed gray line represents cutoff for negativity (Ratio < 0.8). Solid black curve represents the nonlinear, sigmoidal fit of the points. Time to symptom onset is calculated by interpolating from the positive cutoff to the curve. Patients who did not mount an immune response were excluded.
For the Abbott SARS-CoV-2 assay, repeatability and total imprecision of the signal for the positive QC and patient pool were < 2% and the agreement of the qualitative results was 100% (Supplemental Table 2). Repeatability and total imprecision for the EI were CV 3.73% and 4.16%, respectively, for the positive QC and CV 9.61% and 12.25% for the patient pool and the agreement of the qualitative results was 100%. For both assays, there was minimal interference from hemolysis, icterus, and lipemia (Supplemental Table 3). There was no carryover observed from a specimen with a high signal to negative specimens on the Abbott assay (Supplemental Table 4).
Discussion
Here, two commercially available, serologic assays for detection of SARS-CoV-2 antibodies in human plasma were evaluated. We found the Abbott assay to have higher diagnostic sensitivity and specificity than the EI assay, although overlapping confidence intervals indicate this finding was statistically insignificant, and more studies are necessary to confirm this observation. Nonetheless, the EI assay was associated with more false negative results and false positive results relative to the Abbott assay as adjudicated by molecular diagnosis. Importantly, neither assay was sensitive enough to reliably detect antibodies before 14d post-symptom onset. To our knowledge, this is the first of such assay comparisons that adhere to validation guidelines and compare multiple commercial platforms.
Given the relaxed regulatory requirements by the FDA on SARS-CoV-2 serology tests, it is crucial for clinical laboratories to uphold the rigor of assay validation and to determine if assay performances, as reported in package inserts, are accurate. For example, only 9 specimens from 8 patients were used to determine the diagnostic sensitivity reported in the package insert of the EI SARS-CoV-2 assay. In contrast, the CLSI recommends specimens from at least 50 patients with confirmed disease (16). Interestingly, we also noted 3 patients who failed to mount a serologic immune response on both assays at > 14d post-infection. This was in contrast to Abbott’s package insert claiming diagnostic sensitivity of 100%. Our results likely differ from those of the manufacturers owing to a majority of our patient population being hospitalized with multiple overlapping clinical scenarios. This demonstrates the importance of testing patients who have fully recovered from infection and hospitalized patients with multiple comorbidities including immunodeficiencies. Furthermore, some manufacturers and laboratories have reportedly used the time from SARS-CoV-2 PCR positivity to define the sensitivity of serology at various disease time points rather than the time from symptom onset. In this study, we compared these two methods for calculating sensitivity. We found that the sensitivity at earlier time points when benchmarked to PCR positivity was higher than when benchmarked to symptom onset. However, this is likely an overestimation of sensitivity, as some patients presented late and were further in their disease progression at time of first PCR testing. As evidence of this, the median time to onset of symptoms in patients with PCR and serologic positive results on the same day of testing was 14d. Nonetheless, adjudicating from 14d from symptom onset and 14d from PCR positive results provided similar sensitivity. It is important for laboratories to define how they have determined time to positive results when calculating sensitivity and distributing this information to providers. Our results also demonstrate low sensitivity for detecting SARS-CoV-2 antibodies before 14d post-symptom onset on both assays. This argues that serologic status should not be assessed until 14d post-symptom onset and confirms that molecular assays should remain the primary method for COVID-19 diagnosis.
The low specificity on the EI assay is particularly concerning since serologic assays have been used for both population screening and epidemiologic studies (3,). Interestingly, none of the false positive results on the EI assay were from patients with confirmed seasonal coronavirus and three of the false positives were from samples collected in 2015. This may be due, at least in part, to a high incidence of patients with antibodies to seasonal coronaviruses coupled with their considerable homology with SARS-CoV-2 (12,). The current number of confirmed COVID-19 cases in the US is greater than 1.03 million, resulting in an estimated prevalence of approximately 0.32% (18, 19,). As a result, a serologic test with high specificity is essential to achieve a high positive predictive value (PPV) (20,). Since the prevalence of SARS-CoV-2 antibody positive individuals in the US is currently unknown, the FDA summarizes predicted performance of manufacturers’ assays based on a 5% prevalence (21). Assuming a 5% prevalence and based on the results reported here, the PPV of the Abbott assay is 88.7% and of the EI assay is 45.9%, highlighting the importance of a high specificity. However, the FDA also acknowledges that in low prevalence populations (such as asymptomatic individuals and population screening studies), a single antibody test is likely insufficient to judge true positives from false positives. As evidence of this, decreasing the prevalence to 0.5% decreases the PPV of the Abbott SARS-CoV-2 assay to 44% and the EI to 7.5%.
The IDSA recommends that patients with clinical symptoms consistent with COVID-19 but negative for SARS-CoV-2 by molecular testing may be diagnosed by serology (5). In this study, only 1 of the 80 patients who were symptomatic and PCR negative was positive by both immunoassays. While the frequency of such PCR negative-serology positive patients may increase with a larger sample size, our observation also indicates that the clinical scenario proposed by IDSA may be a low likelihood event. This further strengthens the argument that viral RNA molecular testing should remain the gold standard for diagnosis of COVID-19 infections. Larger studies are needed to fully assess the utility of serologic diagnosis as suggested by the IDSA.
We found that time to positive serology is shorter with the Abbott assay, which detects an epitope of the viral nucleocapsid, when compared to the EI assay, which detects epitope against viral spike protein. This is consistent with earlier studies of B cell responses to SARS-CoV, where humoral immune response typically arises first against the viral nucleocapsid, followed by response against the viral spike protein (22,). Therefore, it is tempting to speculate that the viral nucleocapsid may be a better target for earlier detection of immunoglobulins. However, both the IDSA and the CDC strongly recommend against the use of serology for diagnosing acute SARS-CoV-2 infection, limiting the clinical relevance of this finding (5,). Another limitation of clinically available serologic assays is the unknown significance of the antigens targeted for detection. At this time, it is unclear if antibodies against the SARS-CoV-2 nucleocapsid or the spike protein are neutralizing and confer protection. Moreover, since both Abbott and EUROIMMUN are qualitative assays and neither are approved for quantitative determination of anti-SARS-CoV-2 antibodies, their utility for convalescent plasma donors is yet to be defined (20).
One limitation of our study is that symptom onset was subjectively reported by physicians and this information was retrieved by manual medical record review. For example, patients presenting from nursing home residents were poor historians due to cognitive disabilities. This may have affected the estimation of disease onset in our study and the predicted kinetics of IgG changes over the disease course. Nonetheless, these kinetic results highlight the need for serial measurements in some COVID+ patients and demonstrate that a single negative result does not necessarily rule out an infection.
In conclusion, the Abbott SARS-CoV-2 assay demonstrated higher sensitivity and specificity than EI SARS-CoV-2 assay in this study. Both assays have poor sensitivity during the first 14 days of symptom onset, indicating that they are inappropriate for diagnosis. As assays continue to emerge for SARS-CoV-2, robust validation studies must be undertaken to assess the performance of these methods.
Author Contributions
All authors confirmed they have contributed to the intellectual content of this paper and have met the following 4 requirements: (a) significant contributions to the conception and design, acquisition of data, or analysis and interpretation of data; (b) drafting or revising the article for intellectual content; (c) final approval of the published article; and (d) agreement to be accountable for all aspects of the article thus ensuring that questions related to the accuracy or integrity of any part of the article are appropriately investigated and resolved.
N.M. Logsdon, statistical analysis, provision of study material or patients; N.W. Anderson, financial support, administrative support; C.W. Farnsworth, statistical analysis, provision of study material or patients.
Authors’ Disclosures or Potential Conflicts of Interest
Upon manuscript submission, all authors completed the author disclosure form. Disclosures and/or potential conflicts of interest:
Employment or Leadership
None declared.
Consultant or Advisory Role
N.W. Anderson, Diasorin Molecular.
Stock Ownership
None declared.
Honoraria
None declared.
Research Funding
None declared.
Expert Testimony
None declared.
Patents
None declared.
Role of Sponsor
No sponsor was declared.
References
Infectious Diseases Society of America. IDSA COVID-19 antibody primer. https://www.idsociety.org/globalassets/idsa/public-health/covid-19/idsa-covid-19-antibody-testing-primer.pdf (Accessed May 2020).
WHO. “Immunity passports” in the context of COVID-19. https://www.who.int/news-room/commentaries/detail/immunity-passports-in-the-context-of-covid-19 (Accessed April
FDA. Coronavirus disease 2019 (COVID-19) emergency use authorizations for medical devices. https://www.fda.gov/medical-devices/emergency-situations-medical-devices/emergency-use-authorizations#coronavirus2019 (Accessed May
CDC. Symptoms of Coronavirus. https://www.cdc.gov/coronavirus/2019-ncov/symptoms-testing/symptoms.html (Accessed May
FDA. Statistical guidance on reporting results from studies evaluating diagnostic tests. https://www.fda.gov/media/71147/download (Accessed May
CDC. CDC COVID data tracker. https://www.cdc.gov/covid-data-tracker/ (Accessed May
United States Census Bureau. Population. https://www.census.gov/topics/population.html (Accessed May
FDA. EUA authorized serology test performance. https://www.fda.gov/medical-devices/emergency-situations-medical-devices/eua-authorized-serology-test-performance (Accessed May
Author notes
C.W. Farnsworth and N.W. Anderson contributed equally to this work and are co-corresponding authors.
