


Abstract
Plentiful bast fiber, a high crude protein content, and vigorous vegetative growth make ramie a popular fiber and forage crop. Here, we report the draft genome of ramie, along with a genomic comparison and evolutionary analysis. The draft genome contained a sequence of approximately 335.6 Mb with 42,463 predicted genes. A high-density genetic map with 4,338 single nucleotide polymorphisms (SNPs) was developed and used to anchor the genome sequence, thus, creating an integrated genetic and physical map containing a 58.2-Mb genome sequence and 4,304 molecular markers. A genomic comparison identified 1,075 unique gene families in ramie, containing 4,082 genes. Among these unique genes, five were cellulose synthase genes that were specifically expressed in stem bark, and 3 encoded a WAT1-related protein, suggesting that they are probably related to high bast fiber yield. An evolutionary analysis detected 106 positively selected genes, 22 of which were related to nitrogen metabolism, indicating that they are probably responsible for the crude protein content and vegetative growth of domesticated varieties. This study is the first to characterize the genome and develop a high-density genetic map of ramie and provides a basis for the genetic and molecular study of this crop.
1. Introduction
Ramie (Boehmeria nivea L. Gaud), popularly known as China grass, is a perennial herbaceous plant that belongs to the family Urticaceae. Ramie is one of the most important natural fiber crops, and the fiber extracted from its stem bast layer has several advantages over the fibers of other crops, such as long strands, a smooth texture, and high tensile strength. In addition, ramie is widely used as a livestock forage crop in southern China because it contains a high crude protein content in leaves and young stems (more than 20% of dry weight).1 Because of its fiber and nutritional feed properties, ramie has been widely planted in China, India, and other Asian and Pacific Rim countries.2 In China, ramie has been cultivated for more than 4,700 yrs.
Both the fiber and forage of ramie are vegetative organs; therefore, high vegetative yields are required. In order to meet the demands of production, cultivated ramie has been domesticated to have vigorous vegetative growth. Generally, domesticated ramie can be harvested three times per year in China, and up to six times per year in well-watered cultivated environments.3 Therefore, plentiful bast fiber, a high crude protein content, and vigorous vegetative growth are three notable features of ramie, and understanding these traits in domesticated ramie would increase our knowledge of the evolution of this crop. Recently, by comparing the transcriptomes of wild and cultivated ramie, two positively selected genes that function in gibberellin metabolism and a Walls are thin 1 (WAT1)-related protein, respectively, were identified, which are probably involved in vegetative growth and bast fiber biosynthesis, respectively.4 However, because of the absence of ramie genome information, these important traits in domesticated ramie are still poorly understood.
Ramie is a diploid species with 28 chromosomes (2n = 28), and its nuclear genome has been estimated to be approximately 716 Mb by flow cytometer analysis,5 which suggests that the nuclear genome is relatively simple and small. Therefore, it is feasible to perform whole-genome sequencing for this economically important crop. The nuclear genome of ramie has remained uncharacterized until now. Next-generation sequencing (NGS) technologies are powerful and cost-effective methods of high-throughput sequence determination, which has made de novo genome sequencing feasible in non-model species. Over 80 plant species have had their complete genomes sequenced using NGS.6 These genomic resources can greatly accelerate our understanding of the molecular bases of traits and the evolutionary histories of species.
To the best of our knowledge, ramie draft genome sequences were determined by NGS technology for the first time in the present study. Furthermore, in order to understand the traits in domesticated ramie, comparison and evolutionary analyses of the genome were performed. A high-density genetic map was constructed using a genotyping-by-sequencing (GBS) technique, which was used to anchor the draft genome sequences into the corresponding chromosome, thus developing an integrated genetic and physical map. This integrated map will be an exceptionally valuable tool for many genetic and genomic applications, such as fine-scale quantitative trait locus (QTL) mapping and cloning.
2. Materials and methods
2.1. Plant materials and DNA extraction
An F2 agamous line (FAL) population consisting of 134 lines derived from two ramie varieties, Qingdaye (QDY) and Zhongzhu 1 (ZZ1), was developed based on the strategy described in our previous study,5 and was used for the development of the genetic map. All 134 FALs and two parents were planted at the experimental farm of the Institute of Bast Fiber Crops, Chinese Academy of Agricultural Sciences, Changsha, China. Young leaf samples from each line were collected, immediately frozen in liquid nitrogen (N), and preserved at −80°C until DNA extraction. Total genomic DNA was extracted from the fresh leaves using a DNA extraction kit (Tiangen, Beijing, China).
2.2. Genome sequencing, data filtering, and assembly
The genome of one ZZ1 parent was sequenced using a whole-genome shotgun strategy. Total genomic DNA was used to construct sequencing libraries. Short insert paired-end libraries (230 bp and 500 bp) were generated using a NEBNext® Ultra™ DNA Library Prep Kit for Illumina (NEB, MA, USA) according to the manufacturer's instructions. Large-insert (2 kb and 5 kb) DNA sequencing libraries were prepared through circularization by Cre-Lox recombination.7 Sequencing for all four libraries was performed using the Illumina sequencing platform (HiSeqTM 2500) according to the manufacturer’s instructions (Illumina, San Diego, CA, USA).
The raw reads obtained were subjected to the following quality control. Firstly, we discarded all reads with adapter contamination. Secondly, we ruled out low-quality reads with more than 10% ambiguous ‘N’ sequences. Thirdly, we removed reads that had over 50% of bases with quality scores of less than 5. The size, heterozygous ratio, and repeat ratio of the genome were estimated based on the k-mer frequency of the sequence reads (k = 17).8
The clean, filtered reads were used for the de novo assembly of contigs, using a modified version of SOAPdenovo software that was developed specifically for the de novo assembly of the highly heterozygous jujube genome by Huang et al.,9 and the k value in K-mer was set at 41. The assembled genome has been deposited in DDBJ/ENA/GenBank under the accession NHTU00000000. Gaps on the scaffolds of each line were closed with reads using GapCloser 1.12 with the default parameters set (http://soap.genomics.org.cn/soapdenovo.html). Burrows-Wheeler Aligner (BWA) software and Core Eukaryotic Genes Mapping Approach (CEGMA) were used to evaluate the quality of the assembled genome.10,11
2.3. Gene prediction and annotation
Genes in the assembled ramie genome were predicted by Augustus12 with a training set of Arabidopsis thaliana with the default parameters set. We also aligned the protein sequences of A. thaliana, Morus notabilis, Ziziphus jujuba, and Vitis vinifera to the ramie ZZ1 genome using TBLASTN with an E-value cutoff of 1e-3. Genes with complete encoding sequences were screened based on three standards: (1) the presence of start and stop codons; (2) the location of start or stop codons at the region far from the end of the scaffold with more than 10 bp; and (3) a coverage of sequence alignment between the encoded protein and its homolog in other species of more than 80%. All of the predicted genes were functionally annotated by comparing their protein sequences against the SwissProt,13 Kyoto Encyclopedia of Genes and Genomes (KEGG),14 Gene Ontology (GO),15 and TrEMBL13 databases using BLASTP with an E-value threshold of 1e-4. Protein domains were identified by comparing the proteins to the InterPro database using InterProScan.16 A KEGG functional classification was performed by assigning the ramie genes to a pathway based on the KEGG database14 (www.genome.jp/kegg), and WEGO software17 (http://wego.genomics.org.cn/cgi-bin/wego/index.pl) was used to perform a GO functional classification of the genes, and to view the distribution of gene functions.
2.4. Genomic comparison and evolutionary analysis
To better understand the evolutionary placement of ramie in the plant kingdom, we compared the ramie genome with those of other species and constructed their phylogenetic trees. Protein sequences from 10 plant species—A. thaliana (Ath),18,M. notabilis (Mno),19,Z. jujuba (Zju),20,V. vinifera (Vvi),21,Citrullus lanatus (Cla),22,Glycine max (Gma),23, Gossypium raimondii (Gra),24,Oryza sativa (Osa),25,Linum usitatissimum (Lus),26 and B. nivea (Bni) were extracted to build the gene families. For alternatively spliced isoforms, only the longest proteins were used in the analysis. The protein sequences were compared by an all-to-all BLASTP search with an E-value cutoff of 1e-5, and OrthoMCL27 was then used to cluster genes from these species into families with the parameter ‘-inflation 1.5.’ The proteins in single-copy gene families underwent multiple sequence alignments by MUSCLE with the default parameters set,28 which generated a super-alignment matrix. The super-alignment matrix of protein sequences was used to construct a phylogenetic tree using RAxML29 with the maximum likelihood algorithm. The MCMCTree program was used to estimate the time of species divergence (http://abacus.gene.ucl.ac.uk/software/paml.html) using the following settings: burn-in = 5,000,000, sample number = 1,000,000, and sample frequency = 50. In addition, two fiber biosynthesis-related gene families, i.e. cellulose synthase (CesA) and WAT1-like genes, were collected and compared from five species (Bni, Mno, Zju, Cla, and Lus). The Hmmersearch program30 was used to search the members of families of the five species, based on the conserved domain of PF03552.9: Cellulose_synt (CesA) and PF00892.15: EamA (WAT1-like genes), with the default parameters set. CesA and WAT1-like proteins from five investigated species underwent multiple sequence alignments by MUSCLE28 with the default parameters set, respectively. Based on the result of alignment, the phylogenetic tree was constructed with TreeBeST31 using the neighbor-joining (NJ) method, and a bootstrap test was conducted with 100 replications.
2.5. Identification of genes subjected to positive selection
Positive selection is a process that favors the retention of beneficial mutations as well as the rapid diversification of affected genes. Positive selection at the DNA sequence level is often tested by estimating the ratio of non-synonymous to synonymous nucleotide substitutions between homologous protein-coding gene sequences, and a ratio significantly higher than 1 is considered positive selection.4 A branch-site method32 has been developed to test positive selection on individual codons along specific lineages. Using this method, branches of the phylogenetic tree are divided a priori into foreground and background lineages, and the branch under test for positive selection is defined as the foreground branch, while all other branches on the tree are the background branches. Likelihood ratio tests (LRTs) based on branch-site model A33 ascertain the selective patterns of the genes and thus determine what genes underwent positive selection. Therefore, in this study, the branch-site likelihood method was chosen for identifying positively selected genes in ramie. Briefly, orthologous gene families among ramie and four other plant species (Mno, Zju, Cla, and Gma) were obtained through a multi-reciprocal blast search. The proteins in single-copy gene families underwent multiple sequence alignments using MUSCLE, with the default parameters set.28 Positively selected genes in the single-copy gene families were detected by LRTs based on branch-site models32 of phylogenetic analysis by maximum likelihood (PAML),33 with ramie as the foreground branch, and Mno, Zju, Cla, and Gma as the background branch. P-values were computed using the χ2 statistic and corrected for multiple testing by the false discovery rate method. In order to avoid false positives in the test, genes with a low alignment quality were filtered using the following criteria: (1) a gene length of over 300 bp; (2) the number of positively selected sites ≥ 2; and (3) no gap within three amino acids around the positively selected site in the five species. Enrichment of the GO functional categories was analyzed using GOseq, which is based on the Wallenius noncentral hypergeometric distribution.34 Q values were used to determine the P-value threshold in multiple tests and analyses,35 and GO categories with Q < 0.05 were considered significantly enriched.
2.6. Genotyping by high-throughput sequencing in the FAL population
A GBS strategy was used to develop single nucleotide polymorphism (SNP) markers. A GBS pre-design for restriction enzyme selection was performed by predicting enzyme combinations and evaluating the sizes of digested fragments according to the ramie ZZ1 genome. MseI and EcoRI were selected to construct the GBS libraries, which were constructed as follows. Firstly, for each line, 0.1–1 μg of genomic DNA was incubated at 37 °C with MseI (New England Biolabs, MA, USA; NEB), T4 DNA ligase (NEB), ATP (NEB), and MseI Y adapter N containing barcodes, and then heat-inactivated at 65 °C. EcoRI (NEB) enzymes were then added to the MseI digestions to further digest the fragments at 37 °C. Then, for each sample, the digested fragments with ligations were purified with Agencourt AMPure XP (Beckman Coulter, IN, USA) and subjected to polymerase chain reaction (PCR) amplification using Phusion® Master Mix (NEB) after adding universal primer and index primer. The PCR products of each sample were purified using Agencourt AMPure XP and pooled, then run on a 2% agarose gel. Fragments of 400–450 bp (with indexes and adaptors) were cut from the gel and purified with a gel extraction kit (QIAGEN, Valencia, CA, USA). The purified products were further cleaned with Agencourt AMPure XP prior to sequencing. Finally, paired-end sequencing was performed on the selected tags using an Illumina 2500 platform by Novogene Bioinformatics Institute, Beijing, China.
2.7. Sequence data grouping, SNP identification, and linkage map construction
The sequence data from each FAL were sorted according to the barcodes in the raw reads. To ensure that reads were reliable in the following analysis, the raw data (raw reads) were filtered according to the criteria that were described by previous studies.36,37 In brief, the filtering process included three stringent steps: (1) reads with ≥10% unidentified nucleotides (Ns) were removed; (2) reads with >50% of bases having a Phred quality <5 were removed; and (3) reads with >10 nt aligned to the adapter were removed, allowing ≤10% mismatches. Next, the clean reads filtered from each individual were aligned against the assembled ramie genome using BWA software10 (settings: mem –t − 4 –k 32 –MR), and the alignment files were converted to bam files using SAMtools software38 (settings: –bS –t). If multiple read pairs had identical external coordinates, only the pair with the highest mapping quality was retained.
SNP identification was performed for the two parents and 134 FAL progenies using SAMtools software.39 To ensure SNP quality, only bases with a Phred quality ≥20 were used to identify SNPs by setting the SAMtools parameter as ‘-Q 20.’ Because the two parents were heterozygous, polymorphic markers between them were detected and classified into eight segregation patterns (ef × eg, nn × np, ab × cc, aa × bb, ab × cd, lm × ll, hk × hk, and cc × ab) according to the CP model in JoinMap 4.0 software.39 The numbers of SNPs and types of transitions or transversions were counted. Then, a Perl script was used to filter SNPs that had more than two genotypes, and polymorphic markers with a segregation pattern of aa × bb were reserved for use.
Markers containing abnormal bases or exhibiting significantly distorted segregation (P < 0.001) or non-integrity (missing data in over 30% of progenies) were filtered by JoinMap 4.0. A regression algorithm, three-time circulation sequence, and Kosambi mapping function40 were used for marker distance calculation. The linkage map was drawn using Perl SVG.
2.8. Anchoring sequenced scaffolds to the genetic map
SNP markers localized on the genetic map were used to anchor sequenced scaffolds of ZZ1 by the following method. Firstly, all of the markers were aligned against the assembled B. nivea scaffolds using BLASTN with an E-value threshold of 1e-15. Markers that were mapped to more than one scaffold were discarded. Then, the scaffold order on the chromosome was sorted by the mean value of markers on the same scaffold. In order to determine the orientation of the scaffold on the chromosome, we compared the physical order of the markers with their linkage map order. If the markers in a scaffold that had the same order between the physical and linkage map order were greater, the scaffold was considered in positive orientation. If the markers that had the same order between the physical and linkage map order were less, the orientation of the scaffold was negative and the sequence was reverse-complemented. Scaffolds in which the orientation was unknown remained in positive orientation by default. Finally, a visualized map of linkage groups that correlated with anchored scaffolds was constructed and exported to create an integrated genetic and physical map.
3. Results
3.1. Draft genome sequencing and assembly
A total of 212.8 and 91.2 million raw reads with a total size of 38.1 Gb were obtained in the short and large insert libraries, respectively. After filtering, 37.4 Gb clean sequences were used to de novo assemble the ramie genome, which resulted in 344,363 contigs and 293,578 scaffolds, with total sizes of 300,445,202 bp and 335,575,945 bp, respectively (Table 1). The maximum lengths of the contigs and scaffolds were 75,542 bp and 1,596,017 bp, respectively, and the N50 lengths of the contigs and scaffolds were 3,700 bp and 42,283 bp, respectively (Table 1). The GC content of the assembled ZZ1 genome was 36.9% (Table 1 and Supplementary Fig. S1). The K-mer analysis revealed that the average depth of K-mer was 44 (Supplementary Fig. S2), suggesting that the estimated genome size was 448 Mb, and the heterozygous and repeat ratios in the ZZ1 genome were 1.48% and 58.89%, respectively. Therefore, the sequencing depth of the genome was approximately 85 folds, and the assembled scaffold covered 74.9% of the estimated genome.
Statistics of genome assembly for ramie
| Contig | Scaffold | |
|---|---|---|
| Number of sequences | 344,363 | 293,578 |
| Total length (bp) | 300, 445,202 | 335,575,945 |
| Number of sequences with a length of more than 2 kb | 30, 733 | 30,733 |
| Maximum length (bp) | 75,542 | 1,596, 017 |
| N50 length (bp) | 3,700 | 42,283 |
| GC content (%) | 36.9 |
In order to evaluate the quality of the assembled genome, all of the sequence reads were re-aligned into the assembled genome. We found that 87.1% of the reads could be mapped to the genome, and covered 97.7% of the assembled genome. A total of 993, 187 SNPs were identified in the ZZ1 genome, 32, 062 of which (accounting for 0.012% of the genome sequence) were homologous, suggesting that the base of the genome had a highly accurate ratio. CEGMA indicated that among 248 core eukaryotic genes, 242 (97.6%) were covered by the assembled genome, 219 of which were covered completely and 23 were partially matched.
3.2. Gene prediction and annotation in the assembled genome
A total of 42,463 genes were predicted in the ramie genome, 12,664 of which were complete and the others were partial (Fig. 1a, Supplementary Table S1). Their coding sequences can be downloaded from https://figshare.com/articles/The_coding_sequences_of_42_463_genes_predicted_from_the_ramie_genome/5436268. Among the predicted genes, 26, 965, 27, 442, 29, 825, and 27, 379 encoded proteins that had significant homologs with proteins in Mno, Zju, Vvi, and Ath, respectively (Fig. 1b). A functional annotation was performed for the predicted genes, which revealed that of the 42, 463 genes, 28, 088, 29, 333, 29, 204, 40, 766, and 19,562 exhibited significant similarities to known proteins in the InterPro, KEGG, SwissProt, TrEMBL, and GO databases, respectively (Fig. 1c, Supplementary Table S2). In total, 40,922 (96.4%) genes were functionally annotated in at least one of these five databases. A GO functional classification of the predicted genes assigned 7, 836, 3, 653, and 13,257 genes to the GO classes of biological process, cellular component, and molecular function, respectively (Supplementary Fig. S3). A KEGG classification revealed that these genes were assigned to 161 pathways, and the RNA degradation pathway enriched the most genes (Supplementary Fig. S4).
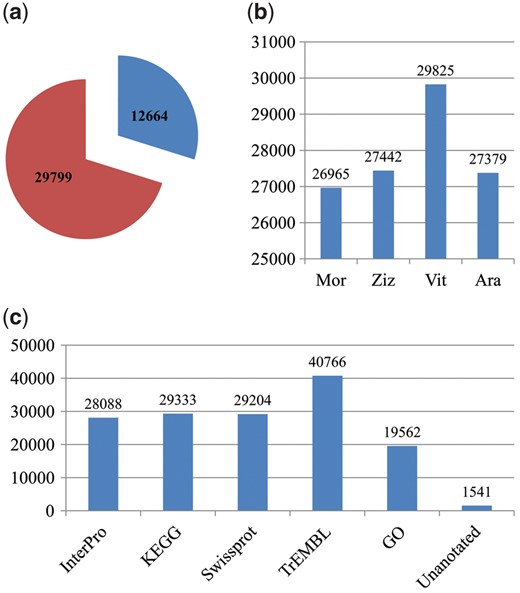
Number of genes predicted and annotated. (a) Pie chart showing that there were 12,664 and 29,799 predicted genes with complete and partial encoding sequences, respectively. (b) Histogram showing the number of genes predicted that encode proteins that are homologous to the proteins in Mno, Zju, Vvi and Ath. (c) Number of genes that were functionally annotated in five public databases.
3.3. Developing an integrated genetic and physical map of ramie
In order to develop an integrated genetic and physical map, a high-density SNP marker genetic linkage map with a total length of 1942.9 cM was constructed (Table 2). A total of 4, 338 markers were included in this map (Supplementary Table S3), 2,965 of which were bin markers (Table 2). Thereafter, the ramie genome assembly was anchored into the high-density genetic map to construct an integrated genetic and physical map. Finally, in the integrated map, 924 scaffolds of about 58.2 Mb were anchored to the corresponding chromosome, and among 4,338 markers in the genetic map, 4,304 (99.2%) were mapped to the genome (Table 2, Fig. 2).
The summary of genetic-physical integrative map of ramie
| Number of SNP markers | Number of Bin markers | Length (cM) | Average gap of Bin marker (cM) | Number of scaffolds | Length (bp) | NMAG | RMAG (%) | |
|---|---|---|---|---|---|---|---|---|
| Chr01 | 434 | 289 | 117.6 | 0.407 | 98 | 4,395, 037 | 430 | 99.1 |
| Chr02 | 387 | 255 | 122.2 | 0.479 | 87 | 4,215,206 | 386 | 99.7 |
| Chr03 | 99 | 86 | 98.3 | 1.143 | 5 | 2,000,201 | 99 | 100.0 |
| Chr04 | 462 | 302 | 213.6 | 0.707 | 107 | 5,075,558 | 460 | 99.6 |
| Chr05 | 275 | 160 | 116.8 | 0.730 | 71 | 3,035,352 | 271 | 98.5 |
| Chr06 | 339 | 211 | 140.7 | 0.667 | 62 | 2,889, 068 | 339 | 100.0 |
| Chr07 | 254 | 189 | 150.2 | 0.795 | 73 | 3,567,719 | 244 | 96.1 |
| Chr08 | 265 | 196 | 148.7 | 0.759 | 79 | 3,713,277 | 262 | 98.9 |
| Chr09 | 247 | 189 | 106.9 | 0.566 | 72 | 3,649, 974 | 244 | 98.8 |
| Chr10 | 211 | 161 | 108.2 | 0.672 | 51 | 8,666,598 | 211 | 100.0 |
| Chr11 | 177 | 150 | 105.1 | 0.701 | 35 | 3,375,825 | 177 | 100.0 |
| Chr12 | 322 | 244 | 132.9 | 0.545 | 56 | 7,107, 184 | 322 | 100.0 |
| Chr13 | 298 | 201 | 144.4 | 0.718 | 98 | 2, 971,211 | 291 | 97.7 |
| Chr14 | 568 | 332 | 237.3 | 0.715 | 30 | 3,528,490 | 568 | 100.0 |
| All | 4338 | 2965 | 1942.9 | 0.655 | 924 | 58,190,700 | 4, 304 | 99.2 |
NMAG: number of the Bin markers anchored to genome; RMAG: ratio of the Bin markers anchored to genome.
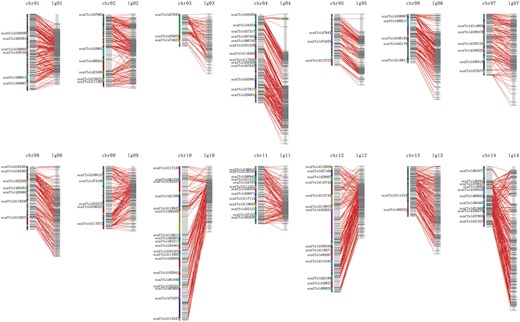
Genetic and physical integrated map. A total of 924 scaffolds of about 58.2 Mb, with 4,304 single nucleotide polymorphism markers, are on the map.
3.4. Genomic comparison and evolutionary analysis
A total of 26,366 orthologous families of genes were identified among the 10 species investigated. Among these orthologous families, 6,977 appeared in all 10 species. In addition, an orthologous analysis of ramie and four other species (Mno, Zju, Cla, and Lus) identified 8,717 common families in the five species, and 1,075 families contained 4,082 genes that appeared only in ramie (Fig. 3, Supplementary Table S4). These unique genes were markedly enriched in 32 GO terms, including the term ‘cellulose synthase (UDP-forming) activity’ (Q = 0.045) (Supplementary Table S5). Among these 4,082 genes, 5 and 10, respectively, were annotated as putative CesA and WAT1-related proteins. Analyzing the domain of proteins encoded by these 15 genes revealed that all five putative CesA proteins and 3 of 10 putative WAT1-related proteins had a corresponding conserved domain, suggesting that these five and three genes might be authentic CesA and WAT1-related genes, respectively, and that they are probably related to fiber yield in ramie. Subsequently, a phylogenetic analysis of the CesA and WAT1-related proteins of the five species (Bni, Mno, Zju, Cla, and Lus) revealed that the five CesA and three WAT1-related proteins were assigned into a branch into which none of the proteins of the other species fell (Supplementary Figs S5 and S6), confirming that the five CesA and three WAT1-related genes are unique to ramie. Among the 6,977 orthologs that appeared in the 10 species, 160 were single-copy in each species (Supplementary Table S6) and were more conservative, which can result in a more exact estimation of the evolutionary relationships between species. Therefore, these 160 single-copy orthologs were used for the phylogenetic analysis of 10 species, which resulted in the construction of a phylogenetic tree (Fig. 4). According to the phylogenetic tree, ramie and Mno were placed in a monophyletic clade that diverged about 51.4 million years ago, suggesting that ramie has the closest relationship with Mno among the species investigated (Fig. 4).
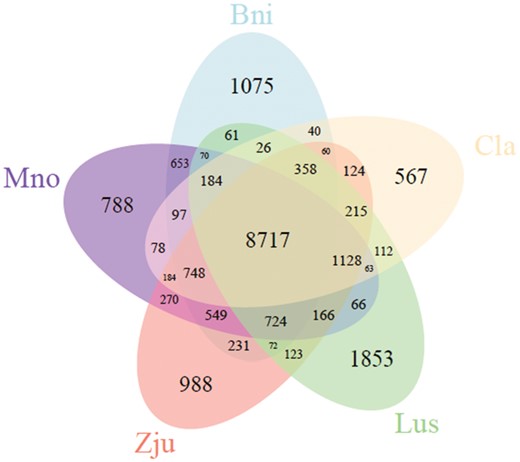
Venn diagram of orthologous gene families among ramie and four other species. There are 1,075 gene families that are unique to ramie.
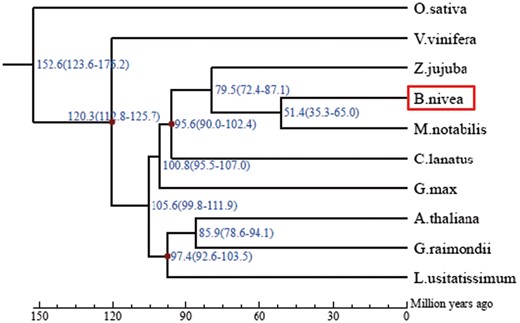
Phylogenetic tree of ramie and nine other species, constructed based on their genomes. According to the tree, ramie has a relatively close relationship with Morus notabilis, and they diverged about 51.4 million years ago.
3.5. Positively selected genes
A total of 106 positively selected genes were identified in ramie (Supplementary Table S7). Of these, six functioned as transcription factors, including two NAC genes. These 106 genes were markedly enriched in 21 GO terms, including one interesting term, “N compound metabolism”, which was enriched by 22 genes (Q = 0.001) (Supplementary Table S8). The positive selection of N metabolism-related genes could be responsible for crude protein biosynthesis and vegetative growth in domesticated ramie.
4. Discussion
4.1. New genetic and genomic resources
Ramie is an important natural fiber in the textile industry because of its ability to retain shape, reduce wrinkling, and introduce a silky luster to the appearance of a fabric. There are also some flaws in ramie fiber, including confined elasticity and elongation potential, and the stiff and brittle nature of the cloth. Therefore, a variety with better quality fiber would be a desirable outcome of ramie breeding. However, trait improvement in ramie has been hindered by a shortage of genetic and genomic resources. Although a considerable number of ramie simple sequence repeat (SSR) markers have been developed,41,42 only one expanded and low-density molecular marker genetic map has been produced, and few QTLs have been detected for agronomic traits.5,43 There are probably still many QTLs missing, as shown by the QTL regions without markers observed in our low-resolution map. Therefore, a high-resolution ramie genetic map is needed. However, because the screening of population genotypes by SSR markers is time-consuming and labor-intensive, it is difficult to construct a high-resolution genetic map using SSR markers, even with sufficient markers. Moreover, few genes have been functionally characterized in ramie, and its genomic information is entirely unknown. Recently, the ramie transcriptome has been de novo assembled and characterized in several studies, and large numbers of expressed tag sequences (ESTs) were identified.2,4,44,45 However, because these ESTs were assembled using short read sequences, they contained many redundant sequences, and about 80% partial sequences.4 As a result, these sequences have not been used to uncover the mechanism of trait formation, or to improve traits.
In the present study, a draft ramie genome was de novo assembled for the first time. Although the draft genome only covered about 74.9% of the estimated genome and had only an approximately 42.3-kb N50 scaffold, 97.6% of the core eukaryotic genes were covered in the draft genome. In other words, this genome assembly covered about 97% of ramie genes, suggesting that it could be used for further research in functional genomics. This genome is the first to be determined in the family Urticaceae, which comprises 45 genera with more than 700 species, and will be important for understanding the evolutionary placement of Urticaceae in the plant kingdom. Our results indicate that ramie has a close relationship with Mno, a species in the family Moraceae, suggesting that the evolutionary placement of Urticaceae as analyzed by genomic comparison is in agreement with the angiosperm phylogeny Group III (APG III) system.46 In addition, 42,463 genes were predicted, 96.3% of which were functionally annotated. Therefore, the number of annotated genes identified in the genome is far more than in the transcriptome.2,4 Large numbers of annotated genes were identified, which will not only be useful for the characterization of the functions of ramie trait-related genes but also provide a basis for uncovering the mechanism of trait formation.
Furthermore, we developed the first high-resolution genetic map of ramie, which is not only an important tool for QTL identification but can also be used for assembling genome sequences into the chromosome. By anchoring the genome sequence to the chromosome, an integrated genetic and physical map was constructed. This will make genome utilization easier, particularly in fine-scale QTL mapping and cloning. The size of the assembled genome was about 335 Mb, and the high-density SNP map contained 2,965 bin markers. Therefore, the average physical distance between two bin markers was approximately 151 kb. However, because only four libraries with different fragment sizes were used for performing genomic analysis, the N50 length of scaffolds in the assembled genome was only about 42 kb. In other words, in the genome assembled, there were large numbers of sequence fragments that were smaller than the average physical distance between two bin markers on the map, which resulted in only 924 scaffolds of about 58.2 Mb (17.4%) that were assigned to the chromosomal location. Although 82.6% of the genome sequences had uncertain chromosomal locations, these sequences would still be useful in genetic and molecular studies of ramie, such as gene discovery, marker development, etc. Indeed, many species whose genome sequences have not been assigned to a chromosome have been widely used.19,26
4.2. Unique fiber biosynthesis-related genes are probably responsible for high fiber yield in ramie
Unlike cotton fiber, which is an epidermal seed fiber, ramie fiber is a vegetative bast organ involved in sugar metabolism and cellulose synthesis; therefore, it has value in biological research into organogenesis and evolution. A major component of ramie fiber is cellulose, which is a chain of glucose residues. Cellulose biosynthesis can be divided into three steps: initiation of the sugar chain, elongation, and termination of the sugar chain.47 The initiation and elongation of cellulose is performed by CesA, which is a rosette-shaped enzyme complex in the plant cell plasma membrane,48 and catalytic subunits of CesAs are central catalysts involved in the generation of plant cell wall cellulose.49,50,CesA genes have been extensively studied in plants such as Arabidopsis, rice, cotton, and barley.51–54 Many CesA genes have also been reported in ramie.2,55,56 However, the mechanism by which ramie was domesticated as a crop with plentiful fiber in its stem bark is unknown. In this study, 16 putative CesA genes were identified in ramie (Supplementary Fig. S5). Based on an orthologous analysis among ramie and four other species (Mno, Zju, Cla, and Lus), five were found to be unique to ramie, which was validated by phylogenetic analysis. Moreover, the GO term ‘cellulose synthase (UDP-forming) activity’ was markedly enriched by these unique ramie genes. By comparing the sequence of five unique CesA ramie genes with the transcriptome reported in our previous study, we found that all five genes have ESTs (Unigene12687, CL3101.Contig2, Unigene306, Unigene10248, and Unigene26554), suggesting that these predicted genes are authentic. Interestingly, all five genes exhibited relatively higher expression levels in stem bark than in other organs, which indicates that they are probably involved in bast fiber biosynthesis.2 Therefore, these unique CesA genes are probably responsible for high fiber yield in ramie.
WAT1 encodes a tonoplast-localized protein involved in secondary wall formation in fibers in Arabidopsis.57 A transcriptomic comparison of wild and cultivated ramie showed that the WAT1-related gene underwent positive selection, suggesting that it is probably related to the fiber yield of ramie, and that positive selection for this gene is probably responsible for the improvement of fiber yield in domesticated ramie.4 In this study, 13 putative ramie WAT1-related genes were identified (Supplementary Fig. S6). In addition, genome comparison identified 10 putative WAT1-related genes that were only found in ramie among the five species investigated. However, of these 10 genes, only three (Bni_g24740, Bni_g33701, and Bni_g35790) had the conserved domain of the WAT1-related protein. The absence of a conserved domain in the other seven residual genes was probably due to either an annotation error or an incomplete gene sequence. Therefore, three WAT1-related genes were included in the phylogenetic analysis, which confirmed their uniqueness in ramie among the five species investigated, and they are probably responsible for producing plentiful fiber in the ramie stem bast.
4.3. Positive selection of N metabolism-related genes is probably responsible for vegetative growth and crude protein biosynthesis in domesticated ramie
N is necessary for optimum growth and development in crop plants. Of the nutrient elements required by plants, N most often limits crop yield.58 In plants, N absorbed from the soil is converted to organic N compounds such as proteins, chlorophyll, and nucleic acids, which play numerous key roles in plant biochemistry and are essential components of enzymes, cell walls, and a vast array of other cellular components.59 Consequently, N compound metabolism is important for plant growth, and a deficiency in the supply of N would have a profound effect on plant survival and yield.
Primary N utilization during vegetative growth involves three steps, i.e. uptake, translocation, and assimilation.60 N assimilation is a complex metabolic process, and six key enzymes, nitrate reductase (NR), nitrite reductase (NiR), glutamine synthetase (GS), glutamate synthase (GOGAT), asparagine synthetase (Asp), and asparagine aminotransferase (AspAT), are involved.61 There are three main steps involved in the metabolism of N assimilation. Firstly, when the N is absorbed and transferred into the cell, it is first reduced to ammonium by NR and NiR. Then, the ammonium enters the GS and GOGAT cycle where it is converted to glutamine and glutamate. Finally, the glutamate amino group can be transferred to different amino acids by Asp and AspAT,61 and these amino acids are used to synthesize N compounds.
Ramie exhibits vigorous vegetative growth, along with a high crude protein content in its tissues. Recently, three N metabolism-related GS genes were identified in ramie,62 and one of these, BnGS1-2, was overexpressed in transgenic tobacco, which caused significant increases in fresh weight, dry weight, and plant height, along with a higher soluble protein content and higher total N content.63 Therefore, these previous studies further validated that, in ramie, N metabolism-related genes play important roles in vegetative growth and crude protein biosynthesis. A total of 22 positively selected genes were found to enrich the GO term ‘cellular nitrogen compound metabolic process’, so they may be N metabolism-related genes. Among the 22 genes, one encodes the Asp protein, which is a key enzyme in N-assimilation.61 In addition, three genes encode transcription factor proteins, and seven are involved in DNA/RNA activity. Previous studies have found that N metabolism is regulated by the BTB gene64 and is affected by abscisic acid (ABA) and auxin;65 here, we identified three positively selected genes that encode an ABA and an auxin-related protein, and a BTB/POZ domain protein. The other eight genes enriched in this GO term encode an uncharacterized protein. The rapid diversification of these genes is probably responsible for the high crude protein content and vigorous vegetative growth of domesticated ramie.
5. Accession numbers
The sequence reads were deposited in the NCBI-short read archive (SRA) database under the accession number SRX2843758. The WGS accession number of genome sequence assembled in GenBank database was NHTU00000000.
Funding
This work was supported by grants from the National Natural Science Foundation of China (31571725), the Agricultural Science and Technology Innovation Program of China (CAAS-ASTIP-IBFC), and the National Modern Agro-industry Technology Research System of China (nycytx-19-E16).
Conflict of interest
None declared.
Supplementary data
Supplementary data are available at DNARES online.
References
TreeSoft: TreeBeST (http://treesoft.sourceforge.net/treebest.shtm).
Author notes
Chan Liu and Liangbin Zeng contributed equally to this work.
Edited by Dr. Satoshi Tabata
