


Summary
To determine trends in the diagnostic distribution of esophageal motility disorders after implementation of the Chicago Classification Version 3.0 (CC V3.0) for interpretation of high-resolution manometry (HRM) studies compared to non-Chicago Classification criteria. Retrospective trends analysis of patients with an HRM study conducted at a single center from January 1, 2013 to September 30, 2015. The implementation of the CC V3.0 for manometry interpretation occurred in September 2014. Patient charts were manually reviewed for data collection including demographics and HRM diagnoses. The prevalence and relative risks (RR) of CC V3.0 diagnostic categories (i.e. normal, indeterminate, achalasia, and EGJ outflow obstruction [EJGOO], and major and minor motility disorders) were calculated before and after CC V3.0 implementation. Four hundred sixty-five HRM studies were included in the study including 268 before and 179 after CC V3.0 implementation. The mean ± SD age was 54 ± 15.4 years and 59.8% were female (n = 278). The percentage with indeterminate diagnosis decreased from 35.3% before CC V3.0 implementation to 16.8% after implementation (adjusted RR 0.5, 95%CI 0.30–0.70, p < 0.001). The percentage with a major motility disorders decreased from 13.9% to 7.3% (adjusted RR 0.5, 95%CI 0.2–1.0, p < 0.001). The percentage with EJGOO and minor diagnoses increased from 1.4% to 14.5% and 11.9% to 22.9%, respectively. The percentage with achalasia and normal diagnosis did not change over the study period. Implementation of CCV3.0 was associated with changes in the distribution of esophageal motility diagnoses in clinical practice. The percentage of indeterminate and major diagnosis decreased and EGJOO and minor diagnoses increased. The decrease in the number of indeterminate studies suggests that the CC V3.0 may clarify the criteria for the interpreting physician. The increase in studies with a diagnosis of EGJ outflow obstruction may reflect the heterogeneity of disorders with clinically relevant outflow obstruction.
INTRODUCTION
High-resolution esophageal manometry (HRM) is considered the gold standard diagnostic test for esophageal motility disorders.1–3 The HRM catheter has recording sites every 1–2 cm spanning from the hypopharynx to the stomach, while the conventional esophageal manometry has 3–8 pressure sensors. The increased number of recording sites provides sufficient data points to generate three-dimensional topographical plots (Clouse plots).4 HRM with esophageal pressure topography (EPT) clearly displays the spatial and temporal relationship of esophageal peristalsis.5 The initial most widely used classification system for conventional line tracing esophageal manometry, as described by Spechler and Castell in 2001, was imperfect when applied to HRM-EPT as the metrics of HRM-EPT differ from conventional line tracing manometry.6 The Chicago classification (CC) was therefore released in 2009 as a hierarchical approach to interpret HRM-EPT studies that defines discrete metrics for the diagnosis of esophageal motility disorders.7,8 The most recent being version 3.0 (V3.0) was released in 2015.9,10
The Chicago classification V3.0 divides esophageal motility diagnoses into four categories: achalasia and esophagogastric junction outflow tract obstruction (EGJOO), major motility disorders (distal esophageal spasm, hypercontractile esophagus (jackhammer esophagus), and aperistalsis), minor motility disorders (ineffective esophageal motility and fragmented peristalsis), and normal. Conversely, the Spechler and Castell operational scheme had five categories: inadequate LES relaxation (classic achalasia and atypical disorders of LOS relaxation), uncoordinated contraction (diffuse esophageal spasm, hypercontraction, nutcracker esophagus, isolated hypertensive LES), hypocontraction (ineffective esophageal motility), nonspecific esophageal motility abnormalities, and normal.
In theory, the CC V3.0 should result in fewer nondiagnostic manometry studies due to the numeric physiologic metric cutoffs (distal latency, distal contractile integral, and integrated relaxation pressure) and hierarchical approach to HRM analysis compared to the Spechler and Castell scheme. While HRM-EPT has been shown to have superior inter-rater agreement and diagnostic accuracy when compared to conventional line tracings, variability in the level of competency of the performing technicians and interpreting physicians persists.1,2,11 The impact of implementation of the CC V3.0 in clinical practice has not previously been demonstrated. The objective of this study is to determine the diagnostic distribution and change in diagnoses before and after implementation of the CC V3.0 for HRM-EPT interpretation at a tertiary care motility referral center that was previously using the Spechler and Castell scheme.
METHODS
Study population
This was a retrospective analysis of all patients with an HRM study conducted at a regional esophageal motility referral center (tertiary referral center) from January 1, 2013 to September 30, 2015. We compared the percentage of HRM diagnosis before and after implementation of the CC V3.0. The implementation of the CC V3.0 occurred in September 2014. Manometry reports from January 1, 2013 to September 30, 2015 were obtained using the Provation software (Provation Medical, Minneapolis, MN) to extract demographics (age, sex), clinical variables (symptoms, indications), HRM variables (esophageal pressure metrics, diagnoses, and interpretation), and the interpreting physician. Studies were excluded from our analysis if the study was an aborted procedure or uninterpretable (e.g. coiled catheter) or studies without available interpretation (n = 59). We limited our analysis to interpreting physicians with more than 10 years each of interpreting manometry studies at a tertiary center, and who read manometry studies over the entire study interval and were not previously trained in the CC V3.0 who then adopted the policy and algorithmic approach to reading manometry (JF and KP).
High-resolution manometry
All of the manometry procedures were performed by a single trained endoscopy technician. A solid-state HRM manometry catheter was used for all of the studies during the study interval (Sierra Scientific Instruments, Los Angeles, CA). The HRM-EPT tracings were analyzed with the ManoView software (Sierra Scientific Instruments). Two physicians were excluded from the final analysis as they did not interpret manometry over the entire study interval.
Classification of motility disorders
If a diagnosis was not clearly stated in the manometry impression, it was categorized as indeterminate. Remaining diagnoses were grouped according to the major diagnostic categories per the CC V3.0 (normal, achalasia and EGJOO, major and minor motility disorders). The interpretations from the manometry studies that were read using the Spechler and Castell operational scheme were grouped into the most congruent diagnostic group according to the CC V3.0 (Appendix 1).
Statistical analysis
We calculated characteristics (age, sex, and HRM study indication) of patients with an HRM study in the time period before and after CC V3.0 implementation. Characteristics were compared using t-tests for continuous variables and χ2 tests for categorical variables. The percentage of each HRM diagnosis (i.e. normal, achalasia, and EGJOO, major and minor motility disorders) was calculated before and after CC V3.0 implementation. Next, using Poisson regression models, we calculated risk ratios for each HRM diagnosis, separately, associated with implementation of the CC V3.0. We conducted three nested models. Model 1 was unadjusted. Model 2 was adjusted for age and sex of the patient. Model 3 included variables in Model 2 but also including an indicator variable for the interpreting physician as an additional covariate. Stata V12.1 (StataCorp LP, Texas, USA) was used for all statistical analysis.
RESULTS
Study population
A total of 855 HRM studies were performed over the study interval, 59 were excluded as they were aborted or incomplete, and another 331 were excluded as they were interpreted by physicians who did not read manometry over the entire study period (e.g. did not read studies both before and after CC V3.0 implementation) (Fig. 1). The remaining 465 manometry studies were included. The mean patient age was 54 years (±15.4) and 59.8% were female. The referral indications for esophageal manometry were esophageal GERD symptoms (6.8%), extra-esophageal GERD symptoms (30.5%), dysphagia (54.8%), motility disorder evaluation (1.9%), surgical assessment (4.7%), and other (1%). There was a significant difference in the number of referrals for surgical assessment and for extra-esophageal GERD symptoms after implementation of the CC V3.0 (P≤ 0.001 and P= 0.016, respectively) (Table 1).
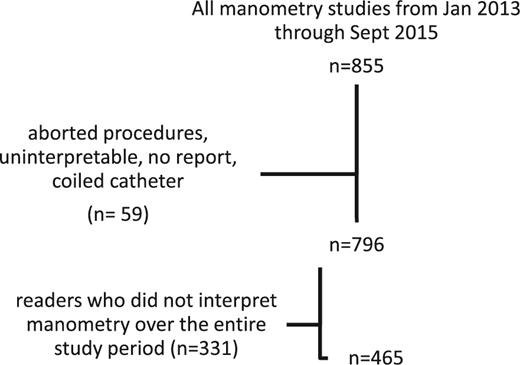
Study cohort flow diagram.
Characteristics of the study population overall, and by time periods before and after the Chicago classification V3.0 policy implementation on 09/01/2014
| Overall (n = 465) | Before CC V3.0 (n = 268) | After CC V3.0 (n = 179) | P-value | |
|---|---|---|---|---|
| Mean Age (std. dev)—(year) | 54.1 (±15.4) | 54.4 (±15.9) | 53.7 (±14.6) | 0.5 |
| Female—no. (%) | 278 (59.8) | 175 (61.2) | 103 (57.5) | 0.4 |
| Indications | ||||
| Esophageal GERD symptoms—no. (%) | 32 (6.9) | 21 (7.3) | 11 (6.1) | 0.6 |
| Extra-esophageal GERD symptoms—no. (%) | 142 (30.5) | 99 (34.6) | 43 (24) | 0.016 |
| Dysphagia—no. (%) | 255 (54.8) | 154 (53.8) | 101 (56.4) | 0.6 |
| Motility disorder evaluation—no. (%) | 9 (1.9) | 5 (1.7) | 4 (2.2) | 0.7 |
| Surgical assessment—no. (%) | 22 (4.7) | 4 (1.4) | 18 (10) | <0.001 |
| Other†– no. (%) | 5 (1) | 3 (1) | 2 (1.1) | 0.9 |
†includes the following indications: not reported, clinical trial, h1n1, weight loss, recurrent pneumonia, parkinson's, muscle spasms.
Outcomes after implementation of CC V3.0
The number and percentage of a diagnoses quarter is shown in Fig. 2. The CC V3.0 was implemented in quarter 7, depicted by a vertical line in Fig. 2. The number of normal diagnoses and achalasia diagnoses did not change significantly over the study interval; however, there was a significant increase in EGJOO and minor motility disorder diagnoses (P< 0.001 and P= 0.003). The number of indeterminate diagnoses and major motility diagnoses decreased significantly after quarter 7 (P< 0.001).
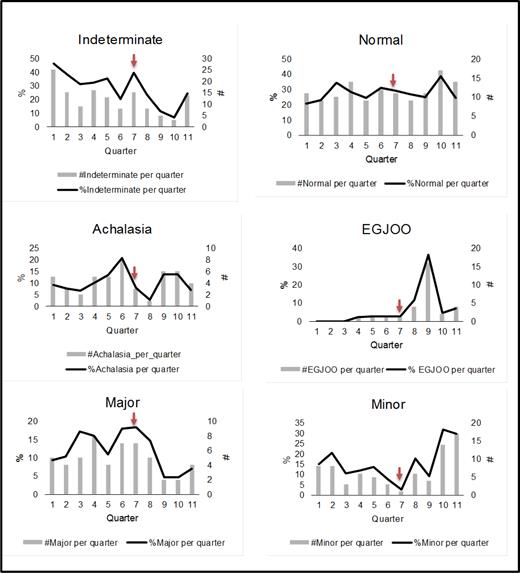
Manometric diagnostic trends over study period by quarter. Arrow at Q7 denotes change to CC V3.0 interpretation.
There was no change in the rate of an achalasia diagnosis or a normal diagnosis postimplementation of CC V3.0. The adjusted rate ratio for an EGJOO diagnosis and for a minor motility disorder diagnosis was significantly higher postimplementation of CC V3.0 (IRR 11.3, 95% CI 3.9–32.7, P< 0.001; IRR 1.7, 95% CI 1.1–2.7, P= 0.01). The adjusted rate of a major motility disorder decreased postimplementation of CC V3.0 (IRR 0.5, 95% CI 0.2–1, P= 0.05), as it did for an indeterminate diagnosis (IRR 0.49, 95% CI 0.3–0.7, P= 0.001) (Table 2).
Incident rate ratios of HRM diagnoses
| Diagnosis | Before | After | P Value |
|---|---|---|---|
| Achalasia—no. (%) | 31 (10.8) | 17 (9.5) | 0.6 |
| Risk ratio | |||
| Model 1† | 1 (reference) | 0.9 (0.5–1.6) | 0.6 |
| Model 2‡ | 1 (reference) | 0.8 (0.5–1.6) | 0.7 |
| Model 3§ | 1 (reference) | 0.9 (0.5–1.7) | 0.9 |
| EGJOO—no. (%) | 4 (1.4) | 26 (14.5) | <0.001 |
| Risk ratio | |||
| Model 1 | 1 (reference) | 10.3 (3.6–29) | <0.001 |
| Model 2 | 1 (reference) | 11 (3.8–31) | <0.001 |
| Model 3 | 1 (reference) | 11.3 (3.9–32) | <0.001 |
| Major—no. (%) | 40 (13.9) | 13 (7.3) | 0.02 |
| Risk ratio | |||
| Model 1 | 1 (reference) | 0.5 (0.2–0.9) | 0.04 |
| Model 2 | 1 (reference) | 0.5 (0.2–0.9) | 0.04 |
| Model 3 | 1 (reference) | 0.5 (0.2–1) | 0.05 |
| Minor—no. (%) | 34 (11.9) | 41 (22.9) | 0.002 |
| Risk ratio | |||
| Model 1 | 1 (reference) | 1.9 (1.2–3) | 0.005 |
| Model 2 | 1 (reference) | 1.9 (1.2–3) | 0.004 |
| Model 3 | 1 (reference) | 1.7 (1.1–2.7) | 0.016 |
| Normal—no. (%) | 76 (26.6) | 51 (28.5) | 0.6 |
| Risk ratio | |||
| Model 1 | 1 (reference) | 1.1 (0.7–1.5) | 0.7 |
| Model 2 | 1 (reference) | 1.0 (0.7–1.5) | 0.7 |
| Model 3 | 1 (reference) | 1.0 (0.7–1.5) | 0.8 |
| Indeterminate—no. (%) | 101 (35.3) | 30 (16.8) | <0.001 |
| Risk ratio | |||
| Model 1 | 1 (reference) | 0.5 (0.3–0.7) | <0.001 |
| Model 2 | 1 (reference) | 0.4 (0.3–0.7) | 0.001 |
| Model 3 | 1 (reference) | 0.5 (0.3–0.7) | <0.001 |
†Model 1 = unadjusted values.
‡Model 2 = adjusted for age and sex.
§Model 3 = adjusted for age and sex and interpreting physician.
DISCUSSION
The interpretation of esophageal motility studies has changed dramatically over the past 10 years with the widespread adoption of HRM-EPT. The CC V3.0 is currently the most widely accepted operational scheme in use for the interpretation of HRM-EPT. This is the first study to determine the impact of using CCV3.0 for interpretation of HRM-EPT studies in a clinical practice not previously using the diagnostic schema. We observed a significant 50% decrease in the risk of a major motility disorder, in addition to a 50% decrease in the risk of an indeterminate diagnosis. There was nearly a two-fold increase in the risk of a minor motility disorder diagnosis after CC V3.0 implementation, which is dwarfed in comparison to the ten-fold increase in the risk of EGJOO post CC V3.0 implementation. This was somewhat expected, as EGJOO was not previously described by Spechler and Castell.
A significant strength of the CC V3.0 is that it gives strict parameters for each manometric diagnosis and clearly outlines parameters for a normal study. We speculate that this was the primary reason for a reduced rate of indeterminate studies post CC V3.0, and an increased rate of a minor motility disorder and EJGOO diagnoses. It is likely that a large number of studies read as minor motility diagnosis under CC V3.0 would have been read as indeterminate studies under the Spechler and Castell scheme. The lack of a change in the rate of an achalasia diagnosis is not surprising. Achalasia is the most important diagnosis to make by esophageal manometry and interpreters are typically careful to avoid missing this diagnosis, irrespective of the operational scheme. We were unable to determine differences in specific types of achalasia (Type I, II, III) as these diagnoses are not present in the Spechler and Castell scheme.
The strengths of this study are the large sample size, low risk of technical variability with regards to the procedure (the same nurse performed all studies), and the defined time frame of CC V3.0 implementation which permitted a pre- and postimplementation analysis. We also restricted the study to only include interpretations from physicians who read manometry over the entire study period, limiting confounding from physician drop out. This is the first study showing outcomes of implementation of CC V3.0 in a clinical practice.
We recognize several limitations in this study. This was a retrospective study and data on diagnoses were obtained from the final reports signed by the interpreting physician. There were also a limited number of interpreting physicians (n = 2), so these results may not be generalizable to larger practice settings. Another potential weakness is that the interpretations pre-CC V3.0 were adjusted to correspond with a CC V3.0 diagnosis.
The change in operational scheme to CC V3.0 appears to change the interpreting physician's behavior, resulting in fewer vague descriptive study interpretations with no clear diagnosis. We would strongly encourage esophageal motility centers to transition to the CC V3.0 for HRM interpretation as this operational scheme reduces the rate of indeterminate interpretations.11 We speculate that the lower rate of indeterminate studies may be clinically beneficial as this could result in fewer unnecessary follow-up tests or treatments. As EJGOO represents the largest proportion of new diagnoses, further work is needed to determine if treatment decision making and patient outcomes are affected. The increase in EGJOO diagnoses may lead to more patients receiving therapy such as botulinum toxin injections, balloon (nonpneumatic or pneumatic) dilations, and surgical myotomy. Additionally, many patients who are diagnosed with EGJOO often undergo additional testing (i.e. esophagram with tablet, CT, or endoscopic ultrasound) to try to elucidate a cause for the findings. Future studies are needed to determine if CC V3.0 HRM interpretations changes treatment decisions, therapeutic options, and ultimately patient outcomes compared to pre-CC V3.0 interpretation.
References
APPENDIX 1.
Comparison of CC V3.0 and Spechler and Castell operational schemes
| Chicago classification | Spechler and Castell | ||
|---|---|---|---|
| Achalasia and EGJOO | Type I achalasia | Inadequate LES Relaxation | Classic achalasia |
| Type II achalasia | Atypical disorders of LES relaxation | ||
| Type III achalasia | |||
| EGJOO | |||
| Major disorders of peristalsis | Hypercontractile esophagus (jackhammer) | Uncoordinated Contraction | Diffuse esophageal spasm |
| Distal esophageal spasm | Hypercontraction | Nutcracker esophagus | |
| Absent contractility | Isolated Hypertensive LES | ||
| Minor disorders of peristalsis | Ineffective esophageal motility | Hypocontraction | Ineffective esophageal motility |
| Fragmented peristalsis | |||
| Normal | Normal | ||
Author notes
Guarantor of the Article: Andrew J. Gawron
Specific author contributions: Study design, data collection and review, drafting the manuscript: Patrick Laing; Approves submission of the final draft: Patrick Laing, Adam Bress, John Fang, Kathy Peterson, Doug Adler, Andrew Gawron; Study design, statistical analysis: Adam Bress; Study design, manometry interpretation, review of study outcomes: John Fang; Manometry interpretation, review of study outcomes: Kathy Peterson; Study design, review of study outcomes: Doug Adler; Study design, data collection and review, drafting the manuscript, statistical analysis: Andrew Gawron.
Conflicts of interest: John Fang and Andrew Gawron have consulting agreements with Medtronic.
