


Abstract
To prospectively determine evaluability of routine cardiovascular magnetic resonance (CMR) diagnostic modules in a referral population of implanted rhythm device all-comers, and to establish a device-dependent CMR imaging strategy to achieve optimal image quality.
One hundred and twenty-eight patients with cardiac implantable electronic devices [insertable cardiac monitoring system, n = 14; implantable loop-recorder, n = 21; pacemaker, n = 31; implantable cardioverter-defibrillator (ICD), n = 50; and cardiac resynchronization therapy defibrillator (CRT-D), n = 12] underwent clinically indicated CMR at 1.5 T. CMR protocols were tailored to the clinical indication and consisted of cine, perfusion, T1-/T2-weighted, late-gadolinium enhancement (LGE), 3D angiographic, and post-contrast cine spoiled gradient echo (SGE) scans. Image quality was determined using a 4-grade visual score per myocardial segment. Segmental evaluability was strongly influenced by device type and location with the highest proportion of non-diagnostic images encountered in the presence of ICD/CRT-D systems. Cine steady-state free-precession (SSFP) imaging was found to be mostly non-diagnostic in ICD/CRT-D patients, but a significant improvement of image quality was demonstrated when using SGE sequences with a further incremental improvement post-contrast resulting in an overall four-fold higher likelihood of achieving good image quality. LGE scans were found to be non-diagnostic in about one-third of left-ventricular segments of ICD/CRT-D patients but were artefact-free in > 94% for all other device types.
Device type and location constitute the main independent predictors of CMR image quality and thus, need to be considered during protocol adaptation. Most notably, post-contrast SGE cine imaging proved superior to conventionally used SSFP sequences. Thus, following the proposed device-dependent CMR imaging strategy, diagnostic image quality can be achieved in the majority of device patients.
Introduction
Recent large-scale studies proved the safety of extrathoracic magnetic resonance imaging in patients with non-MR-conditional pacemakers or implantable cardioverter-defibrillators (ICDs) at 1.5 T.1 Overall an estimated 60% of all device patients have been forecasted to become in need of a magnetic resonance examination over a 10-year time period; this, in combination with an increasingly aging population suffering from multiple comorbidities will invariably lead to a high proportion of device patients in need of a comprehensive cardiovascular magnetic resonance (CMR) examination.2,3 Considering the established high diagnostic performance of CMR imaging together with its unique capability to characterize myocardial tissue, the requirement for a highly diagnostic imaging strategy even in patients with non-MR-conditional cardiac implantable electronic devices has surfaced.
However, CMR imaging in device patients is more demanding since generator- or lead-related artefacts will impair image quality of the heart and large thoracic vessels to a variable degree and possibly, render most conventionally used basic cardiac imaging modules non-diagnostic.4 As an example, particularly the widely employed steady-state free-precession (SSFP) cine sequences are more prone to susceptibility-induced phase error artefacts due to the underlying principles of the pulse sequence and, thus, are inherently vulnerable to generator related field distortion. Since cine imaging for assessment of regional wall motion and global ventricular volumes and function can be considered a cornerstone of CMR imaging, significant improvements are mandatory to achieve optimal results in device patients.
Consequently, the aims of the current study were as follows. First, to determine image quality of all conventionally employed diagnostic CMR imaging modules depending on device type. Second, to assess the value of spoiled gradient echo (SGE) cine imaging before and after application of a gadolinium-containing contrast agent for the assessment of ventricular function. Finally, we focused on the development of an interactive decision-making based CMR imaging strategy to ensure optimal imaging results in all device types.
Methods
Patient population
The study was conducted in accordance with the local institutional review board and the standards of the University of Leipzig ethics committee. One hundred and twenty-eight consecutive patients with a cardiac implantable electronic device i.e. either pacemaker (PM), implantable cardioverter-defibrillator (ICD), cardiac resynchronization therapy device with defibrillator function (CRT-D) or implantable loop recorder (ILR) and with a clinical indication for CMR imaging were prospectively enrolled after written informed consent was obtained. Patients were excluded if intrinsic heart rate was less than 40 bpm, and device implantation had been performed less than 6 weeks ago or in the presence of abandoned leads. All patients underwent routine chest X-ray prior to the CMR examination in order to measure the minimal distance between the inferior border of the device and the heart silhouette in anterior–posterior projection. Subgroups were separated according to device type: insertable cardiac monitoring system (LINQ, Medtronic), implantable loop recorder (ILR), right-sided pacemakers (PMright), left-sided pacemakers (PMleft), implantable cardioverter defibrillator (ICD), and cardiac resynchronization therapy defibrillator (CRT-D).
CMR imaging
All measurements were done on a 1.5 T MR scanner system (Philips Ingenia, Best, The Netherlands) equipped with Omega HP gradients (45 mT/m, 200 T/m/s) using a 28-element array coil with full in-coil signal digitalization combined with optical transmission. During the CMR examination, all patients were lying in a supine position (‘head first - arms down’). CMR scanning protocols were tailored to the clinical indication and in general, in order to keep the exposure time of device patients within the static magnetic field/switching gradients to a minimum all CMR examinations were limited to less than 30 min during which all CMR imaging modules could be successfully completed in all patients. Following current recommendations, whole-body specific absorption rate (SAR) was restricted to 2 W/kg bodyweight. Patients were continuously monitored throughout the entire procedure by an experienced rhythmologist (>12 years of experience) and a cardiac device programmer was present in the console room of the scanner suite; physiologic monitoring consisted of vector-surface ECG, peripheral pulse oximetry, respiratory motion pattern, and non-invasive blood pressure measurements; throughout the entire procedure visual and voice contact with the patient was maintained. In addition, CMR imaging data were continuously evaluated during the imaging procedure by a cardiological CMR imaging expert (>20 years of experience).
For assessment of cardiac dimensions and function, SSFP cine imaging was first attempted; if the first acquired SSFP cine geometry was found to be of non-diagnostic image quality, SSFP imaging was subsequently replaced with a SGE sequence. In all patients, cine SGE imaging was performed in all standard cardiac geometries (three short-axis views and a 2-, 3-, and 4-chamber view) before and after application of a Gad-containing contrast agent. Contrast agent bolus infusion (0.1 mmol/kg bodyweight) was used for either adenosine-stress dynamic perfusion or 3D angiographic image data acquisition depending on the clinical indication. Before adenosine infusion, a test perfusion scan (three slices of short-axis geometry) was routinely performed in order to identify the degree of image quality impairment on SSFP- or SGE perfusion scans; if the SSFP perfusions scans were found to be of poor or non-diagnostic image quality, SGE perfusion imaging was carried out instead in the identical geometry. Myocardial tissue characterization was integrated in the examination protocol as required and consisted of T1- and T2-weighted blackblood turbo-spin echo (TSE) together with subsequent 3D late-gadolinium enhancement (LGE) imaging. The inversion-recovery prepulse delay was determined from an inversion prepared cine scan (Look-Locker) and individually adjusted to optimally suppress signal from normal myocardium. CMR sequence parameters are detailed in Table 1.
CMR imaging sequence parameters
| Sequence type | Parameters | Parameter values |
|---|---|---|
| Cine SSFP | TR/TE/flip angle (ms/ms/degrees) | 6.7/3.4/60 |
| Spatial resolution (mm × mm × mm) | 1.7 × 1.7 × 8.0 | |
| Phases per cardiac cycle | 30 | |
| SENSE factor | 1.8 | |
| SAR (W/kg bodyweight) | 0.5 | |
| Cine SGE | TR/TE/flip angle (ms/ms/degrees) | 5.2/3.1/15 |
| Spatial resolution (mm × mm × mm) | 1.7 × 1.7 × 8.0 | |
| Phases per cardiac cycle | 30 | |
| SENSE factor | 1.8 | |
| SAR (W/kg bodyweight) | 0.1 | |
| T1W blackblood TSE | TR/TE/flip angle (ms/ms/degrees) | 1RR interval/20/90 |
| Spatial resolution (mm × mm × mm) | 1.5 × 1.7 × 8.0 | |
| SAR (W/kg bodyweight) | 0.6 | |
| T2W blackblood TSE | Fat suppression prepulse | SPIR |
| TR/TE/flip angle (ms/ms/degrees) | 2–3 RR intervals/90/90 | |
| Spatial resolution (mm × mm × mm) | 1.5 × 1.7 × 8.0 | |
| SAR (W/kg bodyweight) | 0.5 | |
| First-pass perfusion SSFP | TR/TE/flip angle (ms/ms/degrees) | 3.0/1.5/50 |
| Spatial resolution (mm × mm × mm) | 2.2 × 2.2 × 10.0 | |
| SENSE factor | 2.5 | |
| SAR (W/kg bodyweight) | 1.9 | |
| First-pass perfusion SGE | TR/TE/flip angle (ms/ms/degrees) | 2.6/1.2/20 |
| Spatial resolution (mm × mm × mm) | 2.2 × 2.2 × 10.0 | |
| SENSE factor | 2.0 | |
| SAR (W/kg bodyweight) | 0.5 | |
| CE-3D angiography | TR/TE/flip angle (ms/ms/degrees) | 3.1/1.1/30 |
| Spatial resolution (mm × mm × mm) | 1.6 × 1.6 × 3.2 | |
| SENSE factor | 2.0 | |
| SAR (W/kg bodyweight) | 1.9 | |
| Late-gadolinium enhancement | TR/TE/flip angle (ms/ms/degrees) | 3.6/1.8/15 |
| Spatial resolution (mm × mm × mm) | 1.7 × 1.7 × 5.0 | |
| SENSE factor | 1.8 | |
| SAR (W/kg bodyweight) | 0.3 |
SSFP, steady-state free precession; TR, repetition time; TE, echo time; SENSE, SENSitivity Encoding; SAR, specific absorption rate; SGE, spoiled gradient echo; T1W/T2W, T1/T2weighted; TSE, turbo spin echo; CE, contrast-enhanced.
Image analysis
For qualitative assessment of image quality on cardiac scans a 4-point grading scale (non-diagnostic, poor, moderate, or good) was applied per myocardial segment which took into account whether lead- or generator-related artefacts impaired the delineability of endocardial and epicardial borders; all cardiac geometries were evaluated according to the standard 17-segment model of the heart.5 Similarly, a 4-point scale was applied to 3D-angiographic data sets accounting for visibility of the cavities of the heart and large thoracic vessels and their first and second grade branching.
In an initial subgroup of 24 ICD patients, intra- and inter-reader variability were determined for the assessment of left ventricular volumes and ejection fraction on pre- and post-contrast cine SGE scans: LV measurements were independently carried out by two experienced CMR readers; for determination of intra-reader agreement, one reader repeated the analysis after 4 weeks. In addition, quantitative measurements of signal-to-noise-ratios of left ventricular myocardium and bloodpool were conducted on cine SGE scans pre- and post-contrast and corresponding contrast-to-noise ratios were calculated according to standard definitions.
Interrogation and programming of cardiac implantable electronic devices
Before and after the CMR examination, device interrogation, and programming was carried out in the console room of the CMR suite by an experienced electrophysiologist (>12 years of experience) being present throughout the entire CMR procedure. In all patients, battery status and sensing/pacing thresholds of all leads were documented and the device memory was evaluated for events (e.g. appropriately or inappropriately classified arrhythmias). MR-conditional labelled devices were programmed into the MR-safe mode strictly following the recommendations of the manufacturer. Non-MR-conditional devices were programmed either to sensing-only (ODO or OVO) or to asynchronous pacing (VOO, 70/min) depending on intrinsic rhythm. In general, all tachyarrhythmia functions (monitoring, antitachycardia pacing, and defibrillation) were turned off directly before CMR imaging. Finally, all devices were reprogrammed to original settings after completion of CMR imaging.
Statistical analysis
All analyses were performed using SPSS version 21 (IBM Corporation, Armonk, NY, USA). Continuous variables are stated as mean ± standard deviation if normally distributed; numbers and ratios were used to describe categorical variables. The χ2-test was used for comparisons between-groups in the case of categorical variables; Student’s t-test was applied for continuous variables. A linear regression analysis was used to determine the effects of gender, BMI, LVEF, LVEDV, minimal generator-heart distance, number of implanted leads, and device subgroup on the number of artefact-free LV segments. The odds ratios of achieving a good image quality for SGE and SGE post-contrast cine scans were reported for short-axis and long-axis geometries using a forest plot. A two-tailed P-value <0.05 was considered statistically significant. In addition, Lin’s concordance correlation coefficient was calculated, to assess the concordance of continuous data with the following scale to describe the strength of agreement: >0.99 indicates almost perfect agreement; 0.95–0.99, substantial agreement; 0.90–0.95, moderate agreement; and <0.90, poor agreement.6
Results
Patient characteristics
CMR examinations were successfully completed in all 128 patients. Table 2 summarizes the patient demographics, and Table 3 lists the number of patients per diagnostic CMR module according to the different device-type subgroups. All insertable cardiac monitoring systems and all implantable loop recorders were labelled MR-conditional. In addition, proportions of MR-conditional devices were 35% (11/31) for pacemakers, 18% (9/50) for ICDs and 8% (1/12) for CRT-D systems. Right-sided device implantation was present in 15% of patients (ILRright 1/21, 5%; PMright 14/31, 45%; ICDright 3/50, 6%; CRT-Dright 1/12, 8%). Due to bradycardia (heart rate of 40–50/min), the device was programmed to asynchronous pacing in 11 patients (9%). In all patients, device interrogation before and after the CMR examination yielded no significant changes in pacemaker patients (n = 31, number of leads 59; mean change of battery status 0.0 ± 0.0 V; pacing lead threshold 0.0 ± 0.3 V; pacing lead impedance 0.6 ± 20.5 Ω; for all P-value = ns) or defibrillator patients (n = 62, number of leads 105; mean change of battery status 0.0 ± 0.0 V; pacing lead threshold 0.0 ± 0.2 V; pacing lead impedance −11.8 ± 24.3 Ω; for all P-value = ns).
Patient demographics (n = 128)
| Age (years) | 62.1 ± 14.2 |
| Men, n (%) | 99 (77) |
| BMI (kg/m2) | 27.9 ± 4.7 |
| Hypertension, n (%) | 84 (66) |
| Diabetes mellitus, n (%) | 22 (17) |
| Antiarrhythmic drug | 110 (86) |
| Betablockers, n (%) | 97 (76) |
| Calcium-antagonists, n (%) | 6 (5) |
| Class IAAD, n (%) | 6 (5) |
| Class III AAD, n (%) | 39 (30) |
| Structural heart disease | |
| Ischaemic, n (%) | 38 (30) |
| Non-ischaemic, n (%) | 55 (43) |
| Distance IPG-heart silhouette (mm) | |
| Right-sided implants (n = 19) | 79 ± 32 |
| Left-sided implants (n = 109) | 40 ± 38 |
| CMR imaging data | |
| Left-ventricular ejection fraction (%) | 43 ± 15 |
| Left-ventricular end-diastolic volume (mL) | 202 ± 100 |
| Left-ventricular end-systolic volume (mL) | 126 ± 94 |
Data are mean ± SD when appropriate.
AAD, antiarrhythmic drugs; IPG, impulse generator; CMR, cardiovascular magnetic resonance.
Number of patients according to diagnostic CMR imaging module and device type
| Cine | T1W | T2W | Perfusion | 3D-angio | LGE | |
|---|---|---|---|---|---|---|
| Reveal LINQ | 14 | 7 | 6 | 4 | 10 | 11 |
| ILR | 21 | 16 | 19 | 8 | 8 | 19 |
| PMright | 14 | 11 | 12 | 1 | 5 | 14 |
| PMleft | 17 | 12 | 15 | 6 | 8 | 17 |
| ICD | 50 | 34 | 32 | 9 | 9 | 48 |
| CRT-D | 12 | 9 | 9 | 1 | 0 | 12 |
| total | 128 | 89 | 93 | 29 | 40 | 121 |
ILR, implantable loop recorder; PM, pacemaker; ICD, implantable cardioverter-defibrillator; CRT-D, cardiac resynchronization therapy-defibrillator; T1W, T1-weighted CMR imaging; T2W, T2-weighted CMR imaging; LGE, late-gadolinium enhancement.
Cine imaging
Cine SSFP imaging was completely artefact-free in patients with an insertable cardiac monitoring system (LINQ) and, consequently, SGE cine imaging was not attempted. The percentages of evaluable LV segments per cine sequence type are given in Figure 1 with evaluability on a per segment level detailed in the bull’s eye plots shown in Figure 2. In comparison to SSFP sequences, a significant improvement of image quality was achieved with SGE sequences with incremental improvement on post-contrast SGE sequences in the following subgroups: for ILR (good image quality in 48 vs. 86 vs. 96%, P = 0.004), PMleft-sided (48 vs. 92 vs. 93%, P = 0.003), ICD (6 vs. 71 vs. 78%, P < 0.001), and CRT-D (14 vs. 68 vs. 76%, P = 0.001; Figure 3, see Supplementary data online, Movie S1). SNR values were significantly higher for post-contrast SGE scans in comparison to pre-contrast SGE imaging and post-contrast CNR values were significantly higher on long-axis views while CNR on short-axis geometries remained nearly constant (Table 4). This resulted in an improved intra- and inter-reader agreement for the assessment of left ventricular volumes and systolic function (Table 5). Finally, the forest plot shown in Figure 4 displays higher odds of achieving a good image quality with post-contrast SGE cine scans than with pre-contrast SGE scans particularly on long-axis geometries and only a marginal benefit for short-axis geometries.
Signal-to-noise and contrast-to-noise ratios for the comparison of native vs. post-contrast cine TFE imaging in ICD patients (n = 24)
| Geometry | Native SGE | Post-contrast SGE | P-value | |
|---|---|---|---|---|
| SNRmyo | SA | 43.6 ± 18.7 | 70.6 ± 29.0 | <0.001 |
| 4CH | 36.9 ± 11.0 | 56.9 ± 20.4 | <0.001 | |
| 3CH | 45.1 ± 12.0 | 60.1 ± 16.7 | 0.08 | |
| 2CH | 38.8 ± 16.7 | 60.6 ± 21.0 | <0.05 | |
| SNRblood | SA | 82.0 ± 32.4 | 132.8 ± 42.9 | <0.001 |
| 4CH | 62.0 ± 18.2 | 116.1 ± 39.2 | <0.001 | |
| 3CH | 66.4 ± 16.8 | 120.1 ± 25.1 | <0.01 | |
| 2CH | 62.2 ± 26.4 | 123.2 ± 45.8 | <0.01 | |
| CNR | SA | 1.9 ± 0.3 | 1.9 ± 0.3 | 0.67 |
| 4CH | 1.7 ± 0.2 | 2.1 ± 0.2 | <0.001 | |
| 3CH | 1.5 ± 0.1 | 2.1 ± 0.4 | <0.05 | |
| 2CH | 1.6 ± 0.2 | 2.0 ± 0.1 | <0.001 |
SNR, signal-to-noise ratio; myo, myocardium; blood, bloodpool; CNR, contrast-to-noise ratio; SA/4CH/3CH/2CH, short-axis and 4-/3-/2-chamber geometry, respectively.
Lin’s concordance correlation coefficients and the corresponding 95% CIs to assess the inter- and intra-reader variability for the assessment of left ventricular volumes and function on native and post-contrast SGE cine imaging
| Intra-reader variability | Inter-reader variability | |||
|---|---|---|---|---|
| Lin’s concordance correlation | 95% CI | Lin’s concordance correlation | 95% CI | |
| Coefficient | Coefficient | |||
| SGE | ||||
| LVEDV | 0.993 | 0.985–0.996 | 0.969 | 0.931–0.987 |
| LVESV | 0.995 | 0.989–0.998 | 0.973 | 0.940–0.988 |
| LVEF | 0.914 | 0.812–0.961 | 0.843 | 0.683–0.926 |
| SGE post-contrast | ||||
| LVEDV | 0.994 | 0.998–0.997 | 0.977 | 0.951–0.989 |
| LVESV | 0.994 | 0.987–0.997 | 0.982 | 0.961–0.992 |
| LVEF | 0.955 | 0.900–0.980 | 0.930 | 0.847–0.969 |
SGE, spoiled gradient echo; CI, confidence interval; LVEDV, left ventricular end-diastolic volume; LVESV, left ventricular end-systolic volume; LVEF, left ventricular ejection fraction.
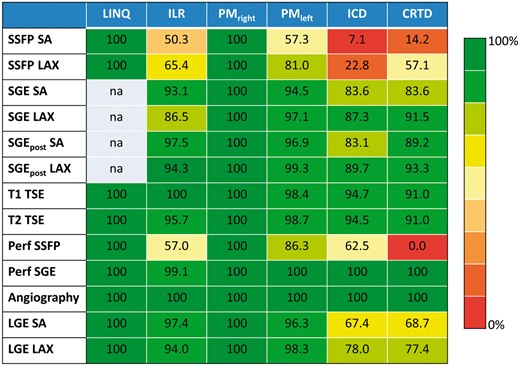
Evaluability of left-ventricular segments (in %) for imaging sequences and device types. Notably, evaluability for pacemaker (right-sided) and LINQ generally amounts to 100% independent of CMR imaging sequence while for ICD/CRTD patients’ evaluability is extremely poor for SSFP sequences. SA indicates short-axis geometry; LAX, long-axis; Perf, perfusion scan; LGE, late-gadolinium enhancement; na, not applicable.
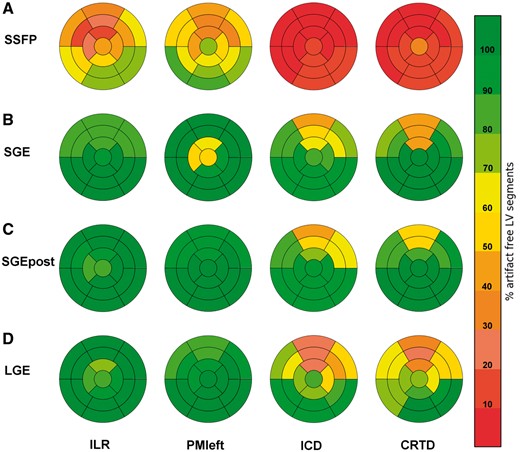
Bull’s eye plots of left ventricular segmental evaluability using the standard 17-segment model according to device type and CMR cine and LGE-imaging sequence. Overall, the anterior/anteroseptal myocardial territory demonstrated the most impaired visibility of LV segments. Note the significant improvement in segmental evaluability on post-contrast cine scans. SSFP, steady-state free precession; SGE, spoiled gradient echo; SGEpost, post-contrast spoiled gradient echo; LGE, late-gadolinium enhancement; ILR, implantable loop recorder, PMleft, pacemaker left; ICD, implantable cardioverter defibrillator; CRTD, cardiac resynchronization therapy-defibrillator.
![Influence of sequence type on CMR image quality in a patient with an implantable loop recorder [Biomonitor, Biotronik, left-sided implantation, (A–D) and with an implanted CRT-D system (E–H)]. SSFP cine still frame with extensive banding/off-resonance artefacts (A, E). SGE cine imaging in the identical scan geometry before (B, F) and after application of a Gad-containing contrast agent (C, G), respectively: note the significant improvement of overall endocardial border delineation together with artefact-free visibility of all LV segments. Corresponding LGE imaging (D, H).](https://oup.silverchair-cdn.com/oup/backfile/Content_public/Journal/ehjcimaging/19/9/10.1093_ehjci_jex243/1/m_jex243f3.jpeg?Expires=1716435497&Signature=csIIqu7oJ~BaOCzIGkV~9tqyV7rLa2VRCB556GudOMBpjOKjOihMAmXSXDjpYppHesRtG82smc-7-P82zShu8ySyYcsNYl6zEsPIYbc3sMdjIG2WRpWPjsQxPf5vGMWkPIxCTwVdzXsvGCQQxbNf9HtS-geX3T5nITIuiMEZZjcSiCwEovx1khCZm3Hxds9UuI2M7YQBOmCOYVdXi6gfTi~-~mtIzBLVICKPpeuOWbJjxT3yfsdIe5cVi3~MXHP0izFi1Gr-RwsgZ1ybyoLxwDguyv~FcyihNNqjEQm9jUdIE7Twse07NWovdkURoiKWpcjCryACuxnFFj~ongDjDA__&Key-Pair-Id=APKAIE5G5CRDK6RD3PGA)
Influence of sequence type on CMR image quality in a patient with an implantable loop recorder [Biomonitor, Biotronik, left-sided implantation, (A–D) and with an implanted CRT-D system (E–H)]. SSFP cine still frame with extensive banding/off-resonance artefacts (A, E). SGE cine imaging in the identical scan geometry before (B, F) and after application of a Gad-containing contrast agent (C, G), respectively: note the significant improvement of overall endocardial border delineation together with artefact-free visibility of all LV segments. Corresponding LGE imaging (D, H).
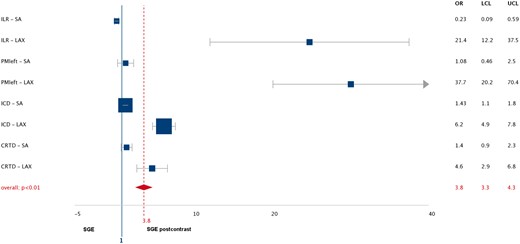
Forest plot: odds ratio for achieving good image quality on post-contrast spoiled gradient echo (SGE) scans according to device type and scan geometry. OR indicates odds ratio; LCL, lower confidence limit; UCL, upper confidence limit; SA, short-axis; LAX, long-axis; ILR, implantable loop recorder; PM, pacemaker; ICD, implantable cardioverter defibrillator; CRTD, cardiac resynchronization therapy- defibrillator.
Image quality of SSFP cine sequences significantly correlated with the device group, LVEF, LVEDV, and the number of implanted leads; device group and number of leads were the only independent predictors on multiple linear regression analysis (Table 6). Image quality of SGE cine scans significantly correlated with the device group, LVEF and the minimal generator-heart distance with the minimal generator-heart distance remaining the only independent predictor on multiple linear regression analysis (Table 6). Likewise, image quality of post-contrast SGE cine scans significantly correlated with the device group, LVEF and the minimal generator-heart distance, and the minimal generator-heart distance as well as LVEF remained independent predictors on multiple linear regression analysis (Table 6). Overall, the anterior segments showed the highest impairment in image quality (Figure 2). Patients with a MR-conditional device demonstrated a significantly higher number of artefact-free LV segments for SSFP cine imaging in comparison to patients with non-MR-conditional devices (P < 0.001); for SGE and SGE post-contrast imaging no significant differences between MR-conditional and non-MR-conditional devices were detected (P = 0.89 and P = 0.75, respectively).
Univariate and multiple linear regression analysis (P-values) for the prediction of image quality on cine and LGE-imaging
| SSFP SA | SGE SA | SGE post-contrast SA | LGE SA | |||||
|---|---|---|---|---|---|---|---|---|
| Univariate | Multiple linear regression | Univariate | Multiple linear regression | Univariate | Multiple linear regression | Univariate | Multiple linear regression | |
| Device group | <0.001 | <0.001 | 0.038 | 0.864 | 0.004 | 0.623 | <0.001 | 0.001 |
| LVEF | <0.001 | 0.748 | 0.001 | 0.089 | <0.001 | 0.028 | <0.001 | 0.018 |
| LVEDV | <0.001 | 0.896 | 0.870 | 0.685 | <0.001 | 0.300 | ||
| Sex | 0.171 | 0.616 | 0.619 | 0.765 | ||||
| BMI | 0.229 | 0.862 | 0.510 | 0.709 | ||||
| MRconditional | <0.001 | 0.242 | 0.871 | 0.979 | 0.001 | 0.173 | ||
| Number of leads | 0.003 | <0.001 | 0.987 | 0.500 | 0.003 | 0.218 | ||
| Distance generator-heart | 0.542 | 0.003 | 0.023 | 0.001 | 0.006 | 0.002 | <0.001 | |
SSFP, steady-state free precession; SGE, spoiled gradient echo; LGE, late-gadolinium enhancement; SA, short-axis geometry; LVEF, left ventricular ejection fraction; LVEDV, left ventricular end-diastolic volume; BMI, body mass index.
Myocardial tissue characterization
T1- and T2-weighted TSE blackblood imaging showed no significant differences regarding evaluability between all device subgroups (P = 0.06 and P = 0.18, respectively). Overall, T1- and T2-weighted TSE blackblood imaging resulted in the least number of affected LV segments for all implanted device types: freedom of artefacts was 100% for LINQ and right-sided pacemakers, >95% for ILR and left-sided pacemakers, and >91% for ICD and CRT-D patients. Comparing MR-conditional and non-MR-conditional devices no significant differences with regard to the number of diagnostic segments were detectable (T1- and T2-weighted imaging, P = 0.37 and P = 0.64, respectively; Figure 5, see Supplementary data online, Movie S2).
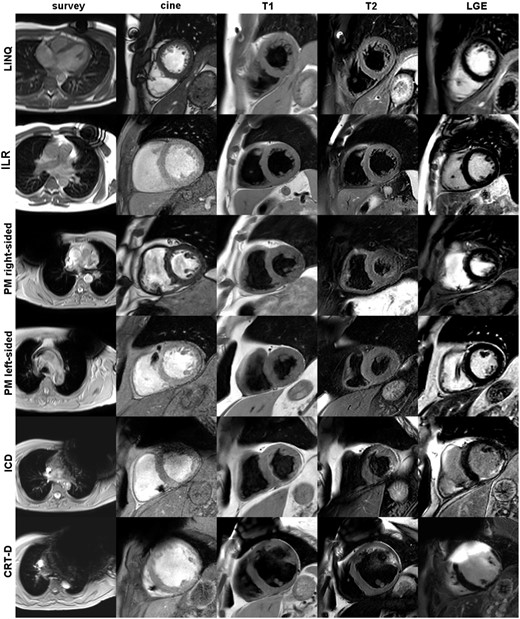
Overview of image quality according to device types and CMR imaging sequences. Columns from left to right: survey scan, transversal slice of the initial scout images showing the maximum extent of the generator-related artefact; cine, short-axis scan geometry using cine SSFP imaging in case of a LINQ or right-sided PM and post-contrast cine SGE imaging in case of an ILR, a left-sided PM, an ICD or a CRT-D; in addition, T1-, T2-weighted, and LGE images are shown in short-axis geometry.
LGE imaging was completely artefact free in the LINQ and right-sided PM subgroup. In patients with implantable loop recorder or left-sided pacemaker, >94% of LV segments were of diagnostic image quality. Degradation of image quality was highest for ICD and CRT-D patients resulting in 67–78% of evaluable segments (see Figures 1, 2, and 5; see Supplementary data online, Movie S2). Image quality of LGE scans significantly correlated with device group, LVEF, LVEDV, the number of implanted leads, and the minimal generator-heart distance; on multiple linear regression analysis, device group, LVEF, and minimal generator-heart distance were independent predictors (Table 6). In general, the anterior/anteroseptal myocardium represented the mostly impaired LV territory (Figure 2). Notably, patients with a MR-conditional device demonstrated a significantly higher number of artefact-free LV segments in comparison to patients with non-MR-conditional devices (P < 0.001).
Dynamic first-pass perfusion imaging
In patients with clinical indication for myocardial ischaemia testing, test scans without the application of contrast-agent were performed prior to pharmacological stress in order to judge image quality. For all device types, the number of evaluable segments significantly increased when comparing SSFP with SGE perfusion test scans (P = 0.001). In general, the results for SSFP and SGE perfusion imaging were in agreement with the results for SSFP and SGE cine imaging, respectively: for SSFP perfusion imaging, a 100% artefact-free visibility of LV segments was documented for insertable cardiac monitoring systems (LINQ) and right-sided pacemakers. In contrast, all other device types exhibited a significant number of non-diagnostic LV segments. When using SGE perfusion imaging, artefact-free delineation of myocardial segments could be achieved in >99% for all device groups. Consequently, the final contrast-enhanced stress perfusion scan was performed with SSFP sequences in LINQ and right-sided pacemaker patients while in all other device types (i.e. ILR, left-sided pacemakers, ICD, and CRT-D) SGE perfusion imaging was done. Between MR-conditional and non-MR-conditional devices, no significant differences regarding the number of artefact-free LV segments were detected for SSFP and SGE perfusion imaging (P = 0.77 and P = 0.32, respectively).
CMR angiography
3D contrast-enhanced angiography was generally artefact-free (no image distortion or generator-/lead-related artefacts) and allowed clear depiction of all large intra-thoracic vessels up to second branching. Thus, a 100% diagnostic visibility of all angiographic scans could be recorded irrespective of the implanted device type.
Discussion
The principal findings of our study are that (i) generator type and location were highly influential with regard to CMR image quality with the highest proportion of non-diagnostic images encountered in the presence of ICD- and CRT-D systems, (ii) cine SSFP imaging can be considered non-diagnostic in patients with non-MR-conditional ICD- and CRT-D systems, (iii) cine SGE resulted in a significant improvement in image quality for all device types with the exception of right-sided pacemakers, (iv) post-contrast cine SGE imaging further increased image quality with an overall four-fold higher likelihood, and (v) dynamic SGE perfusion and T1/T2-weighted scans were excellent in >99% and >90% of myocardial segments for all device types, respectively, whereas 3D-angiographic scans were excellent in 100% of ILR, PM, and ICD patients and finally, (vi) LGE scans were found to be non-diagnostic in about one-third of left ventricular segments for ICD and CRT-D patients.
Previous single-device type studies researched cine imaging in MR-conditional systems only and generally, reported CMR image quality to be superior in pacemakers compared to ICDs.7–9 One other study investigated a limited number of different non-MR-conditional pacemakers/ICDs, and the data on SSFP and LGE imaging were similar compared to the results of the present study; however, cine SGE imaging was not attempted, and data on other device types like insertable or implantable cardiac monitoring systems/loop recorders were missing. Notably, general linear model analysis in the present study revealed that device type and minimal distance of the generator to the heart (on chest X-ray) constituted the primary independent predictors of CMR image quality for cine and LGE imaging. In line with our results, a correlation between minimal generator-heart distance and artefact size on LGE images has already been suggested in a small number of ICD patients.10
SGE techniques provide accurate measurements of global LV function but they have been largely abandoned in favour of SSFP sequences: SSFP scans provide favourable SNR/CNR characteristics with an inherently high contrast between blood and myocardium on native scans. But then, SSFP imaging sequences are highly susceptible to field inhomogeneities and, consequently, the high degree of generator-related image distortion is frequently deleterious. Some investigators noted that generally, >93% of device patients showed any artefact on SSFP short-axis geometries while in direct comparison of SSFP vs. SGE sequences was found to be 53% and 74%, respectively, in ICD patients only.4,9 The grading criteria of both studies mainly assigned image quality on a per patient level with ‘diagnostic image quality’ defined as less than half of LV segments being distorted by device-related artefacts. When comparing to previous reports, mean minimal distance from generator to heart in the present study was in a similar range (32 vs. 38 mm) and, thus, the considerably lower performance of cine SSFP sequences in the present study is most likely due to the more fine grained grading scheme with evaluability determined per myocardial segment. In addition, the studied ICD subgroup consisted mainly of patients with non-MR-conditional devices (82%) which may be responsible for the observed lower SSFP image quality.
SGE cine scans resulted in significantly more evaluable segments in comparison to SSFP scans with the exception of right-sided pacemakers in which 100% diagnostic segments were already achievable using SSFP imaging. In the group of ICD patients, SGE scans yielded diagnostic image quality in approximately 85% of LV segments which was a slight improvement over previously reported results in an MR-conditional ICD cohort.9 Most importantly, our new approach of post-contrast SGE cine imaging further improved evaluability mainly as a result of the concomitant increase in SNR/CNR values with all long-axis views benefitting most while CNR of short-axis geometries remained almost constant. The reason for that observation can be explained as follows: on short-axis geometries, bloodflow is mostly orthogonal to the imaging plane and hence, continuous spin refreshment ensures high endocardial border visibility. Long-axis geometries, however, suffer from missing spin refreshment with saturated spins remaining in the imaging plane during acquisitions resulting in local bloodpool signal voids. This can be overcome by taking advantage of the T1-shortening effect of a gadolinium-containing contrast agent leading to a consistently high bloodpool signal and thus, high CNR and improved detectability of endocardial borders. Consequently, the overall effect could be quantified to be in the range of a four-fold higher likelihood of achieving good image quality on post-contrast SGE cine imaging (Figure 4).
LGE imaging evaluability in the current study ranged from only 67% to 78% in ICD/CRT-D patients. In order to augment the diagnostic capabilities of LGE imaging, the so called ‘wideband’ or ‘broadband’ LGE approach has more recently been proposed.11 Our group reported on the usefulness of this novel broadband LGE technique in a patient study to remove the hyper-intensity artefact (‘off-resonance’) occurring in tissues at about 5–10 cm distance from the generator. These hyper-intense off-resonance artefacts may be mistaken as equally bright occurring myocardial scar tissue but can be overcome by significantly increasing spectral bandwidth (‘broadband’) of the inversion-prepulse. With the broadband LGE technique, artefact free visualization of myocardial segments dramatically increased from 73% to 96%.12 Remarkably, the improved detection of myocardial scar tissue comes at no penalty regarding SAR and can be easily incorporated in any CMR imaging protocol without any change in pulse sequence timing or scanner system components.10,11 Hence, perspectively, we recommend to employ the broadband LGE technique ‘broadly’ in all CMR studies of device patients.
Based on the current study results, we recommend the following CMR imaging strategy to achieve optimal image quality in all device types and by using routine clinical scanner systems (Figure 6): in general, in case of insertable cardiac monitoring systems (LINQ) or right-sided pacemakers all conventionally employed diagnostic CMR imaging modules can be performed without any impairment of image quality. In ICD and CRT-D patients, it is advisable to use SGE imaging sequences right from the beginning of the study (cine and perfusion CMR imaging) with long-axis views being acquired after contrast agent application. For implantable loop recorders and left-sided pacemakers an initial trial using SSFP cine imaging is justified but if image quality is found to be severely impaired the protocol should be continued employing SGE sequences for cine and perfusion CMR imaging.
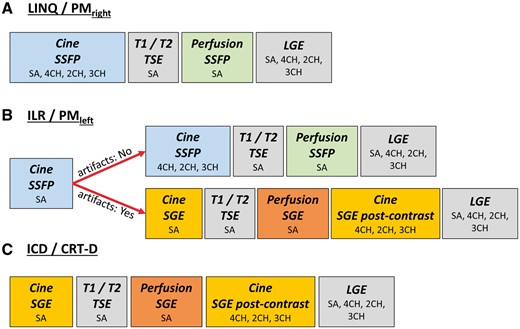
Recommended CMR imaging strategy depending on the device type: (A) in the presence of an implanted LINQ or right-sided PM all conventionally used CMR sequences (in particular SSFP sequences) can be performed with unimpaired image quality; (B) in case of an ILR or left-sided PM, cine SSFP sequences shall be attempted but if generator-related artefacts lead to poor image quality of the first cine scan, SSFP imaging is replaced by SGE sequences with long-axis geometries preferably performed after contrast agent application; for dynamic first-pass perfusion, test images are recommended for both, SSFP and SGE sequences, and the perfusion scan exhibiting the least artefacts will subsequently be used during stress testing; (C) in ICD or CRT-D patients, cine SGE and perfusion SGE scans are generally chosen. Finally, contrast-enhanced 3D-angiography of the great thoracic vessels results in unimpaired image quality regardless of implanted device type.
Study limitations
The current prospective study was conducted in consecutively enrolled cardiac implantable electronic device patients with a profound clinical indication for CMR imaging. Consequently, CMR imaging protocols first needed to address the clinical question using adequate diagnostic imaging modules and for safety reasons imaging protocols were not extended unnecessarily. Thus, a variety of CMR imaging modules were conducted and not all device patients underwent all CMR imaging sequence types e.g. none of the CRT-D patients underwent a 3D-angiographic CMR scan.
Conclusion
Device type and location represent the main independent predictors of CMR image quality and must be taken into account when selecting the appropriate CMR imaging sequences. While insertable cardiac monitoring systems and right-sided pacemakers can be examined with routinely applied CMR standard protocols, all other device types require protocol adaptation. In particular, post-contrast SGE cine imaging proved vastly superior to conventionally used SSFP sequences. Following our proposed device-dependent CMR imaging strategy, diagnostic image quality can be achieved in the majority of patients even with non-MR-conditional devices.
Supplementary data
Supplementary data are available at European Heart Journal - Cardiovascular Imaging online.
Conflict of interest: None declared.
References
Author notes
Sebastian Hilbert and Cosima Jahnke authors contributed equally to this work.
