


Abstract
Growing evidence suggests that poor sleep health is associated with cardiovascular risk. However, research in this area often relies upon recollection dependent questionnaires or diaries. Accelerometers provide an alternative tool for measuring sleep parameters objectively. This study examines the association between wrist-worn accelerometer-derived sleep onset timing and cardiovascular disease (CVD).
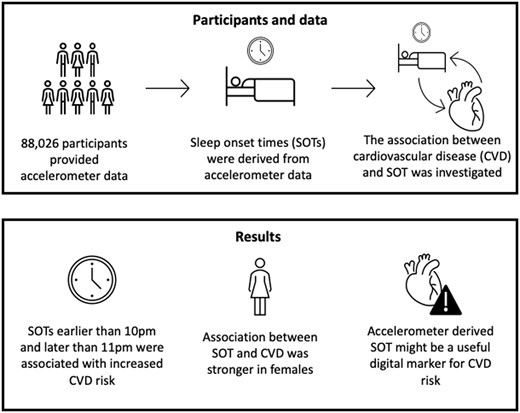
We derived sleep onset and waking up time from accelerometer data collected from 103 712 UK Biobank participants over a period of 7 days. From this, we examined the association between sleep onset timing and CVD incidence using a series of Cox proportional hazards models. A total of 3172 cases of CVD were reported during a mean follow-up period of 5.7 (±0.49) years. An age- and sex-controlled base analysis found that sleep onset time of 10:00 p.m.–10:59 p.m. was associated with the lowest CVD incidence. An additional model, controlling for sleep duration, sleep irregularity, and established CVD risk factors, did not attenuate this association, producing hazard ratios of 1.24 (95% confidence interval, 1.10–1.39; P < 0.005), 1.12 (1.01–1.25; P = 0.04), and 1.25 (1.02–1.52; P = 0.03) for sleep onset <10:00 p.m., 11:00 p.m.–11:59 p.m., and ≥12:00 a.m., respectively, compared to 10:00 p.m.–10:59 p.m. Importantly, sensitivity analyses revealed this association with increased CVD risk was stronger in females, with only sleep onset <10:00 p.m. significant for males.
Our findings suggest the possibility of a relationship between sleep onset timing and risk of developing CVD, particularly for women. We also demonstrate the potential utility of collecting information about sleep parameters via accelerometry-capable wearable devices, which may serve as novel cardiovascular risk indicators.
Introduction
Cardiovascular disease (CVD) continues to be the most significant cause of mortality worldwide, with an estimated 18.6 million deaths each year.1 Primary prevention of CVD has become a mainstay of addressing this considerable global challenge. The majority of clinical efforts are directed towards minimizing modifiable risk factors through lifestyle changes and medical intervention. Traditional modifiable risk factors are well-defined, including hypertension, obesity, diabetes, smoking, and hypercholesterolaemia.2 The impact of all these factors has been shown to be reduced through lifestyle changes. However, poor population-level adherence to lifestyle advice is a considerable challenge to preventive efforts.3
Sleep health is an important contributor to a person’s general health and wellbeing. While much focus is devoted to disorders of sleep, assessing good sleep is also important. Sleep health can be considered as a multidimensional construct including sleep duration (time in 24 h spent asleep), sleep continuity or efficiency (ease of falling asleep and returning to sleep), sleep timing (when sleep occurs), alertness (ability to maintain attentive wakefulness), and sleep quality (subjective rating of good/poor sleep).4 These domains can be measured, and different techniques are appropriate for different domains. Sleep quality is generally thought to represent the subjective assessment of ‘good’ or ‘poor’ sleep, and as such is best measured through subjective self-report, whereas sleep timing, duration, and continuity can be successfully measured through actigraphy, including by wrist-worn accelerometers.
Evidence suggests circadian rhythm disruption could be an understudied risk factor for CVD, and that prolonged misalignment of circadian rhythms is associated with elevated blood pressure, reduced sleep quality, increased risk for cardiovascular disorders,5–7 and may also stimulate atherosclerosis, providing a possible biological mechanism for increased cardiovascular risk.8,9 These changes may promote CVD in a sexually dimorphic manner.10 Circadian rhythm disruption is likely strongly related to disrupted sleep timing. Similarly, shift work will also disrupt sleep timing, and has also been associated with increased cardiovascular risk.11 There is, therefore, evidence suggesting that disrupted sleep timing could be a useful risk factor for the prediction of CVD risk.
Despite this evidence, the relationship between sleep timing, or irregular sleep and CVD risk has received little attention in research, especially when compared with the relationship between sleep duration and CVD risk. The influence of sleep irregularity on CVD risk has been investigated in recent research, where increasing variability in sleep durations was associated with increased CVD risk.12 Another study has also examined the relationship between sleep timing and congestive heart failure using sleep habit questionnaires and found that delayed bedtimes and waking times were associated with an increased risk of congestive heart failure.13 In general, most previous studies investigating sleep disruption have had limitations, such as small or selective samples, or minimal adjustment for confounding factors, and most studies rely on self-reported sleep measures such as sleep diaries. Thus, there is currently a lack of research exploiting objectively measured sleep parameters, particularly concerning the relationship between sleep timing and CVD risk in large (of the order of 10 000 s of participants) population-based samples. Our investigation aims to assess the association between sleep timing and CVD risk through accelerometry data in the large, comprehensively characterized UK Biobank (UKB) cohort.14,15
Methods
The UKB cohort consists of more than 500 000 participants aged 37–73, recruited between 2006 and 2010. All participants completed a range of demographic, lifestyle, health, and physical assessments and questionnaires. A subsample (103 712) also provided accelerometer data using a wrist-worn accelerometer.
Participants provided informed consent, and the UKB study received ethical approval from the North West Multi-Centre Research Ethics Committee (REC reference: 16/NW/0382) and was conducted in accordance with the principles of the Declaration of Helsinki. The current analyses were conducted under UKB application number 55668.
A total of 103 712 participants provided accelerometer data to the UKB. For this study, we recieved 103679 datasets from UKB for analysis. Out of the datasets received 7148 were excluded due to low-quality accelerometer data; 4567 were excluded due to incomplete or missing data for the covariates age, sex, smoking status, cholesterol levels, or hypertension; and 3938 participants were excluded due to being diagnosed with CVD, insomnia, or sleep apnoea, either before or during the period of accelerometer data collection. This left a sample of 88 026 individuals with accelerometer data which was used for the main analyses. Flow of participants through the study can be seen in Figure 1.
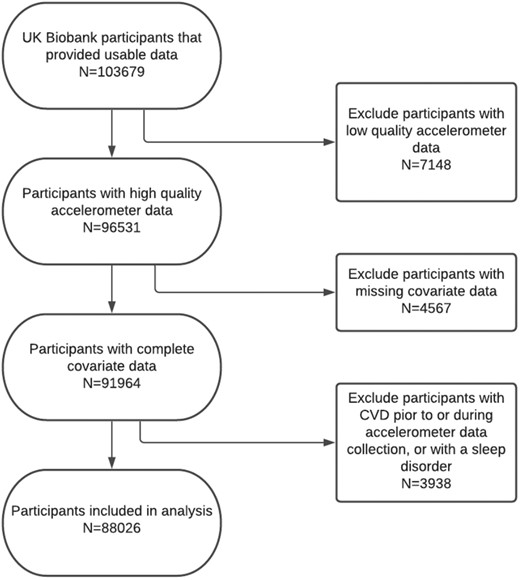
Flow of participants through the study.
Accelerometry data collection and pre-processing
Between 2013 and 2015, 103 712 participants enrolled in the UKB accepted the invitation to wear an accelerometer for 7 days and provided accelerometer data. The participants who accepted wore an Axivity AX3 triaxial accelerometer (https://axivity.com/product/ax3) on their dominant wrist and continued with normal daily activities. Over 7 days, participants’ activity was recorded by the accelerometer. The accelerometer data were pre-processed by the UKB accelerometer expert working group.15 Details of data collection and pre-processing can be found at http://biobank.ctsu.ox.ac.uk/crystal/refer.cgi?id=131600 (accessed 29 September 2021).
Accelerometer data processing
We derived three measures of sleep: duration, irregularity, and timing. All measures were derived by processing raw accelerometer data in CWA format (continuous wave accelerometer), a proprietary binary format developed by Axivity. The total size of the accelerometry dataset was approximately 25TB. CWA files were processed with the Open Source R package GGIR (Version 2.3-0).16 This package allows for the estimation of the sleep period time window from accelerometer data by detecting periods of non-movement using the HDCZA algorithm. A detailed description of the algorithm used can be found in ref.17 To account for individual variations in calibration between accelerometers, we used the autocalibration feature of the GGIR package to calibrate measurements from individual accelerometers. Sleep timing was defined as the average of the start and end of the longest non-movement period over the 7 days of recording, while sleep duration was the average length of this period. Sleep irregularity was measured as the sum of the standard deviation of the 7-day sleeping times and sleeping durations. By default, the GGIR package uses a 12:00 p.m. sleep onset time (SOT) as the pivot between ‘late’ (before midday) and ‘early’ (after midday) sleep onset. Participants were excluded for low-quality accelerometry data if: (i) they had fewer than three full nights’ worth of recordings; or (ii) on included days, the participant had fewer than 16 h recorded within the 24-maximum possible.
Measurement of cardiovascular disease outcomes
Cardiovascular disease incidence was defined as the earliest time a CVD event occurred. A CVD event was defined as myocardial infarction, heart failure, chronic ischaemic heart disease, stroke, and transient ischaemic attack. Fatal CVD outcomes were not included. All outcome data were obtained through UKB diagnosis first occurrence data. A list of outcome codes used can be found in Supplementary material online, S1.
Statistical analysis
Cox proportional hazards (CPHs) survival models were used to estimate hazard ratios (HRs) and 95% confidence intervals (CIs) for the association between sleep timing and risk of CVD. The follow-up time was calculated as the period from the end of accelerometer measurements to the first occurrence of CVD, death, or the last UKB data release (2020-09-30). We also computed the mean and standard deviation for continuous measures and percentage for categorical variables.
All analyses were initially adjusted for age at recruitment and sex. A CPH model (Adjusted Model 1) was created that was additionally adjusted for sleep duration and sleep irregularity. A further CPH model (Adjusted Model 2) was also constructed, further including other established, significant CVD risk factors and chronotype: smoking status, body mass index (BMI), any diabetes, hypertension, self-reported chronotype, Townsend Deprivation Index, systolic and diastolic blood pressure, high-density lipoprotein (HDL) cholesterol, and total cholesterol. CVD risk factor status was measured at UKB baseline assessments, while diagnosis of co-occurring disorders was taken from first occurrence data.
The proportional hazards assumption was assessed for each covariate by correlating the corresponding set of scaled Schoenfeld residuals with time and testing for independence between residuals and time. A global test was also performed for the model as a whole, and no analysed variables violated the assumption of independence.
To ensure that the results were robust, we also conducted several sensitivity analyses. CPH models were constructed in subgroups stratified by age, sex, obesity, HDL cholesterol, hypertension, any diabetes, or hypotension to investigate the effect of these parameters. We also constructed models excluding participants diagnosed with CVD in the 12–18 months following accelerometer data collection and excluding accelerometer data recorded on weekends. Results of sensitivity analyses can be found in Supplementary material, Tables S1–S18.
All statistical analyses were performed using Python version 3.7. Cox proportional hazard models were constructed using Python and the lifelines package. A two-sided P < 0.05 was considered statistically significant.
Results
Population characteristics
Following exclusion of accelerometry participants with low-quality accelerometer data or pre-existing CVD, insomnia, or sleep apnoea, the study was conducted with 88 026 UKB participants. This included 51 214 (57.9%) females and 36 812 (41.6%) males, aged 43–79 during accelerometer data collection (mean age 61.43 years ± 7.8; Table 1).
Characteristics of the cohort
| Sleep onset <10:00 p.m. | Sleep onset 10:00 p.m.–10:59 p.m. | Sleep onset 11:00 p.m.–11:59 p.m. | Sleep onset ≥12:00 a.m. | Total sample | |
|---|---|---|---|---|---|
| Sex | |||||
| Male | 1447 (41.99%) | 6662 (39.25%) | 14 723 (41.03%) | 13 980 (44.07%) | 36 812 (41.82%) |
| Female | 1999 (58.01%) | 10 313 (60.75%) | 21 161 (58.97%) | 17 741 (55.93%) | 51 214 (58.18%) |
| Age category | |||||
| Age ≤ 50 | 401 (11.64%) | 2090 (12.31%) | 3817 (10.64%) | 2798 (8.82%) | 9106 (10.34%) |
| 50 < Age ≤ 64 | 1747 (50.7%) | 8373 (49.33%) | 16 491 (45.96%) | 14 135 (44.56%) | 40 746 (46.29%) |
| Age > 64 | 1298 (37.67%) | 6512 (38.36%) | 15 576 (43.41%) | 14 788 (46.62%) | 38 174 (43.37%) |
| Townsend Deprivation Index (mean ± SD) | −1.5 ± 3.0 | −1.9 ± 2.7 | −1.9 ± 2.7 | −1.5 ± 2.9 | −1.7 ± 2.8 |
| Mean sleep irregularity (h) | 3.2 | 2.1 | 2.0 | 2.8 | 2.4 |
| Mean sleep duration (h) | 6.5 | 6.5 | 6.2 | 5.5 | 6.0 |
| BMI (mean ± SD) | 26.6 ± 4.5 | 26.1 ± 4.3 | 26.2 ± 4.2 | 27.3 ± 4.8 | 26.6 ± 4.5 |
| HDL cholesterol (mean ± SD) | 1.5 ± 0.4 | 1.5 ± 0.4 | 1.5 ± 0.4 | 1.5 ± 0.4 | 1.5 ± 0.4 |
| Cholesterol (mean ± SD) | 5.8 ± 1.1 | 5.8 ± 1.0 | 5.8 ± 1.0 | 5.8 ± 1.1 | 5.8 ± 1.1 |
| Blood pressure (mean ± SD) | |||||
| Systolic blood pressure | 138.4 ± 18.9 | 137.4 ± 18.7 | 137.8 ± 18.6 | 138.9 ± 18.5 | 138.2 ± 18.6 |
| Diastolic blood pressure | 82.3 ± 10.4 | 81.4 ± 10.2 | 81.3 ± 10.2 | 82.0 ± 10.3 | 81.6 ± 10.2 |
| Hypertension | 741 (21.5%) | 3182 (18.75%) | 7095 (19.77%) | 7879 (24.84%) | 18 897 (21.47%) |
| Any diabetes | 173 (5.02%) | 695 (4.09%) | 1573 (4.38%) | 2226 (7.02%) | 4667 (5.3%) |
| Current smoker | 263 (7.63%) | 921 (5.43%) | 2023 (5.64%) | 2785 (8.78%) | 5992 (6.81%) |
| Self-reported chronotype | |||||
| Morning type | 1542 (44.75%) | 5891 (34.7%) | 8203 (22.86%) | 4514 (14.23%) | 20 150 (22.89%) |
| More morning type | 1127 (32.7%) | 6471 (38.12%) | 13 263 (36.96%) | 8568 (27.01%) | 29 429 (33.43%) |
| More evening type | 422 (12.25%) | 2606 (15.35%) | 8471 (23.61%) | 10 224 (32.23%) | 21 723 (24.68%) |
| Evening type | 106 (3.08%) | 432 (2.54%) | 1849 (5.15%) | 4824 (15.21%) | 7211 (8.19%) |
| Number of CVD events | 132 (3.83%) | 473 (2.79%) | 1196 (3.33%) | 1371 (4.32%) | 3172 (3.6%) |
During follow-up (mean 5.7 ± 0.49 years), there were 3172 participants (3.58%) who developed CVD, of which: 1371 (43%) had a SOT after midnight; 1196 (38%) had an SOT between 11:00 p.m. and 11:59 p.m.; 473 (15%) had an SOT between 10:00 p.m. and 10:59 p.m.; and 132 (4.2%) had an SOT before 10 p.m. (Table 1). Additionally, Kaplan–Meier curves for each SOT category showed the rate of CVD to be the highest in participants with SOTs ≥12 a.m. and the lowest when SOT is between 10:00 p.m. to 10:59 p.m. (Table 1 and Figure 2).
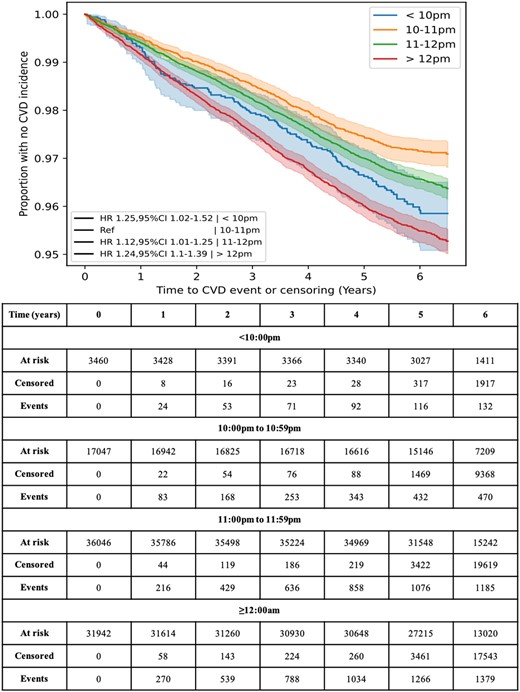
Kaplan–Meier curves for cardiovascular disease incidence against time to occurrence, split by sleep onset time.
Participants with an SOT after midnight (n = 31 946) were more likely to be a current smoker and have a history of diabetes or hypertension than those with SOTs from 11:00 p.m. to 11:59 p.m. (n = 36 042), 10:00 p.m. to 10:59 p.m. (n = 17 040), and before 10:00 p.m. (n = 3460). Mean sleep durations and irregularity are reported in Table 1. There was a difference between the sleep duration (F = 4000.41, P < 0.001) and sleep irregularity (F = 2317.43, P < 0.001) between the different SOT groups, with the 11 p.m.–11:59 p.m. group having the lowest sleep irregularity, and the <10 p.m. group the highest sleep irregularity, and the <10 p.m. and 10–10:59 p.m. groups having the longest sleep durations, while the ≥12:00 a.m. group had the shortest sleep durations.
Assessment of sleep onset times, sleep irregularity, and sleep duration
There was a U-shaped relationship between increased incidence of CVD and SOT, with a higher rate of incidence for participants with late or very early SOTs (Figure 3). There were 4.29, 3.32, 2.78, and 3.82 CVD incidences per 100 person-years in SOT categories of ≥12:00 a.m., 1:00 p.m.–11:59 p.m., 10:00 p.m.–10:59 p.m., and <10:00 p.m., respectively.
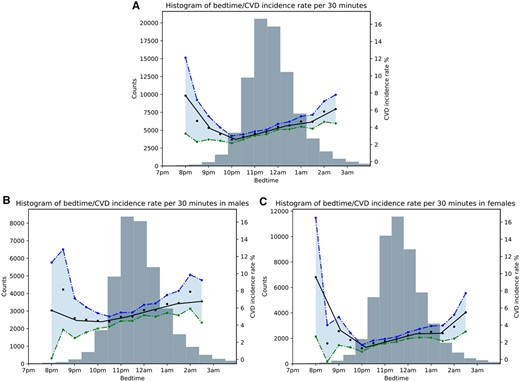
Histogram showing the relationship between sleep onset time and cardiovascular disease incidence rate for: (A) the overall sample, (B) males, and (C) females. The black line indicates the mean cardiovascular disease incidence rate per 30-min increments. Blue and green lines indicate 95% confidence intervals.
At study entry, the group with SOTs between 10:00 p.m. and 10:59 p.m. had the lowest incidence rate of CVD and was chosen as the reference group. The HRs obtained were 1.35 (95% CI, 1.12–1.64; P < 0.005), 1.11 (95% CI, 1.00–1.24; P = 0.05), and 1.38 (95% CI, 1.24–1.53; P < 0.005) for SOT categories ≥12 a.m., 11 p.m.–11:59 p.m., and <10 p.m., respectively.
After adjusting for sleep duration (in hours) and sleep irregularity (hours) (Adjusted Model 1), the HRs obtained were 1.29 (95% CI, 1.06–1.57; P = 0.01), 1.09 (95% CI, 0.98–1.22; P = 0.1), and 1.25 (95% CI, 1.12–1.39; P < 0.005) for SOT categories ≥12:00 a.m., 11:00 p.m.–11:59 p.m., and <10:00 p.m., respectively (Table 2). Moreover, the HR for sleep duration was 0.93 (0.90–0.96), indicating that shorter sleep duration is associated with increased CVD risk. Similarly, the HR for sleep irregularity was 1.04 (1.02–1.07), mirroring the findings of prior research that irregular sleep is associated with an increased risk of CVD.
Cox proportional hazard models hazard ratios for sleep onset time
| Base model | Adjusted Model 1 | Fully adjusted Model 2 | ||||
|---|---|---|---|---|---|---|
| Hazard ratio (95% CI) | P-value | Hazard ratio (95% CI) | P-value | Hazard ratio (95% CI) | P-value | |
| ≥12:00 a.m. | 1.35 (1.12–1.64) | <0.005 | 1.29 (1.06–1.57) | 0.01 | 1.25 (1.02–1.52) | 0.03 |
| 11:00 p.m.–11:59 p.m. | 1.11 (1.00–1.24) | 0.05 | 1.09 (0.98–1.22) | 0.1 | 1.12 (1.01–1.25) | 0.04 |
| 10:00 p.m.–10:59 p.m. | 1 (ref) | 1 (ref) | 1 (ref) | |||
| <10:00 p.m. | 1.38 (1.24–1.53) | <0.005 | 1.25 (1.12–1.39) | <0.005 | 1.24 (1.10–1.39) | < 0.005 |
| Sleep duration | 0.93 (0.90–0.96) | <0.005 | 0.97 (0.94–1.00) | 0.04 | ||
| Sleep irregularity | 1.04 (1.02–1.07) | <0.005 | 1.02 (0.99–1.05) | 0.12 | ||
The Base Model includes age and sex as covariates. Adjusted Model 1 is adjusted for Base Model features, sleep duration, and sleep irregularity. Adjusted Model 2 is adjusted for Adjusted Model 1 features, BMI, pre-existing diabetes, pre-existing hypertension, chronotype, Townsend Deprivation Index, systolic and diastolic blood pressure, smoking status, high-density lipoprotein cholesterol, and total cholesterol.
CI, confidence interval.
After adjustment for established CVD risk factors (Adjusted Model 2), the HRs decreased slightly but remained significant. The HRs from Adjusted Model 2 for the different SOT categories were 1.25 (95% CI, 1.02–1.52; P = 0.03) in the ≥12:00 a.m., 1.12 (95% CI, 1.01–1.25; P = 0.04) in the 11:00 p.m.–11:59 p.m. group, and 1.24 (95% CI, 1.10–1.39; P < 0.005) in the <10:00 p.m. group. Similarly, the HRs for sleep duration were 0.97 (95% CI, 0.94–1.00; P = 0.04), and 1.02 (95% CI, 0.99–1.05; P = 0.12) for sleep irregularity (Table 2).
However, a sensitivity analysis where models were constructed for males and females separately revealed that SOTs ≥12:00 a.m. (HR = 1.63; 95% CI, 1.20–2.21; P < 0.005) and <10:00 p.m. (HR = 1.34; 95% CI, 1.11–1.61; P < 0.005) were significantly associated with CVD risk in females, while only SOTs <10:00 p.m. (HR = 1.17; 95% CI, 1.01–1.35; P = 0.03) were significantly associated with increased CVD risk in males, after controlling for CVD and other covariates (Table 3; full details in Supplementary material online, Tables S11 and S12). Further sensitivity analyses concerning age categories (Supplementary material online, Tables S13–S15) and pre-existing conditions (Supplementary material online, Tables S1–S9) similarly did not impact the overall association. To ensure that present-but-undiagnosed CVD was not causing disturbed sleep timing and biasing the results, we carried out sensitivity analyses where either the first 12- or 18 months following accelerometer data collection were excluded (Supplementary material online, Tables S16 and S17). However, the overall associations between SOT and CVD risk persisted.
Sensitivity analysis for sleep onset time in males and females using the fully Adjusted Model 2 covariates
| Male (N = 36 812) | Female (N = 51 214) | |||||||
|---|---|---|---|---|---|---|---|---|
| Fully Adjusted Model 2 | ≥12:00 a.m. | 11:00 p.m.–11:59 p.m. | 10:00 p.m.–10:59 p.m. | <10:00 p.m. | ≥12:00 a.m. | 11:00 p.m.–11:59 p.m. | 10:00 p.m.–10:59 p.m. | <10:00 p.m. |
| Hazard ratio (95% CI) | 1.05 (0.81–1.35) | 1.08 (0.94–1.24) | 1 (ref) | 1.17 (1.01–1.35) | 1.63 (1.20–2.21) | 1.18 (0.99–1.40) | 1 (ref) | 1.34 (1.11–1.61) |
| P-value | 0.73 | 0.27 | 0.03 | <0.005 | 0.07 | <0.005 | ||
CI, confidence interval.
Discussion
To the best of our knowledge, this is one of the most extensive studies to date to investigate the relationship between objectively assessed sleep parameters and CVD risk. We have demonstrated a clear association between timing of sleep and CVD risk, particularly for women. While later SOTs were associated with an increased incidence of CVD, the relationship was U-shaped, agreeing with the idea that the optimum SOT falls within a specific range of the diurnal cycle and that deviations from this range, either too early or too late, may be problematic. The highest incidence of CVD was found in participants with SOTs after midnight, with the incidence of CVD falling with earlier SOTs, before rising again with SOTs <10 p.m. Our findings conform with one previous study where late bedtimes (>11:00 p.m.) on weekdays were associated with an increased risk of congestive heart failure.13
The relationship between sleep timing and CVD is understudied, with only a few studies that investigated this relationship. While sleep health can be thought of as a multidimensional construct including sleep quality, efficiency, duration, alertness, and timing, our investigation focused on sleep timing as an independent variable owing to its prior lack of study. The association between SOT outside of 10 p.m.–11 p.m. and CVD persisted even after adjustment for sleep duration and sleep irregularity. This suggests that the timing of sleep can affect CVD risk independently of other features that contribute to ‘poor’ sleep health. However, the U-shaped relationship between SOT and CVD risk does mirror the relationship between sleep duration and CVD risk. Both short and long self-reported sleep durations are associated with higher CVD risk.18
Sensitivity analyses concerning age categories or and pre-existing conditions did not impact the overall association. However, constructing separate models in males and females revealed a dimorphic pattern whereby the associations between SOT and CVD risk was stronger for females than males. In men, only SOTs <10 p.m. remained significant but with small associated risk. Differences in cardiovascular risk between women and men are long-established, with CVD classically described as a disease affecting elderly western males, in part due to women typically carrying a degree of cardioprotection. Post-menopause, however, rates of CVD in women rise to meet or even surpass male counterparts, likely resulting from decreased oestrogen.19 Poor sleep duration or quality may also account for some of the differences in CVD risk. For example, a recent study supports the idea of a sex-specific impact of suboptimal sleep in CVD, finding that disrupted sleep may have a more significant impact on CVD mortality risk in women than men.20 Our findings may suggest an increased risk of CVD for women in the presence of circadian rhythm disruption from sleep timing, independent of other factors.20
There is substantial evidence that sleep is related to other CVD risk factors, such as obesity and hypertension, with later bedtime in particular correlated with higher BMI.21,22 Timing of sleep has also been demonstrated to be negatively associated with glycaemic control in patients with type 2 diabetes mellitus.23 Jansen et al.24 found that Mexican adolescents with a weekday bedtime later than 11 p.m. had a 1.87 times higher risk of developing elevated blood pressure than the participants with a bedtime between 9 p.m. and 10 p.m., after accounting for sleep-related confounders. In our study, however, the association between timing of sleep and CVD incidence remained robust even after additional adjustment for important CVD risk factors, such as hypertension, diabetes, BMI, and smoking.
Although the findings of this article do not show causality, they mandate further research into sleep timing as an independent cardiac risk factor, particularly for women. Sleep timing would be an attractive target for interventions to reduce CVD risk owing to its minimal cost and invasiveness. This intervention could take the form of public health guidance, structured intervention programmes, or technology-based solutions such as smartphone apps. Importantly, this study demonstrates the value of using objectively collected ‘big data’ to assess sleep parameters as an alternative to subjective sleep diaries or journals.25 Wearable devices have the potential to improve real-time CVD risk surveillance through the passive collection of accelerometer data, which simultaneously can enable the elimination of the recall bias associated with retrospective questionnaires or interviews.
The major strength of this study is the UKB dataset: an unparalleled, longitudinal dataset encompassing non-traditional health data, such as accelerometer data, alongside genomics, prospective health record integration, and additional blood markers. Notably, most prior investigations into the relationships between sleep and CVD risk have used subjective reports of bedtime and sleep parameters, while our investigation is one of the largest studies employing objectively measured sleep parameters. Our use of objectively derived accelerometer data avoids the error due to recall bias that results from assessment using questionnaires.
However, the UKB cohort is predominantly White British and has an overrepresentation of individuals from higher socioeconomic backgrounds, resulting in its ‘healthier and wealthier’ phenomenon.26 This could mean that the presented findings may not generalize well to other populations, and further research in large samples more representative of the global population is required. Moreover, while the UKB has some records of night-shift work, only ∼5% of the cohort report ever engaging with it. This, in addition to the fact that occupational data were collected 3–10 years prior to accelerometry and includes no historical data on shift-working frequency, meant we could not reliably assess this high-risk demographic in isolation.
Although multiple studies validate the accuracy of sleep measurement via actigraphy, this method has some limitations. We found that the analysis of the accelerometer data did not perform very well if the participant had abnormal activity during sleep. Additionally, the HDCZA algorithm used to determine sleep timing, duration, and irregularity is imperfect with a c-statistic of 0.83 to detect the sleep period time window compared to polysomnography in those without sleep disorders. It is also true that individuals who are inactive for a long period of time may have their SOT incorrectly calculated, though steps in the GGIR processing are taken to address this on an individual basis. Additionally, a 7-day measurement is not necessarily the best representation of habitual sleeping, albeit standard in the field. While we accounted for the majority of traditional risk factors as potential confounders, limitations in the data meant that we could not include family history in our modelling in a meaningful way.
Lastly, the small size of the <10 p.m. group compared to the other SOT categories may weaken the conclusion of a U-shaped relationship between SOT and CVD risk.
Overall, our findings suggest a relationship between SOT and risk of developing CVD, particularly in women. As dimorphic patterns were seen between the sexes, we recommend further research into the potential underlying mechanisms and prospective studies from other geographies. Nevertheless, sleep timing represents an understudied and potentially novel risk factor that may be a valuable target for public health guidance in primary prevention of CVD. Our results also demonstrate the efficacy and convenience of passive, accelerometer-derived big data as a predictor of health outcomes.
Supplementary material
Supplementary material is available at European Heart Journal – Digital Health online.
Funding
This work was supported by Huma Therapeutics Ltd. The funder had no role in data collection, analysis, or interpretation of the data. The funder had no role in the writing of the report or the decision to submit the article for publication.
Conflict of interest: S.N., A.B.R., A.C.C., B.D.O., M.A., D.M., and D.P. are employees of Huma Therapeutics.
Data availability
The UKB dataset was obtained from the UKB (application number 55668). Data cannot be shared publicly owing to the violation of patient privacy and the absence of informed consent for data sharing.
References
