


Abstract
The aim of this study was to estimate the burden and risk factors for ischaemic heart disease (IHD) in 195 countries and territories from 1990 to 2017.
Data from the Global Burden of Disease Study 2017 were used. Prevalence, incidence, deaths, years lived with disability (YLDs), and years of life lost (YLLs) were metrics used to measure IHD burden. Population attributable fraction was used to estimate the proportion of IHD deaths attributable to potentially modifiable risk factors. Globally, in 2017, 126.5 million [95% uncertainty interval (UI) 118.6 to 134.7] people lived with IHD and 10.6 million (95% UI 9.6 to 11.8) new IHD cases occurred, resulting in 8.9 million (95% UI 8.8 to 9.1) deaths, 5.3 million (95% UI 3.7 to 7.2) YLDs, and 165.0 million (95% UI 162.2 to 168.6) YLLs. Between 1990 and 2017, despite the decrease in age-standardized rates, the global numbers of these burden metrics of IHD have significantly increased. The burden of IHD in 2017 and its temporal trends from 1990 to 2017 varied widely by geographic location. Among all potentially modifiable risk factors, age-standardized IHD deaths worldwide were primarily attributable to dietary risks, high systolic blood pressure, high LDL cholesterol, high fasting plasma glucose, tobacco use, and high body mass index in 2017.
Our results suggested that IHD remains a major public health challenge worldwide. More effective and targeted strategies aimed at implementing cost-effective interventions and addressing modifiable risk factors are urgently needed, particularly in geographies with high or increasing burden.
Introduction
Ischaemic heart disease (IHD) is a major contributor to the global disease burden, with devastating consequences in terms of human life and health.1 More than 7.0 million deaths were caused by IHD in 2010, making it still the leading cause of death worldwide.2 Although the age-standardized IHD mortality has decreased over the past few decades, the global burden of IHD (absolute numbers of disability-adjusted life years) has increased by 29% to 129 million from 1990 to 2010.3 Additionally, IHD is a major cause of catastrophic health expenditure. In the USA, IHD-related healthcare costs were projected to rise by 41% from $126.2 billion in 2010 to $177.5 billion in 2040.4 The cost of long-term management of IHD is equally high. Heart failure, the most common sequela of IHD, cost an estimated $108 billion annually worldwide.5
Accurate evaluation of IHD current burden and attributable risk factors is essential for formulating effective prevention and control strategies. Although the global burden of IHD was previously reported from the Global Burden of Diseases, Injuries, and Risk Factors Study (GBD) 2010, to the best of our knowledge, no updated study has provided detailed estimates for all countries, over time, covering the main risk factors for IHD after that.6–8 Therefore, we aimed to update and extend previous study by providing comprehensive and comparable information on IHD burden and attributable risk factors at the global, regional, and national levels from 1990 to 2017, based on the estimates of the most recent GBD 2017.
Methods
Data sources
This study is part of GBD 2017, which is designed to provide comprehensive and systematic estimations for 359 diseases and injuries; 282 causes of death; and 84 behavioural, environmental, and occupational, and metabolic risk factors from 1990 to 2017. Detailed methods used for GBD 2017 have been published previously.9–12 Because GBD 2017 used de-identified, aggregated data, a waiver of informed consent was reviewed and approved by the University of Washington Institutional Review Board.
In this study, data on the disease burden of IHD were obtained through an online query tool from the website of Institute for Health Metrics and Evaluation (IHME) (http://ghdx.healthdata.org/gbd-results-tool, accessed September 28, 2020). All cardiovascular diseases (CVDs) coded as 410-414.9 in the 9th revision of the International Classification of Diseases and Injuries (ICD-9) or I20-I25.9 in the ICD-10 were recognized as IHD.12 The original data sources used for the estimations of IHD can be found on the GBD 2017 Data Input Sources Tool website (http://ghdx.healthdata.org/gbd-2017/data-input-sources, accessed September 28, 2020). Detailed information about the estimation process of deaths and non-fatal outcomes of IHD was described in Supplementary material online, Text S1.
Definitions
To calculate years lived with disability (YLDs), IHD was firstly divided into seven severity levels: acute myocardial infarction, Days 1–2; acute myocardial infarction, Days 3–28; asymptomatic IHD following myocardial infarction; asymptomatic angina; mild angina; moderate angina; and severe angina. In addition to asymptomatic IHD and asymptomatic angina, each severity level was assigned a disability weight, which quantifies the magnitude of health loss associated with the severity level. More information about the estimation process of disability weight was described in Supplementary material online, Text S1. YLDs were finally calculated as the product of prevalence at each severity level and the corresponding disability weight. Years of life lost (YLLs) due to IHD were calculated by multiplying the number of deaths in each age group with a standard life expectancy at that age.9
Socio-demographic index (SDI) was a summary measure that quantifies the development status for each location-year.9–12 It ranged from 0 (worst) to 1 (best) and was calculated based on lag distributed income per capita, mean education for individuals aged 15 years or older, and total fertility rate under 25 years. The cut-off values used to determine SDI quintiles were computed using estimates from countries with populations over 1 million.12 According to SDI quintiles, 195 countries and territories were categorized into five groups: low-SDI, low-middle-SDI, middle-SDI, high-middle-SDI, and high-SDI quintiles.12
Risk factors were selected with the following criteria: sufficient evidence of causation with IHD, availability of exposure data, and potential for modification.10 In GBD 2017, 11 potentially modifiable risk factors, i.e. dietary risks, high systolic blood pressure, high LDL cholesterol, high fasting plasma glucose, tobacco use, high body mass index, air pollution, low physical activity, impaired kidney function, lead exposure, and alcohol use, were considered to be associated with IHD deaths. Details about definitions of these risk factors and methods for quantifying the percentage contributions of these risk factors to IHD deaths have been described in Supplementary material online, Text S1.
Statistical analyses
We computed counts, and age-standardized rates per 100 000 people, with 95% uncertainty intervals (UIs) to quantify the burden of IHD. Prevalence, incidence, deaths, YLDs, and YLLs were metrics used to measure the burden of IHD and reported by age, sex, year, location, and SDI. Age-standardized rate was calculated by direct standardization to the global age structure.13 UIs were calculated from 1000 draw-level estimates for each parameter. 95% UIs were defined as the 25th and 975th ranked values across all 1000 draws. The percentage contributions of major risk factors to age-standardized IHD deaths were calculated as population attributable fractions (PAFs), which represented the proportional reduction in age-standardized IHD deaths that would occur if the exposure to a risk factor was reduced to the theoretical minimum exposure level.10 The PAF for each risk factor incorporates all burden that is attributable to the risk factor, whether directly or indirectly.10 Thus, the cumulative impact of risk factors is not the simple addition of their individual contributions. Mediation adjustment is needed when aggregating the PAFs across multiple risk factors.10 For all estimates, a 95% UI excluding zero indicated statistically significant.
Results
In 2017, IHD affected 126.5 million (95% UI 118.6 to 134.7) people worldwide, an increase of 74.9% (95% UI 71.8 to 78.6) compared with 1990. The incident cases of IHD were 10.6 million (95% UI 9.6 to 11.8) in 2017, an increase of 51.8% (95% UI 48.8 to 54.9) compared with 1990. Despite the increases, the age-standardized prevalence and incidence rates of IHD from 1990 to 2017 decreased by −11.8% (95% UI −13.5 to −9.9) and −27.4% (95% UI −29.0 to −25.8), respectively, with the greatest decreases occurring in countries in the high-SDI and high-middle-SDI quintiles (Table 1).
Age-standardized prevalence, incidence, death, YLD, and YLL rates of ischaemic heart disease in 2017, and their percentage changes from 1990 to 2017, by sex, SDI quintile, and GBD region
| Prevalence | Incidence | Deaths | YLDs | YLLs | ||||||
|---|---|---|---|---|---|---|---|---|---|---|
| 2017 age-standardized rate per 100 000 people | Percentage change in age-standardized rates, 1990–2017 | 2017 age-standardized rate per 100 000 people | Percentage change in age-standardized rates, 1990–2017 | 2017 age-standardized rate per 100 000 people | Percentage change in age-standardized rates, 1990–2017 | 2017 age-standardized rate per 100 000 people | Percentage change in age-standardized rates, 1990–2017 | 2017 age-standardized rate per 100 000 people | Percentage change in age-standardized rates, 1990–2017 | |
| Global | 1583.7 (1484.5 to 1691.1) | −11.8% (−13.5 to −9.9) | 135.6 (122.2 to 150.4) | −27.4% (−29.0 to −25.8) | 116.9 (115.1 to 119.7) | −30.0% (−31.3 to −28.8) | 66.3 (45.9 to 90.7) | −15.5% (−16.5 to −14.6) | 2065.9 (2030.6 to 2111.7) | −28.0% (−29.7 to −26.5) |
| Sex | ||||||||||
| Male | 1835.8 (1720.7 to 1962.2) | −14.3% (−16.0 to −12.5) | 169.8 (154.0 to 187.3) | −29.0% (−30.5 to −27.4) | 144.4 (141.5 to 147.9) | −27.8% (−29.7 to −26.2) | 73.1 (50.6 to 99.7) | −16.5% (−17.5 to −15.5) | 2702.9 (2645.8 to 2766.8) | −25.7% (−27.9 to −23.8) |
| Female | 1361.3 (1274.8 to 1453.4) | −9.8% (−11.5 to −7.8) | 105.4 (94.3 to 117.4) | −26.6% (−28.5 to −24.7) | 93.3 (91.2 to 96.1) | −33.2% (−34.9 to −31.6) | 60.1 (41.6 to 82.7) | −14.8% (−16.0 to −13.7) | 1474.2 (1434.5 to 1515.1) | −32.1% (−34.4 to −29.9) |
| SDI quintiles | ||||||||||
| Low-SDI quintile | 1598.7 (1505.8 to 1702.8) | −3.3% (−4.8 to −1.6) | 126.4 (113.4 to 140.4) | −7.0% (−8.7 to −5.4) | 129.1 (122.3 to 137.4) | −6.7% (−12.6 to 1.0) | 69.6 (48.0 to 96.0) | −6.2% (−7.5 to −5.0) | 2534.4 (2414.2 to 2670.9) | −7.8% (−14.7 to 1.9) |
| Low-middle-SDI quintile | 1688.4 (1588.5 to 1799.0) | −6.1% (−7.9 to −3.7) | 148.1 (134.9 to 162.2) | −15.1% (−16.8 to −13.5) | 157.5 (151.2 to 164.4) | −9.0% (−13.8 to −4.3) | 71.8 (49.8 to 99.2) | −7.5% (−8.5 to −6.5) | 3036.7 (2915.7 to 3160.1) | −10.4% (−15.2 to −5.6) |
| Middle-SDI quintile | 1411.4 (1323.8 to 1501.6) | −5.6% (−6.9 to −4.0) | 104.6 (93.5 to 117.2) | −15.0% (−17.0 to −13.1) | 120.4 (117.7 to 123.2) | −7.2% (−11.3 to −3.6) | 65.4 (45.0 to 90.4) | −6.3% (−7.2 to −5.4) | 2066.7 (2017.6 to 2120.8) | −10.1% (−13.9 to −6.7) |
| High-middle-SDI quintile | 1732.9 (1624.4 to 1848.4) | −13.8% (−15.2 to −12.2) | 145.5 (130.4 to 162.3) | −31.3% (−33.3 to −29.2) | 151.4 (148.6 to 154.2) | −27.8% (−29.3 to −26.3) | 75.1 (52.0 to 103.4) | −12.6% (−13.6 to −11.6) | 2373.8 (2325.7 to 2422.0) | −30.7% (−32.3 to −29.0) |
| High-SDI quintile | 1535.4 (1426.9 to 1658.5) | −17.1% (−19.9 to −13.8) | 154.2 (139.3 to 170.0) | −30.8% (−32.3 to −29.2) | 65.7 (64.3 to 68.1) | −58.4% (−59.2 to −57.3) | 52.6 (36.7 to 71.5) | −31.4% (−33.0 to −29.6) | 1012.3 (993.7 to 1039.0) | −60.1% (−60.9 to −59.3) |
| GBD region | ||||||||||
| Central Sub-Saharan Africa | 1324.9 (1237.8 to 1421.9) | −13.9% (−16.7 to −10.9) | 125.5 (112.2 to 140.6) | −17.0% (−20.3 to −13.6) | 139.1 (120.9 to 159.5) | −18.1% (−27.0 to −7.9) | 60.0 (41.7 to 81.7) | −13.8% (−16.8 to −10.8) | 2500.2 (2187.9 to 2848.3) | −18.5% (−28.5 to −7.9) |
| Eastern Sub-Saharan Africa | 1561.6 (1459.2 to 1673.1) | −8.0% (−9.2 to −6.5) | 104.2 (90.9 to 118.7) | −13.5% (−15.3 to −11.8) | 99.0 (88.3 to 111.6) | −24.2% (−32.2 to −16.2) | 79.9 (54.9 to 109.4) | −8.0% (−9.2 to −6.8) | 1785.5 (1612.5 to 1984.4) | −25.7% (−35.0 to −15.9) |
| Southern Sub-Saharan Africa | 1573.6 (1458.3 to 1694.0) | −10.1% (−11.5 to −8.6) | 113.9 (99.2 to 130.2) | −8.0% (−9.3 to −6.7) | 94.9 (91.2 to 99.3) | 3.8% (−4.2 to 12.6) | 75.0 (51.8 to 102.2) | −11.2% (−12.5 to −9.7) | 1638.5 (1565.9 to 1713.4) | −4.2% (−12.0 to 4.2) |
| Western Sub-Saharan Africa | 1460.5 (1382.0 to 1543.2) | −8.4% (−10.2 to −6.6) | 102.0 (90.1 to 114.5) | −13.2% (−15.8 to −10.6) | 104.0 (93.2 to 117.8) | −11.2% (−22.7 to 1.8) | 62.9 (42.9 to 87.3) | −8.1% (−10.4 to −5.7) | 1756.2 (1567.7 to 2002.4) | −9.7% (−21.3 to 4.5) |
| Andean Latin America | 1237.8 (1154.4 to 1325.4) | −5.9% (−8.2 to −3.2) | 78.8 (68.5 to 90.1) | −20.4% (−23.9 to −17.2) | 60.6 (56.3 to 65.3) | −45.7% (−49.9 to −40.9) | 64.1 (44.0 to 87.9) | −4.0% (−6.9 to −0.6) | 1008.9 (929.6 to 1099.2) | −47.0% (−51.8 to −41.8) |
| Tropical Latin America | 1565.4 (1467.0 to 1671.2) | −6.6% (−7.9 to −5.2) | 78.9 (68.9 to 89.4) | −29.1% (−31.3 to −26.7) | 80.4 (78.5 to 82.0) | −52.2% (−53.4 to −51.0) | 76.8 (52.6 to 106.6) | −4.4% (−5.8 to −3.0) | 1529.5 (1487.1 to 1561.0) | −50.0% (−51.4 to −48.6) |
| Central Latin America | 1541.6 (1442.8 to 1646.6) | −8.7% (−9.9 to −7.3) | 96.8 (84.9 to 109.8) | −20.5% (−22.3 to −18.8) | 92.6 (88.3 to 96.3) | −29.4% (−32.6 to −26.0) | 77.9 (53.8 to 107.5) | −7.6% (−8.8 to −6.4) | 1538.4 (1475.2 to 1596.9) | −31.0% (−34.2 to −27.9) |
| Southern Latin America | 1237.8 (1157.1 to 1323.7) | −12.6% (−16.0 to −9.2) | 139.7 (124.5 to 155.4) | −32.1% (−35.7 to −28.7) | 82.8 (77.1 to 89.1) | −51.3% (−54.7 to −47.5) | 40.1 (27.8 to 54.7) | −22.2% (−25.5 to −18.7) | 1350.8 (1244.5 to 1466.2) | −51.4% (−55.2 to −47.2) |
| Caribbean | 1645.3 (1543.3 to 1749.4) | −9.6% (−11.7 to −7.5) | 120.0 (105.7 to 135.6) | −28.5% (−31.7 to −25.7) | 115.2 (109.0 to 121.6) | −38.5% (−41.8 to −35.1) | 78.8 (54.5 to 108.9) | −9.7% (−11.6 to −7.7) | 2088.1 (1956.6 to 2234.0) | −36.0% (−40.0 to −31.8) |
| Central Europe | 2519.5 (2369.5 to 2675.6) | −18.4% (−20.5 to −15.9) | 195.7 (180.1 to 212.6) | −41.5% (−44.0 to −38.5) | 157.0 (153.7 to 161.8) | −46.0% (−47.2 to −44.4) | 112.3 (77.7 to 153.6) | −19.7% (−21.1 to −18.2) | 2306.6 (2252.9 to 2377.0) | −50.9% (−52.0 to −49.4) |
| Eastern Europe | 2649.8 (2475.4 to 2836.3) | −3.9% (−5.5 to −1.9) | 257.3 (229.0 to 289.0) | −19.6% (−22.4 to −17.0) | 276.9 (272.0 to 284.0) | −11.8% (−13.5 to −9.4) | 107.6 (74.6 to 147.9) | −1.8% (−2.9 to −0.6) | 4572.9 (4480.3 to 4713.6) | −10.5% (−12.6 to −7.3) |
| North Africa and Middle East | 2518.1 (2365.4 to 2692.8) | −7.1% (−10.1 to −3.1) | 273.8 (250.4 to 297.2) | −23.7% (−25.9 to −21.6) | 193.5 (185.1 to 204.0) | −34.9% (−38.1 to −31.6) | 91.2 (63.5 to 124.3) | −8.7% (−10.0 to −7.4) | 3528.9 (3353.2 to 3719.3) | −38.2% (−41.7 to −34.1) |
| Central Asia | 2150.9 (1999.6 to 2303.2) | −7.4% (−10.1 to −4.3) | 263.6 (246.1 to 282.2) | −6.5% (−8.6 to −4.3) | 350.0 (337.1 to 364.0) | 16.7% (11.9 to 21.9) | 106.0 (73.7 to 144.7) | −4.0% (−5.8 to −2.0) | 5656.4 (5417.8 to 5920.1) | 9.2% (4.4 to 14.5) |
| South Asia | 1617.9 (1513.4 to 1728.2) | −5.3% (−6.9 to −3.7) | 132.2 (119.3 to 146.2) | −11.5% (−13.4 to −9.5) | 165.2 (156.6 to 172.4) | 1.9% (−4.4 to 7.8) | 71.6 (49.6 to 98.7) | −7.3% (−8.4 to −6.1) | 3238.6 (3101.6 to 3372.8) | −2.9% (−8.4 to 2.8) |
| Southeast Asia | 1470.5 (1385.8 to 1560.2) | −13.8% (−15.1 to −12.3) | 97.4 (87.4 to 108.5) | −21.0% (−23.1 to −19.1) | 107.7 (103.5 to 112.6) | −18.9% (−23.9 to −13.9) | 68.8 (47.1 to 95.2) | −13.6% (−14.9 to −12.4) | 2045.7 (1959.2 to 2140.5) | −17.7% (−22.9 to −12.6) |
| East Asia | 1185.4 (1108.4 to 1267.9) | 1.1% (−0.6 to 3.0) | 86.1 (76.1 to 97.2) | −4.9% (−7.1 to −2.2) | 105.7 (102.4 to 109.2) | 18.9% (8.8 to 25.6) | 54.4 (37.4 to 75.2) | −0.3% (−1.8 to 1.1) | 1562.1 (1510.8 to 1618.2) | 4.1% (−3.9 to 10.3) |
| Oceania | 1821.2 (1720.9 to 1934.9) | −7.5% (−9.5 to −5.2) | 119.5 (104.4 to 136.1) | −0.6% (−4.0 to 3.0) | 254.9 (231.7 to 281.7) | 6.4% (−4.0 to 17.6) | 80.5 (55.5 to 111.2) | −9.4% (−12.2 to −6.5) | 5916.5 (5207.7 to 6763.3) | 7.0% (−5.9 to 21.9) |
| High-income Asia Pacific | 1060.7 (971.7 to 1154.9) | −10.6% (−13.8 to −6.9) | 100.0 (87.3 to 114.0) | −19.4% (−21.4 to −17.6) | 32.6 (31.4 to 33.7) | −63.1% (−64.4 to −61.7) | 39.5 (27.4 to 53.8) | −24.6% (−27.1 to −22.1) | 491.1 (469.7 to 510.4) | −64.1% (−65.6 to −62.6) |
| High-income North America | 1721.3 (1570.1 to 1893.6) | −14.8% (−18.2 to −10.9) | 189.3 (173.5 to 206.6) | −27.1% (−30.5 to −23.6) | 85.9 (83.5 to 88.3) | −50.9% (−52.2 to −49.6) | 43.4 (30.6 to 58.6) | −26.1% (−29.9 to −22.0) | 1419.4 (1376.7 to 1461.3) | −51.3% (−52.9 to −49.7) |
| Western Europe | 1539.1 (1433.7 to 1649.1) | −16.1% (−19.3 to −12.6) | 158.5 (142.7 to 175.8) | −28.5% (−31.6 to −25.4) | 59.9 (57.7 to 63.7) | −61.0% (−62.4 to −58.9) | 56.5 (39.0 to 77.2) | −35.6% (−37.1 to −34.0) | 858.5 (825.9 to 897.9) | −64.8% (−66.1 to −63.2) |
| Australasia | 1563.3 (1435.8 to 1701.1) | −23.1% (−27.0 to −18.5) | 158.8 (141.2 to 178.3) | −40.2% (−44.0 to −36.3) | 59.5 (55.3 to 64.0) | −65.7% (−68.2 to −63.2) | 48.4 (33.7 to 66.0) | −37.4% (−40.3 to −34.4) | 836.6 (769.6 to 911.1) | −69.8% (−72.2 to −67.2) |
Data in parentheses are 95% uncertainty intervals.
GBD, Global Burden of Disease, Injuries, and Risk Factors Study; SDI, socio-demographic index; YLDs, years lived with disability; YLLs, years of life lost.
The global number of IHD-related deaths was 8.9 million (95% UI 8.8 to 9.1) in 2017, an increase of 52.3% (95% UI 49.1 to 55.0) from 5.9 million (95% UI 5.8 to 6.0) in 1990. The IHD-related deaths constituted 16.0% (95% UI 15.7 to 16.3) of all deaths globally in 2017 compared with 12.6% (95% UI 12.4 to 12.9) in 1990. Additionally, IHD contributed to 5.3 million (95% UI 3.7 to 7.2) YLDs and 165.0 million (95% UI 162.2 to 168.6) YLLs globally in 2017, an increase of 67.7% (95% UI 66.1 to 69.4) and 41.8% (95% UI 38.5 to 44.9) compared with 1990, respectively. Conversely, between 1990 and 2017, the age-standardized death, YLD, and YLL rates of IHD decreased by −30.0% (95% UI −31.3 to −28.8), −15.5% (95% UI −16.5 to −14.6), and −28.0% (95% UI −29.7 to −26.5), respectively (Table 1). The greatest decreases in age-standardized death, YLD, and YLL rates of IHD were all seen in countries in the high-SDI quintile, followed by countries in the high-middle-SDI quintile.
Globally, more males than females were affected by IHD: the numbers and age-standardized rates of prevalent cases, incident cases, deaths, YLDs, and YLLs of IHD were all higher in males than in females across all years (Table 1, Supplementary material online, Table S1 and Figures S1 and S2). Nevertheless, by age group, in 2017 the numbers of prevalent cases, incident cases, deaths, and YLLs of IHD were higher in females than in males after 75–79 years, and the numbers of YLDs were higher in females than in males after 70–74 years (Figure 1 and Supplementary material online, Figure S3). Additionally, IHD-related age-specific incidence, death, YLD, and YLL rates tended to increase with age in both sexes, whereas prevalence rates declined after 85–89 years in both sexes.
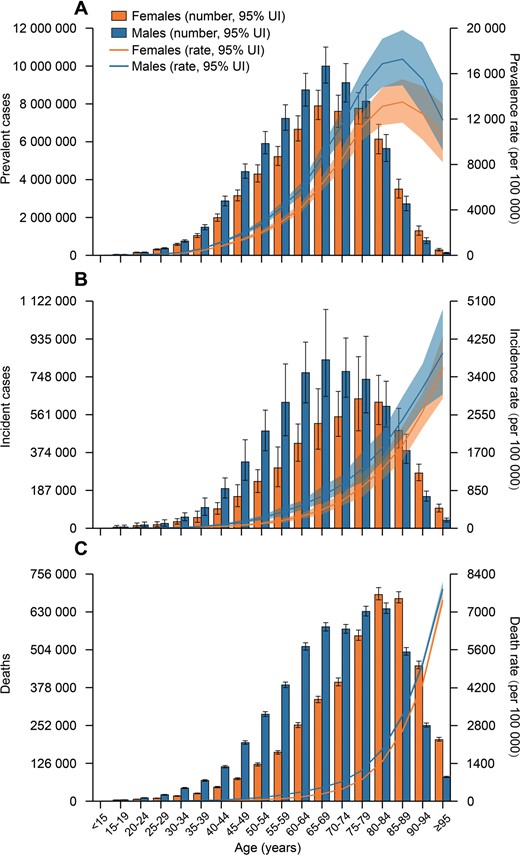
Age-specific numbers and rates of prevalent cases (A), incident cases (B), and deaths (C) of ischaemic heart disease by sex, 2017. Error bars indicate the 95% uncertainty interval (UI) for numbers. Shading indicates the 95% UI for rates.
Across 21 GBD regions, the highest age-standardized incidence and death rates of IHD in 2017 were seen in North Africa and Middle East [273.8 (95% UI 250.4 to 297.2) per 100 000 people] and Central Asia [350.0 (95% UI 337.1 to 364.0) per 100 000 people], respectively; whereas the lowest age-standardized incidence and death rates were seen in Andean Latin America [78.8 (95% UI 68.5 to 90.1) per 100 000 people] and high-income Asia Pacific [32.6 (95% UI 31.4 to 33.7) per 100 000 people], respectively (Table 1). Among all countries, Uzbekistan had the highest age-standardized incidence [476.4 (95% UI 453.0 to 503.9) per 100 000 people] and death [534.2 (95% UI 488.1 to 580.0) per 100 000 people] rates of IHD in 2017 (Figure 2 and Supplementary material online, Table S2), whereas Seychelles had the lowest age-standardized incidence rate [65.1 (95% UI 55.9 to 75.7) per 100 000 people] and South Korea had the lowest age-standardized death rate [32.0 (95% UI 29.7 to 34.5) per 100 000 people]. The variations in other IHD burden metrics (prevalence, YLDs, and YLLs) by location in 2017 can be found in Table 1 and Supplementary material online, Table S2.
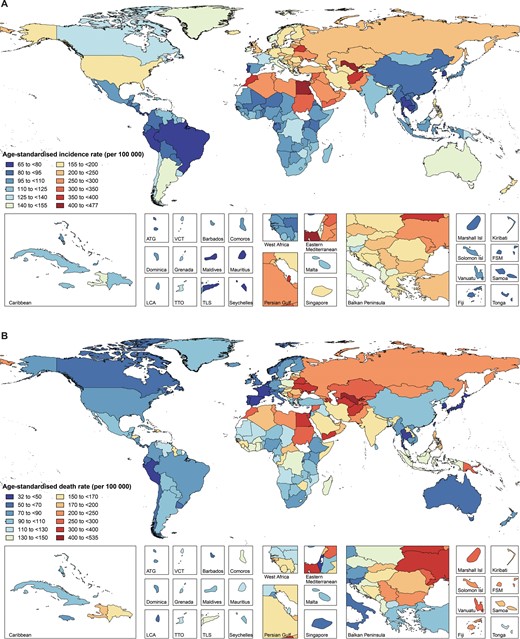
Age-standardized incidence (A) and death (B) rates of ischaemic heart disease across 195 countries and territories for both sexes, 2017. ATG, Antigua and Barbuda; FSM, Federated States of Micronesia; Isl, Islands; LCA, Saint Lucia; TLS, Timor-Leste; TTO, Trinidad and Tobago; VCT, Saint Vincent and the Grenadines.
From 1990 to 2017, the age-standardized incidence rates of IHD sharply decreased in regions with relatively high SDI, with the exception of high-income Asia Pacific, which already had a very low age-standardized incidence rate (Table 1 and Figure 3). The greatest decrease in age-standardized incidence rates was seen in Central Europe [−41.5% (95% UI −44.0 to −38.5)], followed by Australasia [−40.2% (95% UI −44.0 to −36.3)]. Portugal was the country with the greatest decrease in age-standardized incidence rate [−48.3% (95% UI −51.7 to −44.8)]. Regions with relatively high SDI also had the greatest decreases in age-standardized death rates of IHD from 1990 to 2017 (Table 1 and Figure 3). South Korea was the country with the greatest decrease in age-standardized death rate [−78.2% (95% UI −80.0 to −76.2)]. Notably, there was an increase in age-standardized death rates in several regions, especially in East Asia [18.9% (95% UI 8.8 to 25.6)]. Between 1990 and 2017, about 38.2% of the increase in global number of IHD-related deaths occurred in China, with China having the biggest increase in number of deaths over the study period compared to other countries.
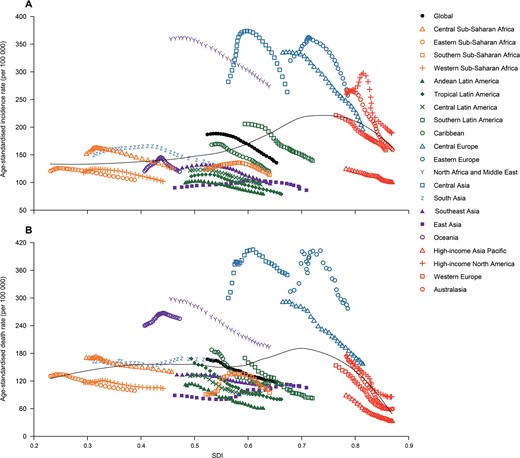
Trend in age-standardized incidence (A) and death (B) rates of ischaemic heart disease globally and for 21 GBD regions by socio-demographic index, 1990–2017. For each region, points from left to right depict estimates from each year from 1990 to 2017. GBD, Global Burden of Disease, Injuries, and Risk Factors Study.
Among all potentially modifiable risk factors quantified in GBD 2017, age-standardized IHD deaths worldwide in 2017 were primarily attributable to dietary risks [69.2% (95% UI 61.7 to 76.6)], followed by high systolic blood pressure [54.4% (95% UI 44.4 to 64.5)], high LDL cholesterol [41.9% (95% UI 31.7 to 52.9)], high fasting plasma glucose [25.5% (95% UI 14.7 to 40.9)], tobacco use [20.6% (95% UI 19.7 to 21.6)], and high body mass index [17.6% (95% UI 10.6 to 25.9)]. The percentage contributions of these risk factors to age-standardized IHD deaths in 2017 by sex, SDI quintile, and GBD region were presented in Figure 4 and Supplementary material online, Table S3. The percentage contribution of tobacco use to age-standardized IHD deaths was much larger in males than in females. Notably, the percentage contribution of alcohol use to age-standardized IHD deaths was −3.6% (95% UI −6.2 to −0.9) in males and 0.1% (95% UI −4.1 to 4.2) in females. By SDI quintile, the percentage contributions of high fasting plasma glucose, high body mass index, and low physical activity to age-standardized IHD deaths were largest in countries in the high-SDI quintile in both sexes, whereas the percentage contributions of air pollution and lead exposure to age-standardized IHD deaths increased with decreasing SDI in both sexes (Supplementary material online, Table S3). Globally, from 1990 to 2017, there were upward trends in the percentage contributions of high fasting plasma glucose, high body mass index, and lead exposure to age-standardized IHD deaths in both sexes, whereas downward trends were observed for all other risk factors in both sexes (Supplementary material online, Table S3).
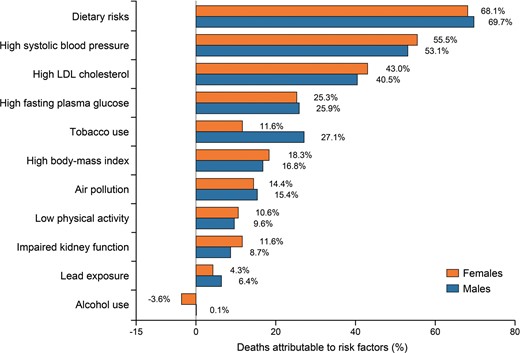
Percentage contributions of major risk factors to ischaemic heart disease age-standardized deaths by sex, 2017. The cumulative impact of risk factors is not the simple addition of their individual contributions as the risk factors may overlap. Mediation adjustment is needed when aggregating the population attributable fractions across multiple risk factors.
Discussion
The present study provided an up-to-date overview of global IHD burden from 1990 to 2017, with particular attention paid to its temporal trends and attributable risk factors. Worldwide, an estimated 126.5 million individuals lived with IHD and 10.6 million new IHD cases occurred in 2017, contributing to 8.9 million deaths, 5.3 million YLDs and 165.0 million YLLs. Despite the age-standardized prevalence and incidence rates of IHD have decreased between 1990 and 2017, the absolute numbers of them have significantly increased as a result of population growth and ageing. Additionally, compared with GBD 2010,8 we added attributable risk factors analyses in the present study and found that the top three potential modifiable risk factors for IHD deaths in 2017 were dietary risks, high systolic blood pressure and high LDL cholesterol.
Consistent with previous studies,2,7,8 our results indicated that IHD remains a substantial public health challenge worldwide. Although the absolute numbers of YLDs were dwarfed by YLLs attributable to IHD deaths, the reductions in age-standardized YLDs (−15.5%) have been much smaller than YLLs (−28.0%), suggesting that future IHD treatment strategies should pay more attention to improve the quality of life of IHD patients. Moreover, more males than females were affected by IHD worldwide, as the age-specific morbidity, mortality, YLD and YLL rates of IHD were universally higher in males than females across all age groups. Historically, IHD resulted in a greater mortality in females compared with males.14 The focus on sex-difference research in CVD has resulted in improved clinical outcomes in females, and for the first time, in 2014, more males than females died of CVD in the USA since 1984.15 The recent Prospective Urban Rural Epidemiological study reported that treatments for CVD were more common in females than males in primary prevention, and the reverse was seen in secondary prevention; however, consistently better outcomes were observed in females than in males.16 Therefore, improving IHD prevention and treatment should be vigorously pursued in both sexes. Furthermore, we found that both morbidity and mortality of IHD peaked in the elderly. Although the biological changes and unique features of disease management in elderly adults require cautious treatment decisions,17 they have been markedly underrepresented in major cardiovascular trials,18,19 as well as in secondary cardiovascular prevention and rehabilitation programmes.20,21 Given the acceleration of global ageing, more and better research is urgently needed to fill the knowledge gap regarding evidence-based care of elderly adults with IHD.
Compared with the GBD 2010 analysis of IHD,8 North Africa/Middle East and Central Asia continued to experience a high IHD burden, whereas Central European has achieved remarkable reductions in IHD mortality, which could serve as a road map for former Soviet Union countries that are seeking to reverse the epidemic of IHD. Notably, East Asia has witnessed the greatest rise of the age-standardized death rate between 1990 and 2017. Approximately 38.2% of the global growth in number of IHD-related deaths occurred in China. Interestingly, disparities in IHD burden were also observed in provinces of China, which may be due to different exposures to risk factors and access to effective health care interventions.6 These findings call for increased programmes and interventions to address the burden of IHD in these ‘hot spots’. And both subnational and national research, surveys and vital statistics on IHD burden are encouraged in these regions to guide public health policies.
As expected, through better management of IHD and primary prevention,22 the greatest decline in age-standardized incidence, death, YLD, and YLL rates of IHD were all seen in regions with relatively high SDI. Indeed, there remains much room for reducing IHD burden in regions with relatively high SDI, especially for the vulnerable individuals of low socioeconomic status.23,24 It is worth noting that more than 50% of IHD deaths occurred in countries in middle-, low-middle and low-SDI quintiles, but progress in these countries have been very slow or even stagnant. Currently, promoting the availability and affordability for acute coronary syndrome management, as well as the secondary prevention of IHD are considered as paramount approaches in these countries.25,26 Nevertheless, primary prevention programs including multi-level approaches at the population and individual levels are also warranted, in that our research and other studies have consistently shown an increasing trend of IHD-related risk factors over the past decades in these countries.27–29
In 2017, except for age and other non-modifiable risk factors, dietary risks, high systolic blood pressure, and high LDL cholesterol remained the top three contributors to IHD deaths worldwide. Unfortunately, there was no remarkable decline in PAFs of them since 1990, which is in line with other studies.10 Therefore, multiple efforts are still needed to create healthy lifestyles combined with pharmacological treatment of these risk factors. Moreover, there were upward trends in the percentage contributions of high fasting plasma glucose, high body-mass index, and lead exposure to IHD deaths in both sexes from 1990 to 2017. Perhaps most concerning are high fasting plasma glucose and high body mass index, since they have become the modern epidemics worldwide.29,30 Additionally, tobacco use ranked the fourth attributable risk factor in males but only seventh in females. The global prevalence of smoking has decreased by 28.4% in males and 34.4% in females since 1990.10 Intriguingly, the proportion of IHD deaths attributable to tobacco use declined by approximately 32.8% in females, a reduction similar to the reduction in smoking rate, whereas the PAFs of tobacco use decreased only slightly from 1990 (32.6%) to 2017 (27.1%) in males. This gender-difference should also be considered by policymakers when planning future strategies and implementing tobacco-related policies.
Limitations
Our study has several limitations. Firstly, although ICD codes are widely accepted for death certification, and GBD 2017 method has made substantial efforts to improve data quality, the misclassification of IHD death cannot be fully avoided because CVD are complex and often attended by coexisting conditions. Secondly, the lack of follow-up data on non-fatal IHD patients who are identified in cross-sectional surveys may pose a great challenge in accurately determining the IHD burden. Thirdly, the socio-cultural and ethnic differences were not captured by the GBD Study models. These differences were frequently associated with health behaviours and risk factors that affect the global burden of IHD. Fourthly, the definition of alcohol use in its original data sources was not all quantitative in GBD 2017,10 which may partly explain the paradox in the percentage contributions of alcohol use to age-standardized IHD deaths. Finally, data quality is another limitation of the present investigation, in that a comprehensive and comparable capture of participants between 1990 and 2017 was not always possible. However, statistically robust approaches have been applied in GBD 2017 in order to overcome data scarcity in some countries and deal with uncertainty.
Conclusions
This study has systematically evaluated the burden of IHD from 1990 to 2017, and large regional and national variations in the burden were observed. Although we have made great achievements in IHD prevention and treatment, especially in regions with relatively high SDI, a substantial proportion of global disease burden was still attributed to IHD. As IHD is largely preventable and treatable, more strategies aimed at implementing cost-effective interventions and addressing modifiable risk factors are urgently needed, particularly in geographies with high or increasing burden.
Supplementary material
Supplementary material is available at European Heart Journal – Quality of Care and Clinical Outcomes online.
Acknowledgements
The authors would like to thank all members of the Institute for Health Metrics and Evaluation (IHME), and all collaborators involved in GBD 2017 study.
Funding
This study was supported by the National Natural Science Foundation of China (81800393), and Hospital Pharmacy Research Fund of Guangdong (2019YX18). The funders of this research had no role in the design of the GBD estimation process, collection or analysis of data, interpretation of results, or in the writing of this manuscript.
Conflict of interest: none declared.
Data availability statement
The data underlying this article were derived from sources in the public domain: Institute for Health Metrics and Evaluation (IHME), at http://ghdx.healthdata.org/gbd-results-tool, accessed September 28, 2020.
