


Abstract
The aim of this study was to develop standard cephalometric values for Slovenians in the period of the mixed dentition. Eighty-eight children were included in the study (46 girls and 42 boys, mean age 9.31 ± 1.52 years). The selection criteria were: in the mixed dentition, a score of the modified Eismann method for an objective assessment of malocclusion of less than 15 points, the absence of aplasia and supernumerary teeth, no congential anomalies and no previous orthodontic treatment. Twenty-five cephalometric measurements were performed twice to analyse the size and shape of the craniofacial complex. The reliability of the measurements was assessed by correlation coefficients, regression, and analysis of inter-subject differences; satisfactory results were obtained. The differences between boys and girls and between those in the early and late mixed dentition period were tested with a two-way analysis of variance.
The most pronounced changes between the early and late mixed dentition were observed in the vertical skeletal relationships: a decrease in mandibular inclination, interbasal angle and gonial angle, and an increase in anterior and posterior face height. Sagittal skeletal relationships remained constant from the early to the late mixed dentition. No significant differences were found between the observed developmental stages. Significant differences between genders were found only for anterior and posterior face height, with boys showing larger values (P ≤ 0.001).
As there were no significant differences between the early and late mixed dentition, the mean measurement values of the total sample can be used as cephalometric standards for Slovenians in the mixed dentition period.
Introduction
Cephalometric analysis is an important part of morphological diagnostic procedures in orthodontics, allowing changes associated with growth and orthodontic treatment to be observed. To diagnose and classify a malocclusion, the measured values of cephalometric parameters are compared with standard values. A large number of cephalometric standards have been developed for adult populations and for children in the period of growth and development (Downs, 1952; Coben, 1955; Ricketts, 1957; Steiner, 1959; Riolo et al., 1974; Broadbent et al., 1975; Hasund, 1977; Burstone et al., 1979; Bishara, 1981; Muretic, 1982; Droschl, 1984; Holdaway, 1984; McNamara, 1984; Haavikko and Rakhamo, 1989; El-Batouti et al., 1994; Hamdan and Rock, 2001).
Differences in the dentofacial relationships of various ethnic groups have been observed (Bishara and Fernandez, 1985; Trenouth et al., 1985, 1999; Bishara et al., 1990; Ben-Bassat et al., 1992; Huang et al., 1998). Cephalometric measurements taken from one population may not be applicable for clinical use in a different population. Knowledge of the normal dentofacial pattern of each ethnic group will ensure improved treatment success and the establishment of optimal facial harmony (Argyropolous and Sassouni, 1989). Therefore it is important to develop standards for various populations.
In some of the studies, gender differences in cephalometric parameters have been observed (Broadbent et al., 1975; Droschl, 1984; Bishara and Fernandez, 1985; El-Batouti et al., 1994).
The selection criteria of the samples from which standard values were developed differ a great deal. Some researchers have used patients selected on the basis of ideal (Franchi et al., 1998), normal (Taylor and Hitchock, 1966) and good (Broadbent et al., 1975) occlusion. Droschl (1984) and Hamdan and Rock (2001) included subjects with Class I malocclusions, while Ben-Bassat et al. (1992) and El Batouti et al. (1994) used subjects with a clinically acceptable normal occlusion and no apparent facial disharmony. Other studies have developed standard values from unselected samples (Ricketts, 1957; Cooke and Wei, 1989).
The shape and size of the craniofacial complex changes with age. The values of cephalometric measurements are also related to age (Riolo et al., 1974; Broadbent et al., 1975; Bishara, 1981; Droschl, 1984; Trenouth et al., 1985; Haaviko and Rakhamo, 1989; El-Batouti et al., 1994). Hence, cephalometric standards should be available for different age groups (El-Batouti et al., 1994). The majority of available standard values are developed according to chronological age, while only a few are established according to dental age. Tollaro et al. (1996) prepared floating norms for assessment of the craniofacial pattern in the primary dentition, and McNamara (1984) published standard values for the period of mixed dentition. Floating norms for the permanent dentiton were determined by Segner (1989). Dental age and severity of malocclusion play an important role in treatment planning (DiBiase, 2002; McIntyre, 2004).
The purpose of this study was to develop cephalometric standards for Slovenians in the early and late mixed dentition periods.
Subjects and methods
Ethical approval for the study was obtained from the Medical Ethics Committee of the Ministry of Health of Slovenia (reference KME SSp/02/01).
Eighty-eight children (46 girls and 42 boys) in the mixed dentition period (mean age 9.31 years, SD = 1.52) were selected from the files of the Department of Orthodontics, University of Ljubljana, Slovenia.
An interview, intraoral examination, panoramic radiograph, study cast and cephalogram were obtained from all the participants.
Dental age was determined according to the erupted permanent teeth in the oral cavity (Proffit and Ackermann, 1993). The sample was then divided into two groups according to dental age: early (dental age 6–10 years) and late (dental age 11–14 years) mixed dentition. The chronological age of the subjects in the first group was between 6.4 and 11.6 years (mean 8.5 years, SD 1.0 years), while in the second group it was between 7.6 and 13.5 years (mean 10.6 years, SD 1.3 years).
The study casts were assessed using a modification of the method of Eismann (1980) for the objective assessment of malocclusion in the mixed dentition (Farčnik et al., 1985). Morphological signs were measured and numerically evaluated. Anterior and posterior crowding, rotations and inclinations of the incisors and canines, anterior open bite, anterior crossbite, overbite, overjet, sagittal and transversal occlusion were assessed. Only those children whose score did not exceed 15 points were included in the study. The other inclusion criteria were the absence of aplasia and supernumerary teeth, no congential anomalies and no previous orthodontic treatment. One hundred and seventy-two children were originally assessed and 84 excluded.
Cephalograms were taken under standard conditions: the distance from focus to the median plane of the patient's head was 150 cm, and the median plane–film distance was 10 cm. The cephalograms were taken with the subjects standing and the head positioned in the cephalostat and orientated to the Frankfort horizontal plane with the teeth in maximum intercuspation. The magnification of 10 per cent was taken into account in the linear measurements.
The films were traced and subsequently measured twice by hand. The two tracing procedures were carried out by the same orthodontist (MD) who performed all the measurements, in order to avoid calibration problems.
Cephalometric analysis
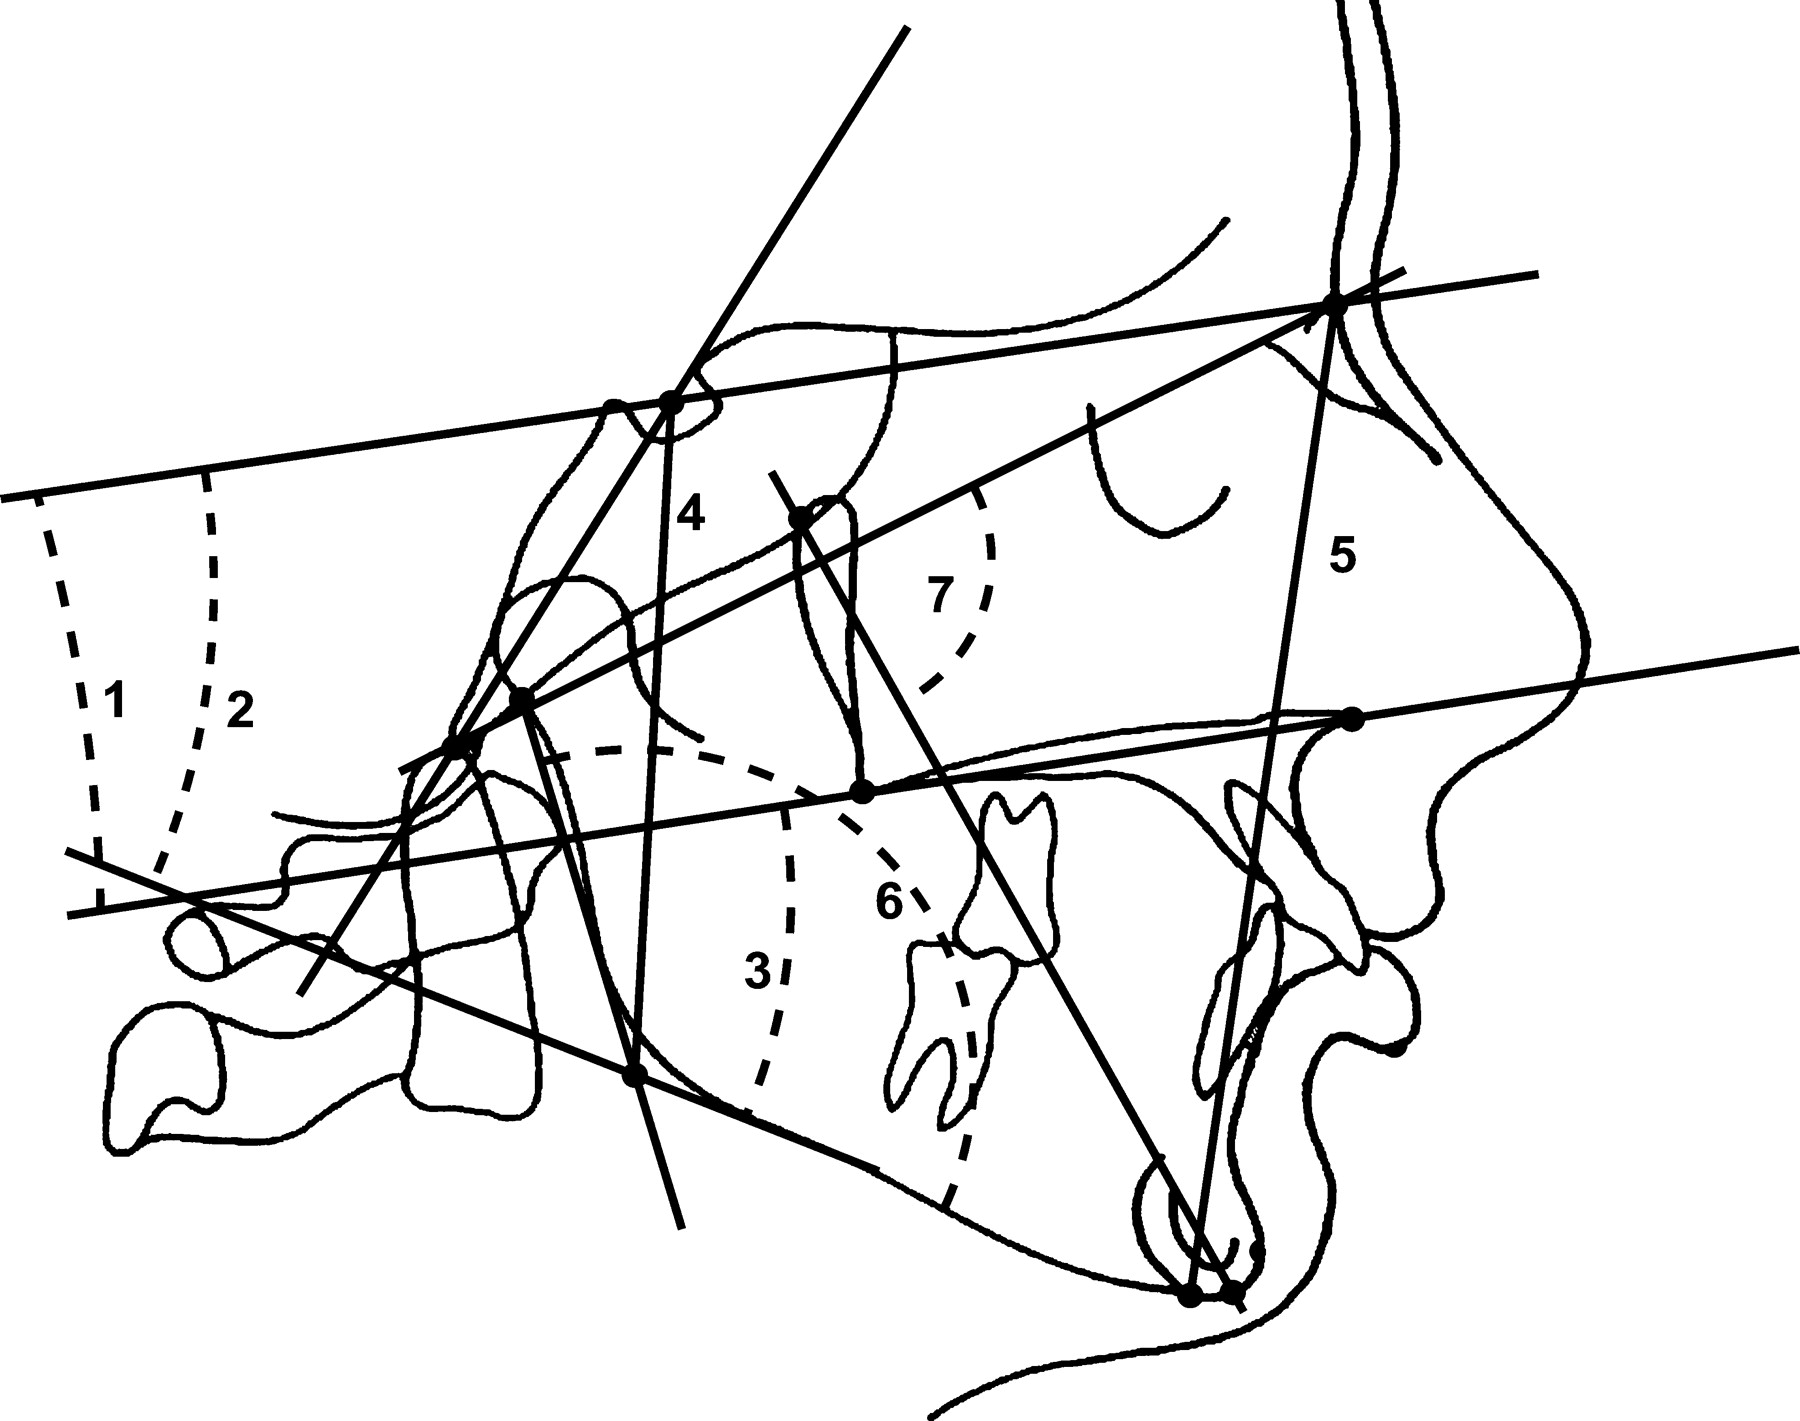
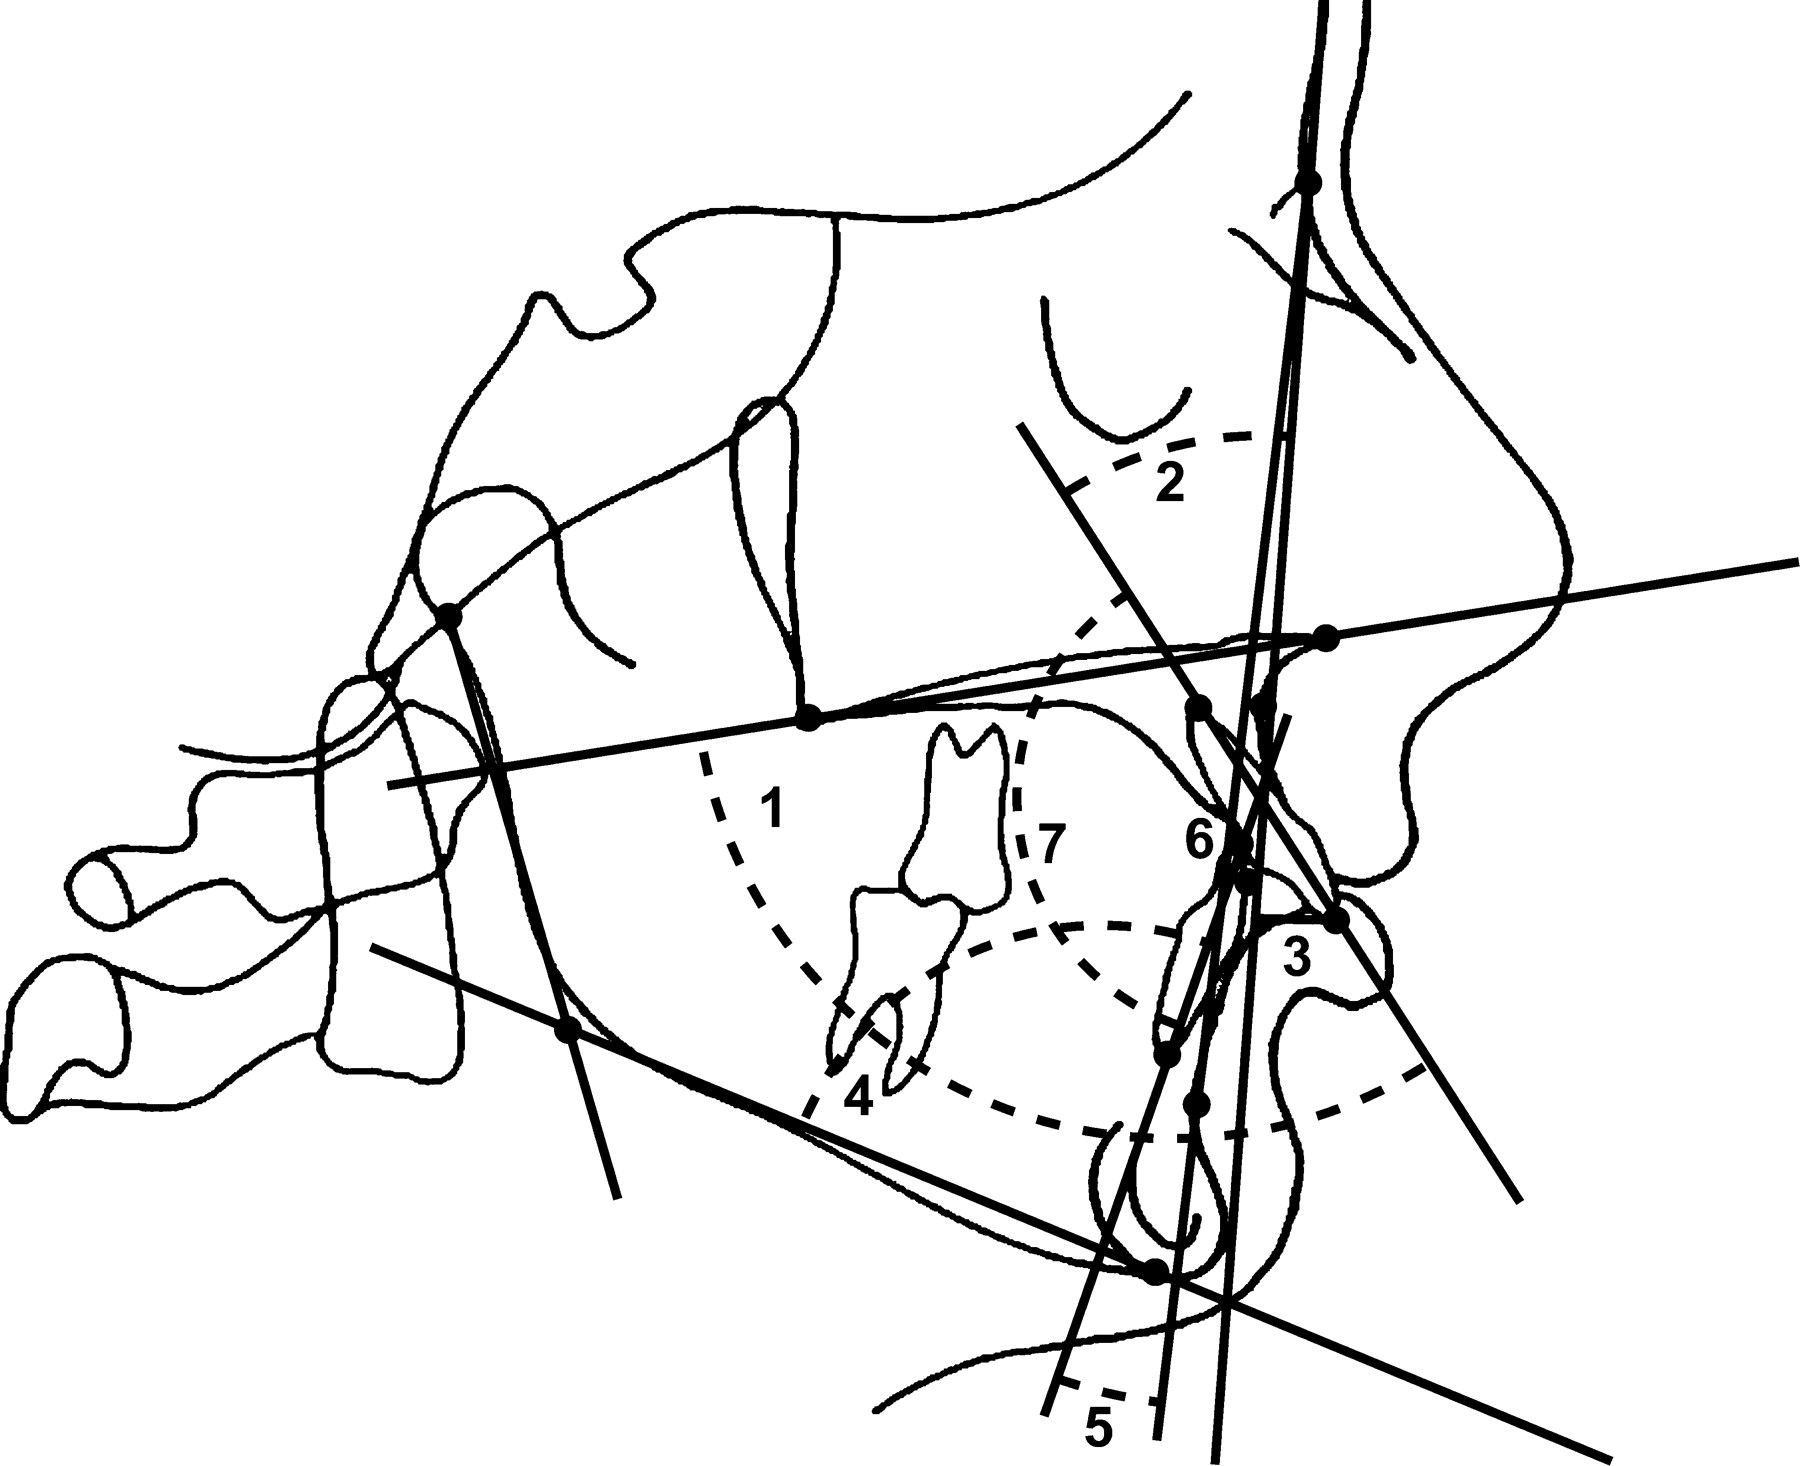
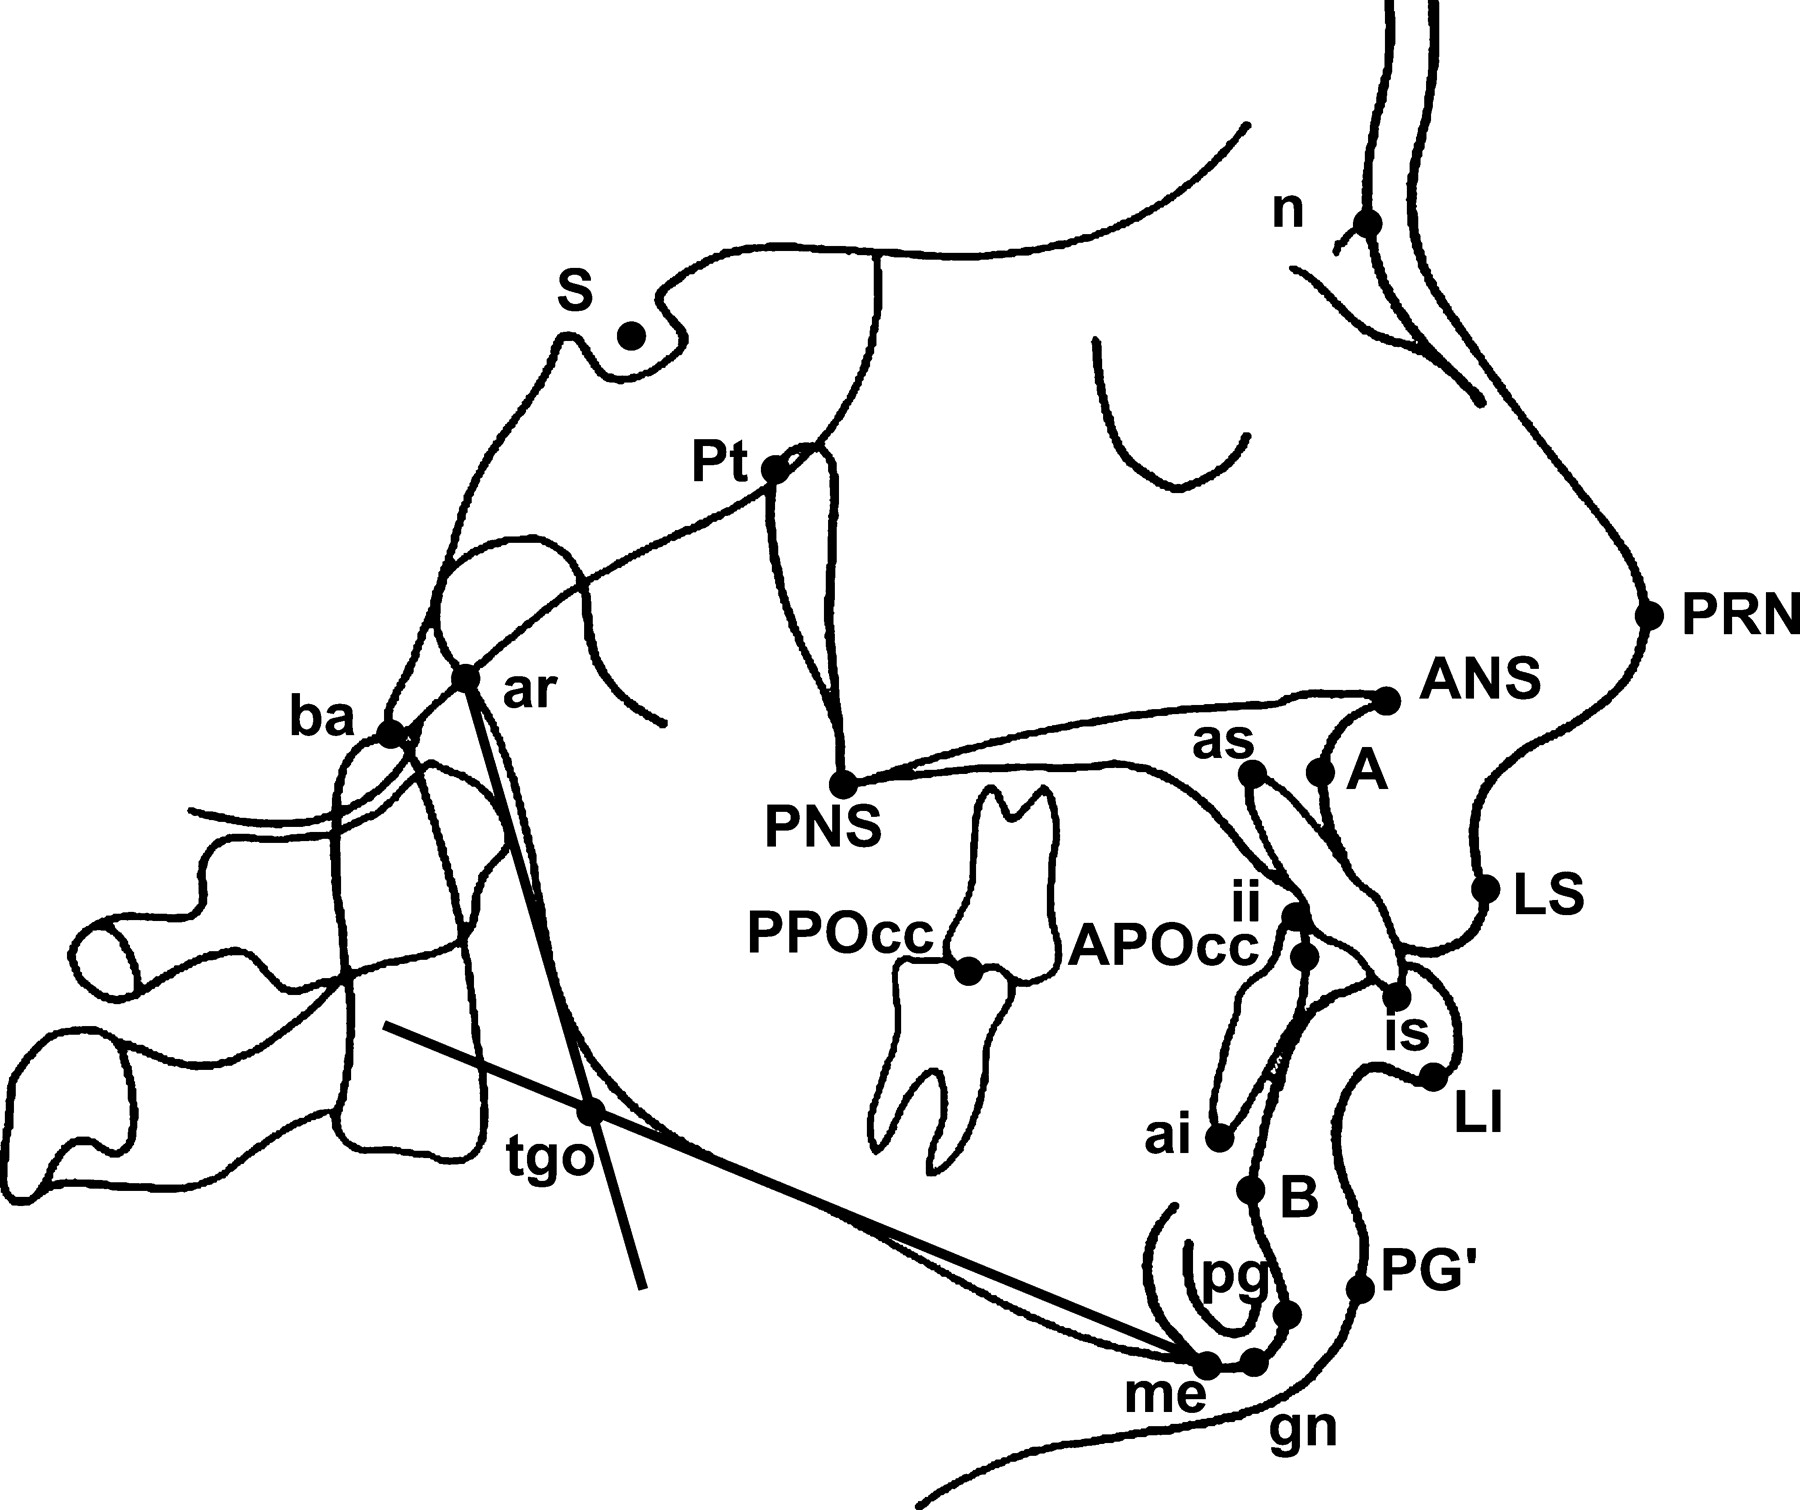
The landmarks used are shown in Figure 1 (Miyashita, 1996), and the reference lines in Figure 2.

Cephalometric landmarks. Hard tissue: nasion (n) – the point where the midsagittal plane intersects the most anterior point of the nasofrontal suture; sella turcica (S) – the centre of sella turcica; basion (ba) – the most inferior posterior point in the sagittal plane on the anteior rim of the foramen magnum; articulare (ar) – the point of intersection of the dorsal contours of processus articularis mandibulae and os temporale; pterygoid point (Pt) – most posterior point on the outline of the pterygopalatine fossa; anterior nasal spine (ANS) – the tip of the anterior nasal spine as seen on the radiograph in norma laterali; posterior nasal spine (PNS) – most posterior point on the contour of the bony palate; point A (A) – the deepest point on the contour of the alveolar projection, between the spinal point and prosthion; point B (B) – the deepest midline point on the mandible between infradentale and pogonion; incision superior (is) – mid-point on the incisal edge of the most prominent upper central incisor; incision inferior (ii) – the incisal point of the most prominent medial mandibular incisor; upper incisor apex (as) – the root apex of the most prominent upper incisor; lower incisor apex (ai) – the root apex of the most prominent lower incisor; anterior occlusal point (APOcc) – the mid-point of the incisor overbite in occlusion; posterior occlusal point (PPOcc) – the most distal point of the contact between the most posterior molar in occlusion; pogonion (pg) – the most anterior point on the symphisis of the mandible; menton (me) – the lowest point of the contour of the mandibular symphisis; gonion (tgo) – intersection between mandibular line (ML) and ramus line; gnathion (gn) – most downward and forward point on the symphisis. Soft tissue: pronasale (PRN) – the most prominent or anterior point of the nose tip; laberale superius (LS) – the most prominent point located on the vermilion border of the upper lip in the mid-sagittal plane; laberale inferius (LI) – the most prominent point located on the vermilion border of the lower lip in the mid-sagittal plane; soft tissue pogonion (PG′) – the most prominent or anterior point on the soft tissue chin in the mid-sagittal plane.
Reference lines: 1, nasion–sella line; 2, sella–basion line; 3, nasal line; 4, mandibular line; 5, tangent of mandibular ramus ascendens; 6, facial axis; 7, nasion–pogonion line; 8, occlusal line; 9, long axis of the upper incisors; 10, long axis of the lower incisors; 11, Ricketts'E line.
Measurements, which are part of the cephalometric analysis used at the Department of Orthodontics, University of Ljubljana, were carried out (Figures 3, 4 and 5).
Dental measurements. Inclination of the upper incisors: 1. ILs/NL (°), 2. ILs/NA (°); protrusion of the upper incisors: 3. is ⊥ NA (mm); inclination of the lower incisors: 4. ILi/ML (°); 5. ILi/NB (°); protrusion of the lower incisors: 6. ii ⊥ NB (mm); interincisal angle: 7. ILs/ILi (°).

Skeletal vertical measurements. Inclination of the maxilla: 1. NL/NSL (°); inclination of the mandible: 2. ML/NSL (°); interbasal relationship: 3. ML/NL (°); posterior face height: 4. PFH (mm); anterior face height: 5. AFH (mm); 6. gonial angle (°); inclination of facial axis: 7. n–ba/facial axis.
Skeletal sagittal and soft tissue measurements. Maxillary prognathism: 1. SNA (°); mandibular prognathism: 2. SNB (°); chin prognathism: 3. SNpg (°); 4. pg ⊥ NB (mm); jaw relationship: 5. ANB (°); 6. Wits appraisal (mm); inclination of cranial base: 7. NSL – ba (°); facial convexity: 8. A ⊥ N–pg (mm); 9. LS ⊥ EL (mm); 10. LI ⊥ EL (mm).
Reliability assessment
In general, the measurements were carried out twice by the same orthodontist (MD). For each measurement, six indicators of reliability were calculated:
Pearson's correlation coefficient squared;
Slope of the regression line fixed through the origin (second measurement predicted from the first);
Mean inter-subject difference between the first and the second measurement;
Standard deviation of the difference;
Standard error of the difference;
Median coefficient of within-subject variation (across subjects).
With coefficients of variation (CV), the median was used instead of the mean because there were only two data points per subject, which resulted in some extreme values of CV, especially for the measurements with small absolute values.
Gender and dentition differences
After checking that the distribution of the measurements did not depart markedly from normality, gender and dentition differences were tested with two-way analysis of variance (ANOVA). Both gender and dentition were treated as fixed factors with two levels of variation (girls versus boys; early versus late mixed dentition). To compensate for the problem of multiple tests and the correlation between measurements, the significance level was set at 0.5 per cent.
Results
The results of the reliability assessment are presented in Table 1. The reliability of measurements was satisfactory: squared correlation coefficients were mainly higher than 0.90; all regression line slopes through the origin were very close to 1; the mean within-subject differences were very small compared with the measurements, especially when considering the standard errors of these differences, which implies that confidence intervals for differences included zero in almost all cases; and median CV were zero or less than 10 per cent.
Results of reliability assessment.
Parameter | n | r2 | ba=0 | Md | SDd | SEd | MeCV% |
|---|---|---|---|---|---|---|---|
| Dental analysis | |||||||
| ILs/NL (°) | 81 | 0.912 | 0.994 | 0.444 | 1.835 | 0.204 | 0.989 |
| ILs/NA (°) | 81 | 0.926 | 1.008 | −0.160 | 1.847 | 0.205 | 2.571 |
| is ⊥ NA (mm) | 81 | 0.843 | 0.924 | 0.123 | 0.846 | 0.094 | 0.000 |
| ILi/NB (°) | 81 | 0.877 | 0.997 | −0.056 | 2.037 | 0.226 | 2.668 |
| ILi/ML (°) | 81 | 0.910 | 0.998 | 0.148 | 1.875 | 0.208 | 0.827 |
| ii ⊥ NB (mm) | 81 | 0.916 | 0.967 | 0.093 | 0.531 | 0.059 | 0.000 |
| ILs/ILi (°) | 81 | 0.939 | 0.998 | 0.130 | 2.407 | 0.267 | 0.597 |
| Vertical skeletal relationships | |||||||
| ML/NL (°) | 81 | 0.941 | 0.994 | 0.136 | 1.093 | 0.121 | 2.245 |
| ML/NSL (°) | 81 | 0.947 | 0.996 | 0.086 | 1.129 | 0.125 | 1.886 |
| NL/NSL (°) | 81 | 0.893 | 0.987 | −0.037 | 1.112 | 0.124 | 6.734 |
| PFH/AFH | 81 | 0.927 | 0.997 | 0.149 | 1.177 | 0.131 | 0.485 |
| PFH (mm) | 81 | 0.969 | 0.999 | 0.037 | 0.945 | 0.105 | 0.924 |
| AFH (mm) | 81 | 0.980 | 1.003 | −0.321 | 0.960 | 0.107 | 0.555 |
| Gonial angle (°) | 81 | 0.946 | 0.999 | 0.068 | 1.478 | 0.164 | 0.550 |
| Facial axis (°) | 81 | 0.924 | 1.000 | 0.000 | 0.959 | 0.107 | 0.401 |
| Sagittal skeletal relationships | |||||||
| SNA (°) | 81 | 0.934 | 1.001 | −0.086 | 0.918 | 0.102 | 0.458 |
| SNB (°) | 81 | 0.932 | 1.001 | −0.062 | 0.889 | 0.099 | 0.000 |
| ANB (°) | 81 | 0.858 | 1.002 | −0.030 | 0.654 | 0.073 | 5.238 |
| NS–ba (°) | 81 | 0.942 | 1.001 | −0.204 | 1.315 | 0.146 | 0.522 |
| pg ⊥ NB (mm) | 81 | 0.922 | 0.975 | 0.074 | 0.419 | 0.047 | 0.000 |
| SNpg (°) | 81 | 0.933 | 0.999 | 0.074 | 0.905 | 0.101 | 0.430 |
| Facial convexity (°) | 81 | 0.847 | 0.992 | −0.043 | 0.712 | 0.079 | 5.238 |
| Wits appraisal (mm) | 81 | 0.904 | 0.969 | −0.056 | 0.581 | 0.065 | 0.000 |
| Soft tissue measurements | |||||||
| LS ⊥ EL (mm) | 55 | 0.957 | 1.009 | 0.055 | 0.438 | 0.059 | 0.000 |
| LI ⊥ EL (mm) | 54 | 0.946 | 0.978 | −0.009 | 0.587 | 0.080 | 0.000 |
n, number of subjects measured twice; r2, squared Pearson's correlation coefficient; ba=0, slope of regression line fixed through the origin when predicting the second measurement from the first; Md, mean inter-subject difference between the first and the second measurement; SDd, standard deviation of the difference; SEd, standard error of the difference; MeCV%, median coefficient of within-subject variation across subjects.
Descriptive statistics for the cephalometric measurements are shown in Table 2, analysed by dentition. Since reliability was found to be satisfactory, the average of the two measurements was used as the datum for the subjects having undergone two measurements.
Descriptive statistics for cephalometric measurements in the early and late mixed dentition period.
Parameter | Early mixed dentition | Late mixed dentition | Total | ||||||||||||||||||
|---|---|---|---|---|---|---|---|---|---|---|---|---|---|---|---|---|---|---|---|---|---|
| M | SD | Min | Max | M | SD | Min | Max | M | SD | Min | Max | ||||||||||
| Dental analysis | |||||||||||||||||||||
| ILs/NL (°) | 111.1 | 5.8 | 93.0 | 127.5 | 109.3 | 6.2 | 97.5 | 119.5 | 110.4 | 6.0 | 93.0 | 127.5 | |||||||||
| ILs/NA (°) | 23.5 | 6.1 | 7.0 | 44.0 | 22.4 | 6.7 | 10.3 | 37.5 | 23.1 | 6.4 | 7.0 | 44.0 | |||||||||
| is ⊥ NA(mm) | 2.4 | 1.9 | −1.0 | 7.5 | 3.0 | 2.1 | −1.5 | 7.3 | 2.7 | 2.0 | −1.5 | 7.5 | |||||||||
| ILi/NB (°) | 26.8 | 5.9 | 12.0 | 40.0 | 26.6 | 5.1 | 17.5 | 37.0 | 26.7 | 5.6 | 12.0 | 40.0 | |||||||||
| ILi/ML (°) | 95.4 | 6.4 | 82.0 | 107.0 | 97.6 | 5.7 | 88.5 | 108.0 | 96.3 | 6.2 | 82.0 | 108.0 | |||||||||
| Ii ⊥ NB (mm) | 3.7 | 1.7 | 0.0 | 8.0 | 3.9 | 1.9 | −1.3 | 9.0 | 3.8 | 1.8 | −1.3 | 9.0 | |||||||||
| ILs/ILi (°) | 126.6 | 8.8 | 107.0 | 144.5 | 127.5 | 9.8 | 109.0 | 145.0 | 127.0 | 9.2 | 107.0 | 145.0 | |||||||||
| Vertical skeletal relationships | |||||||||||||||||||||
| ML/NL (°) | 27.5 | 4.7 | 17.5 | 38.5 | 25.3 | 3.6 | 16.5 | 32.3 | 26.6 | 4.4 | 16.5 | 38.5 | |||||||||
| ML/NSL (°) | 34.2 | 5.1 | 22.3 | 45.5 | 32.5 | 4.5 | 24.0 | 42.5 | 33.5 | 4.9 | 22.3 | 45.5 | |||||||||
| NL/NSL (°) | 6.5 | 3.0 | 0.5 | 14.0 | 7.2 | 3.7 | 1.5 | 17.0 | 6.8 | 3.3 | 0.5 | 17.0 | |||||||||
| PFH/AFH | 63.7 | 4.3 | 54.0 | 72.8 | 64.1 | 4.3 | 55.4 | 72.4 | 63.8 | 4.3 | 54.0 | 72.8 | |||||||||
| PFH (mm)* | 69.6 | 5.2 | 60.5 | 86.0 | 72.0 | 6.0 | 61.0 | 84.5 | 70.6 | 5.6 | 60.5 | 86.0 | |||||||||
| AFH (mm)* | 109.2 | 6.1 | 94.5 | 119.5 | 112.4 | 7.8 | 97.0 | 129.0 | 110.5 | 7.0 | 94.5 | 129.0 | |||||||||
| Gonial angle (°) | 127.6 | 6.8 | 109.0 | 140.0 | 124.9 | 5.0 | 116.0 | 135.5 | 126.6 | 6.3 | 109.0 | 140.0 | |||||||||
| Facial axis (°) | 91.4 | 3.6 | 83.5 | 99.0 | 91.7 | 3.2 | 86.0 | 97.0 | 91.5 | 3.4 | 83.5 | 99.0 | |||||||||
| Sagittal skeletal relationships | |||||||||||||||||||||
| SNA (°) | 80.0 | 3.5 | 71.0 | 87.0 | 80.5 | 3.4 | 69.8 | 87.0 | 80.7 | 3.5 | 69.8 | 87.0 | |||||||||
| SNB (°) | 77.1 | 3.3 | 69.0 | 83.0 | 76.9 | 3.5 | 65.8 | 84.0 | 77.1 | 3.4 | 65.8 | 84.0 | |||||||||
| ANB (°) | 3.7 | 1.8 | −1.0 | 8.0 | 3.6 | 1.3 | 1.0 | 6.5 | 3.7 | 1.6 | −1.0 | 8.0 | |||||||||
| NSL-ba (°) | 130.0 | 5.3 | 117.5 | 141.5 | 129.7 | 5.3 | 116.0 | 146.5 | 129.8 | 5.3 | 116.0 | 146.5 | |||||||||
| pg ⊥ NB (mm) | 1.2 | 1.4 | −2.5 | 5.0 | 2.0 | 1.3 | 0.0 | 6.0 | 1.6 | 1.4 | −2.3 | 6.0 | |||||||||
| SNpg (°) | 77.9 | 3.4 | 70.0 | 84.5 | 78.0 | 3.6 | 66.8 | 85.0 | 78.0 | 3.4 | 66.8 | 85.0 | |||||||||
| Facial convexity (°) | 3.1 | 1.7 | −1.5 | 6.8 | 2.6 | 1.6 | −3.0 | 6.0 | 2.9 | 1.7 | −3.0 | 6.8 | |||||||||
| Wits appraisal (mm) | −0.6 | 1.7 | −4.5 | 3.3 | −0.2 | 2.1 | −4.5 | 3.8 | −0.5 | 1.9 | −4.5 | 3.8 | |||||||||
| Soft tissue measurements | |||||||||||||||||||||
| LS ⊥ EL (mm) | −1.7 | 1.6 | −4.5 | 1.0 | −3.0 | 2.4 | −8.0 | 1.0 | −2.3 | 2.0 | −8.0 | 1.0 | |||||||||
| LI ⊥ EL (mm) | −0.1 | 2.1 | −5.0 | 3.5 | −1.6 | 2.6 | −7.5 | 3.0 | −0.7 | 2.4 | −7.5 | 3.5 | |||||||||
M, arithmetic mean; SD, standard deviation; min, minimum observed value; max, maximum observed value.
The values of PFH and AFH differ significantly between genders (P = 0.001). The means for PFH and AFH for the early mixed dentition period were 72.3 mm and 112.0 mm for boys, and 66.9 mm and 106.3 mm for girls, respectively. For the late mixed dentition period, the means were 74.1 mm and 115.7 mm for boys, and 70.4 mm and 110.0 mm for girls, respectively.
The results of ANOVA are summarised in Table 3 (only statistical significance is reported).
Summary of analysis of variance.
Parameter | P (Dental age) | P (Gender) | P (Interaction) | |||
|---|---|---|---|---|---|---|
| Dental analysis | ||||||
| ILs/NL (°) | 0.1378 | 0.1300 | 0.9171 | |||
| ILs/NA (°) | 0.4115 | 0.9152 | 0.8790 | |||
| is ⊥ NA (mm) | 0.1426 | 0.3832 | 0.3863 | |||
| ILi/NB (°) | 0.8062 | 0.0570 | 0.2029 | |||
| ILi/ML (°) | 0.1277 | 0.0367 | 0.7451 | |||
| Ii ⊥ NB (mm) | 0.6068 | 0.6740 | 0.7526 | |||
| ILs/ILi (°) | 0.6040 | 0.1880 | 0.6900 | |||
| Vertical skeletal relationships | ||||||
| ML/NL (°) | 0.0317 | 0.1602 | 0.6980 | |||
| ML/NSL (°) | 0.1208 | 0.6978 | 0.2243 | |||
| NL/NSL (°) | 0.3717 | 0.0101 | 0.2003 | |||
| PFH/AFH | 0.6849 | 0.3211 | 0.5393 | |||
| PFH (mm) | 0.0174 | 0.0001* | 0.4518 | |||
| AFH (mm) | 0.0080 | 0.0001* | 0.9964 | |||
| Gonial angle (°) | 0.0572 | 0.4037 | 0.8893 | |||
| Facial axis (°) | 0.6018 | 0.9226 | 0.3627 | |||
| Sagittal skeletal relationships | ||||||
| SNA (°) | 0.6787 | 0.3780 | 0.2844 | |||
| SNB (°) | 0.7658 | 0.2606 | 0.2018 | |||
| ANB (°) | 0.9091 | 0.7984 | 0.6228 | |||
| NSL–ba (°) | 0.7191 | 0.0246 | 0.1523 | |||
| pg ⊥ NB (mm) | 0.0105 | 0.3759 | 0.4458 | |||
| SNpg (°) | 0.8781 | 0.2468 | 0.2071 | |||
| Facial convexity (°) | 0.2195 | 0.5633 | 0.8331 | |||
| Wits appraisal (mm) | 0.2493 | 0.9585 | 0.5296 | |||
| Soft tissue measurements | ||||||
| LS ⊥ EL (mm) | 0.0507 | 0.0400 | 0.1713 | |||
| LI ⊥ EL (mm) | 0.0426 | 0.3038 | 0.1490 | |||
P < 0.05.
Discussion
The sample was selected on the basis of the score of the modified Eismann method for the objective assessment of malocclusion in the mixed dentition. The morphological signs of malocclusion were measured and numerically evaluated. Only children whose score did not exceed 15 points were included in the study. This means that the sample consisted of subjects with a mild malocclusion and there was no influence of the skeletal malocclusion in the values of the general population.
Bishara (1981) found larger linear dimensions in boys. In the present investigation, statistically significant differences between boys and girls were observed in anterior (AFH) and posterior (PFH) face heights. For other measurements, there were no statistically significant differences. The observation time interval was between 6 and 13 years of age. Ursi et al. (1993) found that linear dimensions were similar in both genders up to 14 years of age and thereafter they remained relatively constant in girls while increasing in boys. The direction of facial growth was similar in both genders. El-Batouti et al. (1994) observed the most pronounced differences between genders after 12 years of age, which is in accordance with the present results: in younger children there were no significant gender differences. Yeong and Huggare (2004) reported statistically significant differences between Singaporean boys and girls in maxillary and mandibular prognathism, linear dimensions of anterior and posterior cranial base, face height measurements, upper and lower incisor inclination and lip prominence. Children participating in their investigation were older than those in the present study (mean age for girls 12.5 ± 0.7 years, mean age for boys 12.7 ± 0.7 years).
The cephalometric parameter values changed with development, but no significant differences between subjects in the early and late mixed dentition were found. Some changes in vertical relationships were observed: a decrease in mandibular inclination (ML/NSL), interbasal angle (NL/ML) and gonial angle, and an increase in AFH and PFH. These observations confirm the findings of Björk (1963), Bishara (1981); Bishara et al. (1984) and El-Batouti et al. (1994).
El-Batouti et al. (1994) found the most pronounced changes in prognathism of the maxilla and mandible (SNA and SNB angles) from 6 to 18 years of age. In the present investigation, the sagittal skeletal relationships remained constant from the early to the late mixed dentition. The studied age period was too limited to observe significant differences. The most pronounced change was an increase in NB ⊥ pg distance and a decrease in facial convexity.
There were no significant changes in the position of the upper and lower central incisors from the early to the late mixed dentition period. All parameters remained constant in the observation time interval. The marked age-related changes in the position of the central incisors in the Norwegian population were found from 6 to 9 years of age; afterwards the position of the incisors remain unchanged (El-Batouti et al., 1994). The values for the inclination of the upper and lower incisors in Droschl's (1984) study did not change in the period between 8 and 11 years of age, which is in accordance with the present findings.
Changes in soft tissue cephalometric measurements were also found. The distance from Ricketts' E line to the upper and lower lip increased with age. This supports the findings of Ricketts et al. (1972).
The majority of researchers have developed cephalometric standard values according to chronological age. A comparison between the present findings and their results is not exactly appropriate, since the inclusion criteria for determining the developmental stage in this study were dental instead of chronological. The mean age of the present sample was 9.31 ± 1.52 years. An approximate comparison between selected samples could be performed. The results of this study and the values of Austrian (aged from 9 years to 9 years and 11 months), American (aged 10 years) and Norwegian (aged 9 years) children are shown in Table 4 (Bishara et al., 1984; Droschl, 1984; El-Batouti et al., 1994). The parameters that were measured in at least two studies are presented.
Values of cephalometric parameters of Slovenian, Austrian, Norwegian and American subjects.
Parameter | Present study | Droschl, 1984* | El-Batouti et al., 1994** | Bishara et al., 1984*** | ||||||||
|---|---|---|---|---|---|---|---|---|---|---|---|---|
| Boys | Girls | Boys | Girls | Boys | Girls | Boys | Girls | |||||
| M | M | M | M | M | M | M | M | |||||
| SNA (°) | 81.1 | 80.3 | 80.7 | 80.9 | 82.3 | 80.8 | 80.6 | 80.0 | ||||
| SNB(°) | 77.6 | 76.6 | 77.2 | 78.1 | 78.9 | 78.0 | 77.0 | 76.1 | ||||
| ANB (°) | 3.6 | 3.7 | 3.5 | 2.7 | 3.4 | 2.8 | 3.6 | 3.9 | ||||
| SNpg (°) | 78.8 | 77.5 | 77.9 | 78.8 | 77.2 | 75.9 | ||||||
| NSL–ba (°) | 128.4 | 131.2 | 129.8 | 130.7 | ||||||||
| ML/NSL (°) | 33.2 | 33.8 | 34.7 | 33.5 | 33.4 | 35.0 | 33.1 | 35.1 | ||||
| NL/NSL (°) | 5.7 | 7.7 | 6.8 | 7.2 | 6.1 | 7.7 | ||||||
| NL/ML (°) | 27.4 | 26.0 | 27.9 | 26.2 | ||||||||
| Gonial angle (°) | 127.3 | 125.9 | 131.2 | 129.8 | ||||||||
| PFH (mm) | 72.9 | 68.4 | 68.9 | 68.3 | ||||||||
| AFH (mm) | 113.0 | 107.9 | 109.1 | 106.6 | 104.6 | 100.2 | ||||||
| PFH/AFH (%) | 64.4 | 63.4 | 63.2 | 64.1 | ||||||||
| ILs/ILi (°) | 128.4 | 125.7 | 129.9 | 131.6 | 125.8 | 129.3 | ||||||
| ILi/ML (°) | 94.7 | 97.8 | 92.1 | 92.4 | 94.6 | 92.7 | ||||||
| ILs/NL (°) | 109.4 | 111.2 | 109.9 | 109.9 | ||||||||
M, arithmetic mean.
The sample consisted of children aged from 9 years to 9 years and 11 months (Droschl, 1984);
cephalometric standards for boys and girls at 9 years of age (El-Batouti et al., 1994);
values of cephalometric parameters of children aged 10 years (Bishara et al., 1984).
The geographically closest sample to the Slovenian population is the Austrian sample (Droschl, 1984). There are differences in SNB and ANB values between Slovenian, Austrian and Norwegian girls. The mandible of Austrian and Norwegian girls is more protrusive which results in smaller ANB values. The largest difference in vertical skeletal relationships between Slovenian and Austrian children is in the values for gonial angle, with Austrian children showing larger angles. The Slovenian and Austrian samples have larger anterior face heights compared with Americans. Slovenian girls also have more proclination of the lower incisors than the Austrian and Norwegian populations studied.
The most pronounced changes between the present and the subjects in the study of Droschl (1984) were observed in the values of soft tissue measurements. The upper and lower lip were behind the E line in the present study, but in the Austrian sample only girls had the lower lip behind the E line. The position of the lower lip in boys and the upper lip in both genders was in front of Ricketts' E line.
Conclusion
The obtained data can be used as the cephalometric standards for Slovenians in the period of the mixed dentition. There are no significant differences between the early and mixed dentition. In this period of development, there are also very small gender differences. The measurement mean values for the total sample can be used as cephalometric standards.
References
Argyropolous E, Sassouni V
Ben-Bassat Y, Dinte A, Brin I, Koyoumdjisky-Kaye E
Bishara S E
Bishara S E, Fernandez A G
Bishara S E, Abdalla E M, Hoppens B J
Bishara S E, Peterson L C, Bishara E C
Björk A
Broadbent Sr B H, Broadbent Jr B H, Golden W Y
Burstone C J, James R B, Hilgers J J, Schulhof R
Coben S E
Cooke M S, Wei S H
Downs W B
Droschl H
Eismann D
El-Batouti A, Ögaard B, Bishara S E
Farčnik F, Korpar M, Premik M, Zorec R
Franchi L, Baccetti T, McNamara Jr J A
Haavikko K, Rakhamo A
Hamdan A M, Rock W P
Holdaway R A
Huang W J, Taylor R W, Dasanayake A P
McNamara Jr J A
Miyashita K
Muretic Z
Proffit W R, Ackermann J L
Ricketts R M
Ricketts R M, Bench R W, Hilgers J J, Schulhof R
Riolo M L, Moyers R E, McNamara J A, Hunter W S
Segner D
Taylor W H, Hitchock H P
Tollaro I, Bacceti T, Franchi L
Trenouth M J, Davies P H J, Johnson J S
Trenouth M J, Laitung G, Naftel A J
Ursi W J, Trotman C A, McNamara Jr J A, Behrents R G
Author notes
*Department of Orthodontics and **Insitute of Biomedical Informatics, Faculty of Medicine, University of Ljubljana, Slovenia

