


Abstract
Aberrant proinflammatory and suppressed anti-inflammatory (alternative; M2) macrophage activation underlies the chronic inflammation associated with obesity and other metabolic disorders. This study demonstrates a critical role for interferon regulatory factor 6 (IRF6) in regulating macrophage M2 activation by suppressing peroxisome proliferator–activated receptor-γ (PPARγ) expression, a critical regulator of alternative macrophage polarization. The data demonstrate suppression of IRF6 in both M2 macrophages and obese adipose tissue macrophages. Using gain- and loss-of-function strategies, we confirmed that IRF6 knockdown enhanced M2 activation, whereas IRF6 overexpression dramatically attenuated M2 activation. Computational target prediction analysis coupled with chromatin immunoprecipitation indicated that IRF6 suppresses PPARγ through binding IRF recognition sites located upstream of the PPARγ coding region. Taken together, our results suggest that an IRF6/PPARγ regulatory axis suppresses anti-inflammatory responses in bone marrow–derived macrophages and provides references for future study addressing dysregulated metabolic and immunologic homeostasis of obese adipose tissue.
Macrophages respond to various microenvironmental signals, resulting in a range of activation profiles (1, 2). Stimulation of macrophages with T helper type 1 cytokines, lipopolysaccharide (LPS), or free fatty acids results in proinflammatory macrophage (classical; M1) activation, whereas T helper 2 cytokines including interleukin (IL)-4 and IL-13 induce anti-inflammatory (alternative; M2) activation (3, 4). The polarization of tissue-resident macrophages dictates the physiologic or inflammatory state of the tissues they reside in (5, 6). Adipose tissue macrophages (ATMs) are extremely important for metabolic homeostasis (7). ATM abundance dramatically increases in obese adipose tissue, and obese ATMs tend to adapt different polarization types than ATMs from lean subjects, which may be a contributing factor of obese-associated chronic inflammation and insulin resistance (7–11). Despite their pleiotropic roles, the molecular determinants of macrophage polarization have not been fully elucidated, and this major gap in knowledge is impeding a complete understanding of metabolic disorders (12, 13).
Interferon regulatory factors (IRFs) are a family of nine transcription factors that primarily regulate immune cell maturation (12–16). All IRFs share a homologous N-terminal DNA-binding domain recognizing a consensus DNA sequence, known as the interferon-stimulated response element (ISRE) (17, 18). Additionally, IRFs transduce signals from pattern recognition receptors and promote expression of various genes, including proinflammatory or anti-inflammatory cytokines (18). Although several IRFs are required for leukocyte activation and thus important for innate and adaptive immune responses, IRF6, which shares a large degree of structural homology with the proinflammatory IRF5, has not been demonstrated to play a role in immune cells (17, 19–24).
To date, knowledge of IRF6 is largely restricted to its role in promoting epithelial cell proliferation and differentiation (25). IRF6 mutations prevent normal epithelial maturation resulting in the soft tissue fusions characteristic of Van der Woude and popliteal pterygium syndromes in humans (26–28). Aside from its function as a morphogenic IRF, epithelial IRF6 also mediates inflammatory toll-like receptor (TLR) signaling through the MyD88 signaling pathway (29). To our knowledge, it is not known whether a similar role for an IRF6 signaling axis exists in immune cells.
In this study, we demonstrate that IRF6 is crucial for macrophage M2 activation, yet largely dispensable for proinflammatory M1 activation. Furthermore, we demonstrate that IRF6 regulates macrophage polarization by inhibiting the expression of peroxisome proliferator–activated receptor-γ (PPARγ) through binding two ISREs located upstream of the PPARγ genomic region. Our investigation also indicates that IRF6 is dramatically suppressed in ATMs, suggesting that a dysregulated IRF6/PPARγ regulatory axis suppresses anti-inflammatory ATM responses and ultimately contributes to dysregulated metabolic and immunologic homeostasis. We propose that IRF6 is a potential therapeutic target for controlling metabolic disorders.
Experimental Procedures
Animal experiments
Wild-type (WT) C57BL/6J mice were used as controls. All mice were maintained on a 12/12-hour light/dark cycle. Male mice 5 to 6 weeks of age were fed ad libitum. Mice were fed a high-fat diet (HFD; 60% fat calories, 20% protein calories, and 20% carbohydrate calories; catalog no. D12492, Research Diets, Inc.) for 16 weeks. A separate group of mice were fed a low-fat diet (10% fat calories, 20% protein calories, and 70% carbohydrate calories; catalog no. D12450J; Research Diets, Inc.) as controls. After the feeding regimen, mice were subjected to phenotype characterization and metabolic assays, including measurement of metabolic parameters in plasma, as well as insulin and glucose tolerance tests. All study protocols used were reviewed and approved by the Institutional Animal Care and Use Committee of Texas A&M University and University of Connecticut Health Center.
Isolation of stromal cells from visceral adipose tissues
The visceral adipose tissues were mechanically dissected and then digested with 2 mg/mL collagenase II (Invitrogen) for 30 minutes at 37°C. After removing red blood cells, cells were filtered through a 200-μm cell strainer. Visceral fat stromal cells (VSCs) and mature adipocytes were separated by centrifugation at 1000g for 5 minutes. To purify ATMs, VSCs were incubated with biotin-labeled antibody against F4/80 (catalog no. 13-4801-85; eBioscience) for identification of macrophages. Magnetic beads conjugated with streptavidin (catalog no. 557812; BD Biosciences) were applied for isolation of macrophages. The efficiency of magnetic bead–based isolation of ATMs was examined with flow cytometry (Supplemental Fig. 1).
Macrophage differentiation and polarization
Bone marrow–derived macrophages (BMDMs) were prepared as previously described (30). Macrophage maturation was examined by flow cytometry with antibodies against F4/80 (catalog no. 53-4801-82; Thermo Fisher Scientific) and CD11b (catalog no. 17-0112-83; Thermo Fisher Scientific). BMDMs were stimulated with LPS (100 ng/mL) for M1 activation or IL-4 (20 ng/mL) for M2 activation. After 48 hours of stimulation, BMDMs were examined by flow cytometry with antibodies against CD69 (catalog no. 45-0691-82; Thermo Fisher Scientific), CD80 (catalog no. 12-0801-85; Thermo Fisher Scientific), and CD86 (catalog no. 17-0862-82; Thermo Fisher Scientific).
Flow cytometry analysis
Unless otherwise specified, antibodies were from Thermo Fisher Scientific or BioLegend. VSCs, ATMs, and BMDMs were stained with fluorescence-tagged antibodies to detect cell lineages. Myeloid cells were detected using antibodies against F4/80 (catalog no. 53-4801-82; Thermo Fisher Scientific), CD11b (catalog no. 17-0112-83; Thermo Fisher Scientific), and Gr-1 (catalog no. 45-5931-80; Thermo Fisher Scientific); macrophage subtypes were detected with antibodies against F4/80, CD11b, CD206 (catalog no. 141706; BioLegend), CD11c (catalog no. 12-0114-83; Thermo Fisher Scientific), PPARγ (catalog no. PIPA525757; Thermo Fisher Scientific), and CD36 (catalog no. 102605; BioLegend). Macrophage activation was examined with antibodies against CD80 (catalog no. 12-0801-85; Thermo Fisher Scientific), CD69 (catalog no. 45-0691-82; Thermo Fisher Scientific), and CD86 (catalog no. 17-0862-82; Thermo Fisher Scientific). Data were analyzed using FlowJo software (BD Biosciences), Accuri C6 software (BD Biosciences), or Kaluza software (Beckman Coulter). Annotation of chosen markers was provided in Table 1.
Purpose of Markers Used in Flow Cytometry Analysis
| Target | Purpose/Reason to Choose |
|---|---|
| CD206 | M2 polarization marker (11) |
| CD11c | M1 polarization marker (11) |
| CD69 | Macrophage activation marker (31) |
| CD86 | Macrophage activation marker (32) |
| PPARγ | M2-associated genes, promotes M2 activation (33) |
| CD36 | Target of PPARγ; induced by PPARγ (34) |
Quantitative reverse transcription polymerase chain reaction analysis
Total RNA was extracted from ATMs and BMDMs using the TRIzol extraction protocol according to the manufacturer’s instructions (Zymo Research). Gene expression analysis was performed using an iScript One-Step RT-PCR kit with SYBR Green (Bio-Rad) on a CFX384 (Bio-Rad). The data presented correspond to the mean of 2−ΔΔCt from at least three independent experiments after being normalized to β-actin.
Chromatin immunoprecipitation assay
Chromatin immunoprecipitation (ChIP) assays were performed as described previously (35). Briefly, BMDMs were cross-linked for 10 minutes with 1% formaldehyde and quenched with 125 mM glycine. After nuclei were isolated by centrifugation, the pellet was resuspended in lysis buffer containing 0.1% sodium dodecyl sulfate and sonicated to achieve fragment sizes of 200–600 bp. The immunoprecipitation was conducted with ChIP-grade protein G magnetic beads using an antibody against IRF6 (catalog no. NBP1-51911; Novus Biologicals). Immunoglobulin G (IgG) protein (catalog no. ab18413; Abcam) was used as the negative control (Table 2). To validate the enrichment, quantitative polymerase chain reaction (PCR) was performed with tiled primers.
Antibodies Used for ChIP Assays and Flow Cytometry Analysis
| Peptide/Protein Target | Name of Antibody | Manufacturer, Catalog No. | Species Raised in; Monoclonal or Polyclonal | Dilution Used | RRID |
|---|---|---|---|---|---|
| IRF6 | IRF6 Antibody | Novus Biologicals, NBP1-51911 | Goat; polyclonal | 2 μg/100 μg sample | AB_11003608 |
| Unknown (isotype control) | Mouse IgG2a [MOPC-173] Isotype Control | Abcam, ab18413 | Mouse; monoclonal | 2 μg/100 μg sample | AB_2631983 |
| F4/80 | Anti-Mouse F4/80 Alexa Fluor 488 | Thermo Fisher Scientific, 53-4801-82 | Rat; monoclonal | 1:200 | AB_469915 |
| CD11b | Anti-Mouse CD11b APC | Thermo Fisher Scientific, 17-0112-82 | Rat; monoclonal | 1:200 | AB_469343 |
| Gr-1 | Anti-Mouse Ly-6G (Gr-1) PerCP-Cy5.5 | Thermo Fisher Scientific, 45-5931-80 | Rat; monoclonal | 1:200 | AB_906247 |
| CD206 | Antimouse CD206 (MMR) PE | BioLegend, 141706 | Rat; monoclonal | 1:200 | AB_10895754 |
| CD11c | Anti-Mouse CD11c PE | Thermo Fisher Scientific, 12-0114-83 | Armenian hamster; monoclonal | 1:200 | AB_465553 |
| PPARγ | PPARG Antibody | Thermo Fisher Scientific, PA5-25757 | Rabbit; polyclonal | 1:200 | AB_2543257 |
| CD36 | Antimouse CD36 PE | BioLegend, 102605 | Armenian hamster; monoclonal | 1:200 | AB_389348 |
| CD80 | Anti-Mouse CD80 (B7-1) PE | Thermo Fisher Scientific, 12-0801-82 | Armenian hamster; monoclonal | 1:200 | AB_465752 |
| CD69 | Anti-Mouse CD69 PerCP-Cy5.5 | Thermo Fisher Scientific, 45-0691-82 | Armenian hamster; monoclonal | 1:200 | AB_1210703 |
| CD86 | Anti-Mouse CD86 (B7-2) APC | Thermo Fisher Scientific, 17-0862-82 | Rat; monoclonal | 1:200 | AB_469419 |
Abbreviation: RRID, research resource identifier.
Luciferase reporter assay
The luciferase reporter assay was carried out as described previously (18). To verify that IRF6 binds to the upstream region of PPARγ, a 478-bp DNA fragment (−1857 to −1379 relative to the 5′ end) within the upstream region of PPARγ was inserted upstream of the SV40 promoter of the pGL3 promoter vector (Promega). Constructs with mutated binding sites were generated using the QuikChange Site-Directed Mutagenesis Kit (catalog no. 200518-5; Stratagene) followed by sequencing validation (Table 3). The luciferase activity was determined by transient transfection HEK-293 cells (CRL-1573; American Type Culture Collection) with Bright-Glo luciferase reporter system (Promega) and normalized to the control firefly luciferase activity.
Position and Sequence of WT and Mutated ISREs Upstream of PPARγ Coding Region
| IRF6 Enhancer | Position | ISRE Sequence |
|---|---|---|
| WT-ISRE-1 | −1782 | AAACAAAAGTAGATTGAAACTCCTGGGTGAGCAAG |
| WT-ISRE-2 | −1444 | CCAGGGCTACACAGAGAAACTGTGTCTCAAAAAAC |
| Mut1 | −1782 | AAACAAAAGTAGATTAAGAATCCTGGGTGAGCAAG |
| Mut2 | −1444 | CCAGGGCTACACAGATATATTGTGTCTCAAAAAAC |
| IRF6 Enhancer | Position | ISRE Sequence |
|---|---|---|
| WT-ISRE-1 | −1782 | AAACAAAAGTAGATTGAAACTCCTGGGTGAGCAAG |
| WT-ISRE-2 | −1444 | CCAGGGCTACACAGAGAAACTGTGTCTCAAAAAAC |
| Mut1 | −1782 | AAACAAAAGTAGATTAAGAATCCTGGGTGAGCAAG |
| Mut2 | −1444 | CCAGGGCTACACAGATATATTGTGTCTCAAAAAAC |
Lentiviral short hairpin RNA assay
The pLKO.1-CMV-TurboGFPTM vector (Sigma-Aldrich) with inserted short hairpin RNA (shRNA; targeting IRF6) was cotransfected with compatible packaging plasmids into HEK-293 cells. The lentiviral supernatants were collected after 72 hours transfection and used to infect BMDMs. The empty vector was used as the control.
Ectopic expression assays
To overexpress IRF6, the open reading frame sequence was inserted downstream of the cytomegalovirus promoter in the XZ201 plasmid. These constructs were delivered into target cells by transient transfection with X-tremeGENE HP DNA transfection reagent (Roche Applied Science). The empty vectors were used as the control. The overexpression was validated by reverse transcription PCR (RT-PCR).
Statistics
Results are expressed as means ± standard error of the mean (SEM). Each data point derived from RT-PCR assays represents an average of two technical replicates, and data were averaged over independently replicated experiments (n = 5 to 6 independently collected samples) and analyzed using the Student t test. The overall effect was analyzed for significance using one-way or two-way analysis of variance and the Bonferroni posttest for each factor at each individual time when appropriate. Data analyses were performed using Prism version 6.0 software (GraphPad). A value of P < 0.05 was considered statistically significant.
Results
Obese ATMs present decreased M2 ATM population
ATMs were isolated from C57BL/6J mice fed an HFD from 5 weeks of age for 16 weeks [Fig. 1(a)].
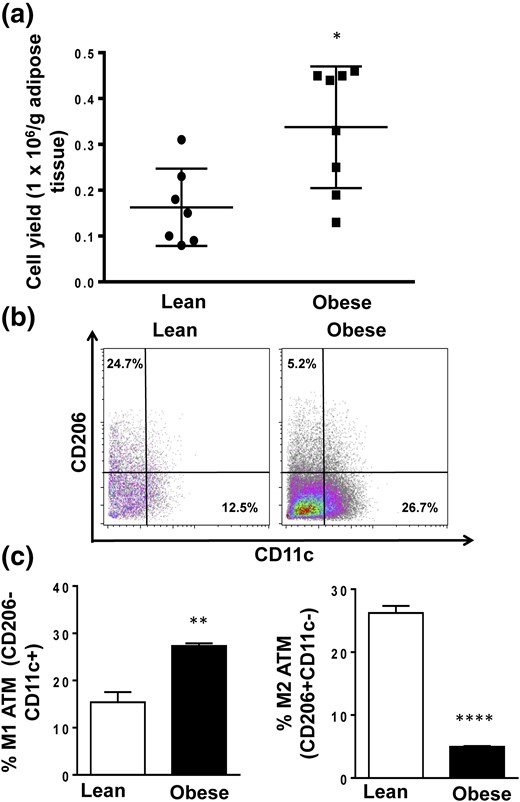
M1 and M2 macrophage cell proportions from lean and obese mice. (a) The ATM yield from lean and obese mice is presented as numbers of cells per gram of adipose tissue. (b and c) Proportions of M1 and M2 populations in ATMs from lean and obese mice were measured with flow cytometry. Data are presented as mean ± SEM (n = 6). Asterisks indicate significant differences from lean mice: *P < 0.05; **P < 0.01; ****P < 0.0001.
ATMs derived from obese mice exhibited significantly higher proportion of M1 (F4/80+CD11b+CD206−CD11c+) cells compared with lean mice (8, 11, 36, 37). In contrast, there was a dramatic reduction in M2 frequency (F4/80+CD11b+CD206+CD11c−) after induction of obesity [Fig. 1(b) and 1(c)].
IRF6 is significantly reduced in obese ATMs and M2-polarized macrophages
To determine if IRF6 played a role in mediating the altered profile of macrophage activation in obese mice, we examined its expression in response to M1 and M2 macrophage polarization. Compared with M1 BMDMs, M2 BMDMs presented significantly higher CD206 surface expression (Supplemental Fig. 2). Interestingly, IRF6 levels significantly decreased upon M2 polarization while remaining unchanged upon LPS-induced M1 polarization [Fig. 2(a)]. Further analysis revealed the dramatically decreased IRF6 expression in M2 macrophages beginning as early as 5 hours poststimulation, which persisted for at least 72 hours [Fig. 2(b)]. Thus, IRF6 expression is suppressed in M2 macrophages, whereas IRF6 levels in M1 macrophages were unaffected. We also profiled the expression of IRF6 in ATMs isolated from lean and obese mice. Unexpectedly, it was found that IRF6 was dramatically reduced in ATMs from obese mice compared with ATMs from lean mice [Fig. 2(c)].
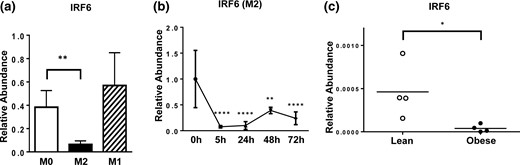
IRF6 expression profiles in ATMs and during macrophage polarization. (a) IRF6 expression following 48 hours of M0, M1, and M2 polarization (n = 4), (b) IRF6 expression from 5 to 72 hours post–M2 activation (n = 5), and (c) expression of IRF6 in naive lean and obese ATMs are shown. Data are presented as mean ± SEM (n = 4). Asterisks indicate significant differences from M0 macrophages (a) or from 0 hours (b), or from lean mice (c): *P < 0.05; **P < 0.01; ****P < 0.0001.
IRF6 negatively regulates M2 macrophage polarization
We tested if the differential expression of IRF6 observed in M2 macrophages was necessary for polarization by using gain- and loss-of-function strategies. First, BMDMs were transduced with an IRF6 overexpression construct (IRF6oe BMDMs) and subsequently stimulated with IL-4 [Fig. 3(a)]. Flow cytometric analysis revealed overexpression of IRF6 blunted M2 activation, with a considerable reduction of activation-related surface markers, CD69 and CD86, in IRF6oe BMDMs after 48 hours of stimulation [Fig. 3(b)]. Subsequent gene expression analysis also confirmed reduced levels of M2 signature genes, including PPARγ, Arg1, and IL-10, in IRF6oe BMDMs [Fig. 4(a)]. However, PGC1α and PGC1β expression remained unchanged, suggesting that the reduced levels of M2 markers were not due to a cytotoxicity-induced global reduction in gene expression.
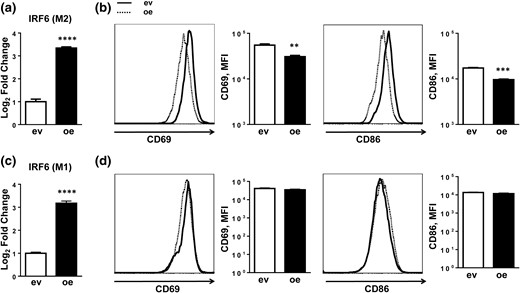
IRF6 overexpression suppresses M2 activation. (a) IRF6 expression levels plotted as log2 fold change and (b) expression of activation-related cell surface markers CD69 and CD86 in BMDMs transfected with an IRF6 overexpression construct (oe) and subsequently activated with IL-4 stimulation. (c) IRF6 expression levels plotted as log2 fold change and (d) expression of activation-related cell surface markers CD69 and CD86 in BMDMs transfected with an IRF6 overexpression construct and subsequently activated with LPS stimulation. Data are presented as mean ± SEM (n = 3). Asterisks indicate significant differences from BMDMs transfected with empty vector: **P < 0.01; ***P < 0.001; ****P < 0.0001. ev, BMDMs transfected with empty vector; MFI, mean fluorescence intensity.
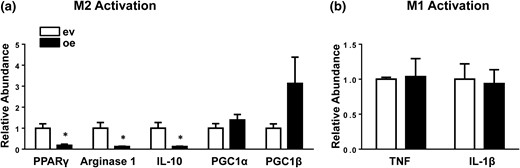
IRF6 overexpression inhibits M2 polarization. (a) M2 signature gene expression in BMDMs transfected with an IRF6 overexpression construct (oe) and subsequently activated with IL-4 stimulation and (b) expression of proinflammatory M1 genes in BMDMs transfected with an IRF6 overexpression construct and subsequently stimulated with LPS were measured by RT-PCR. Data are presented as mean ± SEM (n = 3). Asterisks indicate significant differences from BMDMs transfected with empty vector: *P < 0.05. ev, BMDMs transfected with empty vector.
Although IRF6 expression remained unchanged in M1-polarized BMDMs, we reasoned that IRF6 might modulate M1 activation given its shared homology with IRF5 (23, 24). However, BMDMs with ectopic IRF6 expression that were stimulated with LPS did not exhibit differences in activation, as shown by unchanged CD69 and CD86 surface marker expression [Fig. 3(c) and 3(d)]. Additionally, IRF6oe BMDMs stimulated with LPS showed no differences in expression of proinflammatory cytokines tumor necrosis factor and IL-1β [Fig. 4(b)].
Loss-of-function experiments were conducted using BMDMs transduced with an IRF6 shRNA construct (shIRF6 BMDMs) [Fig. 5(a) and 5(c)]. Consistent with the overexpression findings, knockdown of IRF6 enhanced M2 activation, as shown by increased surface expression of CD69, CD86, and CD206 (Fig. 5b). Accordingly, BMDM-shIRF6 also displayed significantly higher messenger RNA levels of PPARγ, Arg1, IL-10, PGC1α, PGC1β, CD36 [Fig. 6(a)], Mgl1 [Fig. 6(b)], and Ym1 [Fig. 6(c)] and higher protein levels of PPARγ and CD36 [Fig. 5(b)], which suggest an M2 phenotype (38). Expression of IRF1 and -8 was reduced, whereas the other IRFs were either not affected (IRF3 and IRF4) or minimally affected (IRF5) by IRF6 knockdown (Supplemental Fig. 3) in M2 BMDMs.
IRF6 suppression enhances M2 activation. (a) shRNA knockdown of IRF6 in M2 polarized BMDMs and (b) expression of activation-related cell surface markers CD69 and CD86 and M2-associated proteins CD206, PPARγ, and CD36, as measured by flow cytometry. (c) shRNA knockdown of IRF6 in M1-polarized BMDMs and (d) expression of activation-related cell surface markers CD69 and CD86. Data are presented as mean ± SEM (n = 6). Asterisks indicate significant differences from BMDMs transfected with empty vector: *P < 0.05; **P < 0.01; ****P < 0.0001. ev, BMDMs transfected with empty vector; MFI, mean fluorescence intensity; shIRF6, BMDMs transduced with IRF6-specific shRNA.
IRF6 knockdown enhances M2 polarization. (a–c) M2 signature gene expression following M2 polarization and IRF6 knockdown and (d) inflammatory gene expression following M1 polarization and IRF6 knockdown were measured by RT-PCR. Data are presented as mean ± SEM (n = 6). Asterisks indicate significant differences from BMDMs transfected with empty vector: *P < 0.05; **P < 0.01; ****P < 0.0001. ev, BMDMs transfected with empty vector; shIRF6, BMDMs transduced with IRF6-specific shRNA.
Similarly, shRNA-mediated knockdown of IRF6 did not affect the levels of activation-related surface markers in M1 BMDMs or inflammatory cytokine expression [Figs. 5(d) and Fig. 6(b)6]. Taken together, our results suggest that although IRF6 plays a central role in suppressing M2 polarization, it does not appear to influence M1 activation.
IRF6 suppresses M2 polarization by directly binding to the PPARγ promoter and inhibiting its expression
Given the central role PPARγ has in promoting M2 polarization, we surveyed the upstream region of PPARγ for ISREs (33, 39–41). Using both the JASPAR database (http://jaspar.binf.ku.dk/) and previously reported IRF6 consensus binding sequences, we predicted five potential IRF6 binding sites within 4 kb upstream of the PPARγ coding region [Fig. 7(a)] (42, 43). To identify genuine IRF6 binding sites, we performed ChIP on M2-polarized BMDM nuclear fractions with antibodies directed against IRF6. The enrichment of ISREs was examined by quantitative PCR with primer pairs flanking each predicted ISRE. Interestingly, two ISREs (ISRE1: −1444 to −1438, and ISRE2: −1782 to −1776; both having the sequence 5′-GAAACT-3′, relative to the 5′ end of the PPARγ coding region) displayed substantial enrichment, as evidenced by the fold change relative to total DNA input and IgG control [Fig. 7(b)].
IRF6 represses PPARγ expression by binding to two ISREs in its promoter. (a) ISREs are located upstream of the PPARγ coding region. (b) Enrichment of ISREs after ChIP with antibodies against IRF6 was examined by quantitative PCR (n=3). (c) Construct of luciferase reporter harboring both ISREs (−1857 to −1379, relative to the 5′ end of PPARγ coding region) is shown. (d) Luciferase reporter construct bearing WT ISRE1 and ISRE2 and constructs bearing mutations at −1782 (Mut1), −1444 (Mut2), or both (Mut1/2) were generated, and their luciferase activity was examined in cells activated for induction of PPARγ. Asterisks indicate significant differences from (b) Mock (IgG) or (d) WT: *P < 0.05; **P < 0.01; ****P < 0.0001. RLU, relative light units.
To validate the role of these two ISREs in mediating IRF6-regulated transcription, the genomic sequence harboring both ISREs (−1857 to −1379, relative to the 5′ end of PPARγ coding region) was inserted upstream of a luciferase reporter [pGL3-IRF6-WT; Fig. 7(c)]. To further define the binding efficiency of ISREs, we generated mutant constructs bearing mutations at −1782 (pGL3-IRF6-Mut1), −1444 (pGL3-IRF6-Mut2), or both (pGL3-IRF6-Mut1/2) (Table 1). Luciferase activity was examined in cells activated for induction of PPARγ. Our results demonstrate that promoter constructs containing identified ISREs with enriched binding efficacy for IRF6 displayed suppressed luciferase activity compared with cells transfected with control vector [Fig. 7(d)]. Interestingly, mutation of ISRE-1782 (Mut1) but not ISRE-1444 (Mut2) partially rescued suppression in activated cells, whereas double mutation (pGL3-IRF6-Mut1/2) displayed slightly higher luciferase activity than mutation of ISRE-1782 (Mut1). Taken together, these results demonstrate that IRF6 represses PPARγ expression in macrophages primarily through binding to ISRE-1782 located upstream of the PPARγ coding region.
Discussion
Macrophage polarization is a tightly regulated process controlled by well-orchestrated gene transcriptional networks resulting from microenvironmental stimuli (44, 45). Dynamic expression of the IRF family of transcription factors is known to be crucial for immune cell activation through their interaction with pattern recognition receptor–associated signaling pathways (46, 47). Previous studies indicate that several IRF family members, including IRF1, IRF5, and IRF7, interact with MyD88 to trigger the TLR-mediated expression of proinflammatory genes, and other IRFs have anti-inflammatory properties. IRF4 acts downstream of the IL-4 receptor/signal transducer and activator of transcription (STAT) 6 signaling cascade to attenuate TLR-dependent inflammatory responses by competing with IRF5 for binding to MyD88 (18, 19, 48).
Similar to IRF4, our study indicates that IRF6, a poorly characterized IRF family member, acts downstream of the IL-4 signaling pathway to influence M2 macrophage activation. Indeed, we observed that IRF6 expression was repressed during the initial stages of M2 activation, but remained unresponsive to LPS stimulation. In contrast to IRF4, our results indicate IRF6 acts as a physiologic “brake” for M2 macrophage responses until encountering appropriate environmental cues. Furthermore, we demonstrated that IRF6 regulates alternative macrophage polarization through a regulatory mechanism independent from the interactions with TLR/MyD88 signaling that characterize other IRF family members. One potential molecular explanation for IL-4’s impact on IRF6-mediated M2 polarization is the presence of 10 STAT consensus sites upstream of IRF6, as determined by the JASPAR prediction algorithm, suggesting STAT6 might suppress IRF6, but this remains to be determined.
Until this study, the relationship between IRFs and PPARγ-dependent alternative macrophage activation was unclear. PPARγ is a crucial regulator of alternative macrophage polarization because it is known that PPARγ-deficient macrophages exhibit impaired M2 macrophage responses (39, 49). Our findings reveal that IRF6 directly represses PPARγ expression through direct binding to ISREs located upstream the PPARγ coding region, primarily ISRE-1782, and that IL-4–induced downregulation of IRF6 expression licenses PPARγ-dependent alternative M2 activation. Our study contrasts with previous work that did not find a role for IRF6 in macrophage activation (29, 50). However, a major difference is that those studies were directed to characterization of IRF6 expression in circulating human monocytes.
The balance between alternative and proinflammatory macrophage activation is particularly relevant to the pathogenesis of chronic adipose tissue inflammation in obesity. Obese adipose tissue is characterized by massive expansion of resident ATMs that manifest proinflammatory responses by suppressing anti-inflammatory pathways (8, 9). Prior research demonstrated that macrophage-specific PPARγ deficiency attenuates alternative ATM polarization and exacerbates obesity-associated insulin resistance (39, 51, 52). Our findings suggest that a dysregulated IRF6/PPARγ regulatory axis in BMDMs and might provide references for future study addressing suppressed anti-inflammatory ATM responses. In our study, the IRF6 expression was lower in obese ATMs than in lean ATMs, despite the latter containing a higher portion of M2 macrophages. Unpolarized BMDMs presented rapid decrease in IRF6 levels upon M2 activation, suggesting involvement of IRF6 in the initial steps of M2 polarization. In contrast, the obese/lean ATMs were isolated from mice after 16 weeks feeding with low-fat diet/HFD and thus may contain well-established macrophage populations of different polarization types. The difference in IRF6 levels in BMDMs and ATMs suggest that this molecule may play different roles in triggering and maintaining of the macrophage polarization. In addition, it should be noted that ATMs in vivo may adapt numbers of polarization types besides the typical M1/M2 activation (7–11, 53, 54), and further studies are needed to validate the IRF6–PPARγ axis in animal models and human tissues at different stages of macrophage differentiation. Given the role of adipocyte-intrinsic PPARγ in mediating insulin sensitivity, it would be important to probe whether a similar interaction between IRF6 and PPARγ is present within adipocytes and might thus contribute to metabolic dysfunction in obesity (55–57). Further analysis of IRF6 will provide crucial information to understand macrophage action and might suggest gene targets for drug development to mitigate metabolic and inflammatory-based diseases.
Abbreviations:
- ATM
adipose tissue macrophage
- BMDM
bone marrow–derived macrophage
- ChIP
chromatin immunoprecipitation
- HFD
high-fat diet
- IgG
immunoglobulin G
- IL
interleukin
- IRF
interferon regulatory factor
- ISRE
interferon-stimulated response element
- LPS
lipopolysaccharide
- M1
classical activation
- M2
alternative activation
- PCR
polymerase chain reaction
- PPARγ
peroxisome proliferator-activated receptor-γ
- RT-PCR
reverse transcription polymerase chain reaction
- SEM
standard error of the mean
- shRNA
short hairpin RNA
- STAT
signal transducer and activator of transcription
- TLR
toll-like receptor
- VSC
visceral fat stromal cell
- WT
wild-type.
Acknowledgments
We thank Mrs. Deborah J. Kovar of Laboratory Animal Research Resources of Texas A&M University for assistance in animal husbandry and care.
This work was supported by American Diabetes Association Grant 1-13-JF-59 (to B.Z.), National Institutes of Health/National Institute of Diabetes and Digestive and Kidney Diseases Grant 1R01DK098662 (to B.Z.), American Heart Association Grant 16POST31350039 (to W.Y.), National Natural Science Foundation of China Grant 81600610 (to W.Y.), and UCSD/UCLA Diabetes Research Center Pilot and Feasibility Grant P30 DK063491 (to W.Y.).
Author contributions: B.Z. conceived of the project. C.L., W.Y., Z.H., and T.B. designed the experiments. C.L., W.Y., Z.H., T.B., and A.M. conducted the experiments and analyzed the data. C.L., W.Y., T.B., A.T.V., and B.Z. composed and revised the manuscript.
Disclosure Summary: The authors have nothing to disclose.
References
