


Abstract
Aims Whilst the CArdiac REsynchronization in Heart Failure (CARE-HF) trial has shown that cardiac resynchronization therapy (CRT) leads to reduced morbidity and mortality, the cost-effectiveness of this therapy remains uncertain. The aim of this study was to evaluate the incremental cost per quality adjusted life year (QALY) gained and incremental cost per life year gained of CRT plus medical therapy compared to medical therapy alone.
Methods and results This prospective analysis based on intention to treat data from all patients enrolled in the CARE-HF trial at 82 clinical centres in 12 European countries. A total of 813 patients with New York Heart Association class III or IV heart failure due to left ventricular systolic dysfunction and cardiac dyssynchrony were randomized to CRT plus medical therapy (n=409) vs. medical therapy alone (n=404). During a mean follow-up of 29.4 months CRT was associated with increased costs (€4316, 95% CI: 1327–7485), survival (0.10 years, 95% CI: −0.01–0.21), and QALYs (0.22, 95% CI: 0.13–0.32). The incremental cost-effectiveness ratio was €19 319 per QALY gained (95% CI: 5482–45 402) and €43 596 per life-year gained (95% CI: −146 236–223 849). These results were sensitive to the costs of the device, procedure, and hospitalization.
Conclusion Treatment with CRT appears cost-effective at the notional willingness to pay threshold of €29 400 (£20 000) per QALY gained.
Introduction
Heart failure is an increasing worldwide health problem. In the United States, it is estimated that nearly five million people are living with heart failure, and 550 000 new cases are diagnosed each year,1 whereas in Europe estimates suggest over 10 million people are suffering from this chronic disease.2 Heart failure is a costly disease in terms of morbidity, mortality, and resources. The management of heart failure is estimated to consume at least 1–2% of total health-care expenditure in a diverse range of developed countries.3
Despite the success of pharmacological therapy, heart failure remains associated with significant morbidity and mortality.4 New targets for therapy are being identified, many of which are aimed at specific groups of patients rather than the whole population. Cardiac resynchronization therapy (CRT), which aims to restore synchronous cardiac contraction, is one such therapy that aims to treat patients with cardiac dyssynchrony, a complex multi-component syndrome, which leads to a reduction in systolic performance, impaired ventricular filling, and contributes to systolic and diastolic mitral regurgitation.5–7 A series of randomized controlled trials has demonstrated that patients with heart failure from cardiac dyssynchrony, who have persistent, moderate, or severe symptoms despite standard pharmacological therapy, gain additional benefit from CRT in terms of improved symptoms, exercise capacity, ventricular function, and quality of life.8–12 The Comparison of Medical Therapy, Pacing, and Defibrillation in Heart Failure (COMPANION) trial also showed that CRT, alone or combined with an implantable defibrillator (CRT-ICD), reduced the composite endpoint of death from any cause or hospitalization; however, although CRT-ICD significantly reduced mortality, the decrease in the risk of death with CRT alone compared with medical therapy was not statistically significant.13 Meta analyses and cost-effectiveness analyses based on results from these studies have left lingering uncertainty on both the effectiveness, in terms of survival, and cost-effectiveness of CRT and medical therapy compared with medical therapy alone.14–18
Recent results from the CArdiac REsynchronization in Heart Failure (CARE-HF) trial have shown for the first time that CRT leads to improved survival in addition to improving symptoms, quality of life, and ventricular function.19 In this prospective cost-effectiveness analysis, we compared the incremental cost-effectiveness of CRT and medical therapy with medical therapy alone in terms of incremental cost per life-year gained and incremental cost per quality-adjusted life-year (QALY) gained on the basis of individual patient data from the CARE-HF trial.
Methods
Overview of CARE-HF
The design and results of the CARE-HF study have been reported previously.19,20 In brief, eligible patients were at least 18 years of age, had evidence of heart failure for at least 6 weeks, and were in New York Heart Association (NYHA) class III or IV despite receipt of standard pharmacologic therapy, with a left ventricular ejection fraction of <35%, a left ventricular end-diastolic dimension of ≥30 mm (indexed to height), and a QRS interval of >120 ms on the electrocardiogram. Patients with a QRS interval of 120–149 ms were required to meet two of three additional criteria for dyssynchrony: an aortic pre-ejection delay of >140 ms, an interventricular mechanical delay (IVMD) of more than 40 ms, or delayed activation of the posterolateral left ventricular wall. A total of 813 patients were randomly assigned to receive medical therapy alone (n=404) or with CRT (n=409). The protocol required follow-up to continue for 18 months after the last patient had been enrolled. The mean duration of follow-up was 29.4 months (range 18.0–44.7). The primary endpoint was the time to death from any cause or unplanned hospitalization for a major cardiovascular event. The principal secondary endpoint was death from any cause. The cost-effectiveness analysis was specified a priori as a secondary outcome in the protocol and included data from all patients enrolled in the trial.20 The principal analysis was pre-specified as the incremental cost per QALY gained.
Estimating benefits
Effectiveness was defined in terms of QALYs and life-years gained associated with CRT during the trial.
Survival
The restricted mean survival was estimated for each patient within the trial on the basis of the time from randomization until death or censorship. The gain in survival associated with CRT was estimated from the difference in mean survival times between treatment groups. Extrapolation of the survival curves beyond the trial was undertaken to estimate the expected lifetime of the device beyond the study period. Survival was extrapolated using exponential, Weibull, log-normal, and log-logistic models. The exponential model was selected as it had the best model fit based on the Akaike Information Criterion.21 Further details are given in Appendix 1.
Quality of life
Patients' quality of life was assessed using the EQ-5D22 at baseline and 90 days post-randomization. The EQ-5D is a self-administered, validated, multi-attribute, preference-based measure of health status.22,23 Patients were asked to rate the severity of their current problems for five dimensions of health: mobility, self-care, usual activities, pain/discomfort, and anxiety/depression. EQ-5D health states were converted into utilities, where 1 is full health and 0 is dead, using preference data elicited from the UK general population.24 Quality of life was also assessed at baseline and 90 days, using the disease-specific Minnesota Living with Heart Failure Questionnaire (MLWHF).25,26 In addition, this instrument was also used to assess the long-term effects of CRT on quality of life at 18 months and at end-of-study. Utilities at 18 months and at end-of-study for all trial patients were estimated from MLWHF scores collected at 18 months and end-of-study on the basis of a mixed model of the relationship between change in EQ-5D score to change in MLWHF (baseline to 90 days), accounting for baseline EQ-5D and MLWHF scores and clinical variables, with clinical centres as random effects (Appendix 2).27 The variables included in the model were pre-specified on the basis of prior clinical knowledge to reduce the risk of optimism in the model.28 Missing EQ-5D scores at baseline and 90 days and missing MLWHF scores at baseline, 3 months, 18 months, and end-of-study were estimated by imputation, accounting for patients' characteristics on the basis of the following predictor variables: EQ-5D and MLWHF scores, gender, NYHA class, baseline IVMD, and baseline mitral regurgitation and treatment (for missing values post-baseline). A utility of zero was assigned at the time of a patient's death.24 For those patients who received a heart transplant or withdrew from the study, a utility score of 0 was assigned at the time of censorship.
Quality-adjusted life-years
QALYs were calculated for each patient from their survival and quality of life (based on EQ-5D utility scores at baseline, 3 months, 18 months, and end-of-study).29 QALYs were calculated for each patient through the area under the curve estimated through the linear interpolation of each individual patient-level estimate of health utility.
Estimating costs
Measurement of resource utilization
Resource use information was collected at baseline, 1, 3, 6, 9, 12, 18 months, every 6 months thereafter, and at the end-of-study.20 For each patient, data were collected on the number of attempts, success, and type of implant (CRT or CRT-ICD), length of hospital stay [ward, intensive care unit (ICU), and coronary care unit (CCU)], cardiac surgical procedures [coronary artery bypass graft (CABG), angioplasty (PTCA), and heart transplant], number of outpatient, cardiologist, or primary-care visits, and length of time spent in nursing or residential homes or in a rehabilitation centre. Cardiovascular medication use was estimated for patients on the basis of their cardiovascular medication logs. For those patients who were censored (due to planned heart transplant or withdrawal from the study), costs and benefits were accrued until censorship, but thereafter the patient was assumed to accrue no further costs or benefits.
Medical care
Within trial costs were generated for each patient on the basis of a UK health-care perspective in pounds sterling, and were converted to euros at a conversion rate of €1.47=£1. Cost per day spent in hospital, coronary or intensive care unit, in a residential or nursing home or rehabilitation centre and per day care or outpatient visit, primary care or cardiologist visit were estimated on the basis of the National Health Service reference costs.30,31 Cardiovascular procedure costs, specifically CABG, PTCA, and transplants, were based on UK Department of Health Healthcare Resource Group estimates (minus hospitalization costs for the mean length of stay, to avoid double counting of costs associated with hospitalization).30–32 The costs of medications were obtained from the British National Formulary.33
Device costs and longevity
Costs of CRT and CRT-ICD devices vary within and across countries. The costs of these devices were therefore based on mean estimates of the manufacturer's list prices averaged across the models and countries involved in the CARE-HF trial. Each patient who underwent an implant attempt was assigned a procedure cost at the time of the attempt on the basis of an estimate derived from UK Healthcare Resource Group estimate of a pacemaker implant in patients with heart failure, accounting for the increased duration of the procedure.32 As implant failure was likely to result from failure to position the LV lead, patients with an implant failure were assigned a cost for the procedure and the LV lead only. For those patients with repeated implants, or for those patients who died during the study, the total cost of the device and leads was spread over the time from implantation until the time of death or time of next implant, respectively.
Patients who received a successful implant and survived until the end of the trial would still accrue benefits from the device after the end of the study. Applying the full capital cost of a device at the time of implant would therefore overestimate the cost of the device relative to the potential benefits.34 In order to account for this, the cost was spread over the potential lifetime of the device accounting for patient survival. Thus, only those costs incurred during the study period were included in the cost-effectiveness analysis. For the base-case analysis, both the CRT and CRT-ICD devices were assumed to have a battery life of 6 years.35
Statistical methods
All analyses were conducted using SAS software (version 9.12 SAS Institute). Analyses were undertaken according to the intention-to-treat principle.36 Bootstrap CIs were calculated for cost, life-year, and QALY differences between groups.37 The incremental cost per life-year gained and incremental cost per QALY because of CRT were estimated from the incremental costs and QALYs associated with CRT use. A bootstrap approach was used to estimate 95% CI for the incremental cost-effectiveness ratios.37 This approach incorporates uncertainty in both the patient-level estimates of costs and QALYs.
Discounting
For the base-case analysis, both costs and benefits were discounted at a rate of 3.5%, as recommended for UK public sector investments.38
Sensitivity analyses
Sensitivity analyses were used to explore the effect of hospitalization cost, device longevity, procedure cost, device cost, and the effect of discounting (undiscounted and 3% on both cost and benefits) on the results. The effect of assigning a utility of zero to patients at the time of censorship was also explored by applying the last value carried forward at the time of censorship. In addition, the effect of the model specification to predict utilities at 18 months and at end-of-study was evaluated through the development of a reduced model based on observed predictive relationships (Appendix 2).
Results
Resource utilization and costs
Undiscounted unit resource costs and resource use by treatment groups are shown in Table 1. The mean number of days spent in hospital for any reason during the trial (including hospitalization for device implant) was similar in both treatment groups, with patients in the medical therapy arm spending on average 22.4 days (interquartile range 0–31) in hospital compared with 20.7 days (interquartile range 4–26) in the CRT group. The median duration of hospitalization for implantation was 5 days (interquartile range 2–8).
Survival
Survival status was known for all patients at end-of-study. There were 82 deaths in the CRT group compared with 120 in the medical therapy group (20 vs. 30%; hazard ratio from Cox proportional hazards model including baseline NYHA as a covariate: 0.64; 95% CI: 0.48–0.85; P<0.002).19 Within the trial, the restricted mean length of survival (until death or censorship) was 1.96 years (interquartile range 1.53–2.59) with medical therapy compared with 2.07 years (interquartile range 1.65–2.61) with medical therapy plus CRT. The application of discounting resulted in a mean discounted survival of 1.92 years (interquartile range 1.51–2.52) with medical therapy compared with 2.02 years (interquartile range 1.62–2.53) with CRT, resulting in a discounted within-trial incremental gain in survival with CRT of 0.10 (95% CI: −0.01–0.21) (Table 2).
Quality-adjusted life-years
Quality of life data were available for >87% of those patients still alive at each of the specified data collection time points. Within the trial, the mean number of QALYs was 1.22 (interquartile range 0.66–1.78) with medical therapy alone compared with 1.45 (interquartile range 1.02–1.97) with medical therapy plus CRT. On average, patients in the medical therapy group had 1.19 (interquartile range 0.65–1.73) discounted QALYs within the trial compared with 1.42 (interquartile range 1.01–1.92) in the medical therapy plus CRT group, resulting in an incremental gain in QALYs with CRT of 0.22 (95% CI: 0.13–0.32) (Table 2).
Incremental cost-effectiveness
The incremental cost per QALY gained associated with CRT therapy was €19 319 (95% CI: 5482–45 402). The incremental cost per additional life-year gained of CRT therapy was estimated as €43 596/LYG (95% CI: −146 236–223 849) (Table 2). Bootstrapped estimates of paired incremental costs and incremental QALYs are shown in Figure 1 using the cost-effectiveness plane. The probability of CRT being cost-effective compared with medical therapy alone, given a notional willingness-to-pay threshold of €29 400 (£20 000)/QALY, is 83% (Figure 2). On the basis of a willingness-to-pay threshold of €44 100 (£30 000)/QALY, CRT also appears likely to be cost-effective.39
Sensitivity analyses
The importance of key assumptions of the cost-effectiveness analysis, and their effect on the overall results, were explored through sensitivity analyses. The effect of using different discount rates, changing the estimated device longevity, changing the hospitalization cost, and other potentially important criteria are shown in Table 3. The impact of changing the cost of the CRT device is shown in Figure 3.
Discussion
In this prospective within-trial cost-effectiveness analysis from the CARE-HF trial, we have estimated the incremental cost-effectiveness of CRT therapy to be €19 319 per QALY (95% CI: 5482–45 402). This result suggests that the use of CRT devices represents a cost-effective use of health-care resources. This result is robust to reasonable changes in the estimated lifetime of the device, to various discount rates, and to the hospitalization cost. As expected, changing the cost of the CRT device and the cost associated with the implant procedure have the largest impact on the cost-effectiveness of CRT.
The incremental cost-effectiveness of CRT estimated from the CARE-HF trial differs markedly from those obtained by Nichol et al.17 Their analysis did not include data from the pivotal CARE-HF trial, used a Markov model with Monte Carlo simulation, and a discount rate of 3%, which gave a median estimate of the incremental cost-effectiveness of using CRT of $107 800/QALY gained. However Nichol et al. recommend that their results should be interpreted cautiously, given the magnitude in the uncertainty of incremental costs and incremental effects. Crucially, it appears that the increase in both quantity and quality of life benefits were underestimated in their analyses compared with the prospective results from the CARE-HF trial.19
Our analyses have a number of strengths. We have evaluated, for the first time, the cost-effectiveness of CRT using a within-trial analysis on the basis of data from a large, prospective, randomized, controlled trial. The analysis is based on individual patient data collected at 82 centres across Europe and an average of 29.4 months follow-up. The cost-effectiveness study was specified a priori in the trial protocol and included data from all patients enrolled in the study.
A limitation of our analysis is that the results were analysed from a UK health-care perspective, as specified in the trial protocol. The costs associated with health-care delivery and devices will vary both within and across countries and in different health-care systems. Utility scores were derived on the basis of the multi-attribute EQ-5D, by applying utility scores to patients' health states, on the basis of UK population preference data.24 The strength of this position is that it takes into account the societal view. In addition, the UK value set appears to be similar to those elicited for other countries, including the US.40–43
The estimate of within-trial life-years gained used in our analysis is appropriate for the approach that we use but underestimates the overall benefits of CRT, as it is restricted to the period of follow-up observed in the trial. The restricted mean survival benefit is also statistically inefficient when compared with survival analysis methods. Thus, although fit for the purpose for which it is applied in this within-trial analysis, it does not provide the best estimator of survival differences between the groups.
Although a within-trial health economic analysis is a strength, as it is based on individual patient data, it can also be seen as a limitation. An alternative model-based cost-effectiveness analysis would provide a fuller evaluation of the likely benefits and costs of therapy over the expected lifetime of patients and devices. However, a major disadvantage of a model-based cost-effectiveness evaluation is the strong assumptions that are required, particularly on survival extrapolated beyond the period observed in the trial. In addition, a model-based analysis cannot represent uncertainty as robustly as a within-trial analysis on the basis of observed data from individual patients.
Our results apply to patients who meet the inclusion and exclusion criteria used in the CARE-HF trial.19 Care should be taken in applying these data to patients excluded from the trial, such as those with few or no symptoms, patients with less evidence of dyssynchrony or less severe ventricular dysfunction, and those with atrial fibrillation.20 Further trials are being conducted to assess the effects and costs of CRT in other populations.44,45
It should also be recognized that CRT is not yet a mature technology. CRT may be useful in groups of patients other than those studied so far. Some patients randomized in existing studies may not have benefited from CRT. Further research is required to identify which variables best predict response to CRT. More accurate targeting of the intervention may avoid unnecessary patient morbidity and make CRT appear more cost-effective. Technological developments in the delivery of CRT are also likely to reduce costs by reducing implantation times and failures and by delivering more effective resynchronization to more eligible patients.
Potentially, the use of a CRT-ICD device which includes an implantable cardioverter defibrillator could prevent further sudden deaths. This may be especially desirable if there is no substantial increase in concomitant morbidity. Adding ICD therapy will have an additional cost, however. At present there is no good evidence of the incremental cost-effectiveness of CRT relative to CRT-ICD.
Important questions remain surrounding the cost-effectiveness of CRT, in particular the generalizability of our findings to the wider heart failure population and the incremental cost-effectiveness of CRT relative to CRT-ICD. This analysis based on data from the CARE-HF trial suggests that in NYHA III/IV patients with left ventricular dysfunction and dyssynchrony CRT is a cost-effective intervention.
Acknowledgement
This study was funded through an unrestricted research grant from Medtronic Inc. The sponsor was not involved in the design or conduct of the study, or in the writing of the paper.
Conflict of interest: M.C., N.F., J.C., and J.-C.D. have received funding for research, travel and consulting from a number of companies which manufacture devices and drugs for the treatment of heart failure, including Medtronic Inc. No other conflicts of interest declared.
Appendix 1
Extrapolation of survival data
Survival was extrapolated out to 20 years using exponential, Weibull, log-normal, and log-logistic models. The exponential model was selected as it had the best model fit based on Akaike information criteria21 (Table A1).
Model fit parameters
| Model | Akaike information criteria |
|---|---|
| Exponential | 1292.68 |
| Weibull | 1294.19 |
| Log-logistic | 1297.60 |
| Log-normal | 1312.72 |
| Model | Akaike information criteria |
|---|---|
| Exponential | 1292.68 |
| Weibull | 1294.19 |
| Log-logistic | 1297.60 |
| Log-normal | 1312.72 |
Extrapolated Kaplan–Meier survival curves were fitted on the basis of the exponential function (Figure A1) and were used to predict the probability of survival beyond the study by treatment group (Table A2). This information was used to estimate the lifetime of the device battery accounting for patients' likely survival status.
Probability of survival based on extrapolated within-trial survival data
| Time (years) | Probability of survival | |
|---|---|---|
| Medical therapy | CRT | |
| 0 | 1 | 1 |
| 1 | 0.857 | 0.906 |
| 2 | 0.735 | 0.821 |
| 3 | 0.630 | 0.744 |
| 4 | 0.540 | 0.674 |
| 5 | 0.463 | 0.610 |
| 6 | 0.397 | 0.553 |
| 7 | 0.340 | 0.501 |
| 8 | 0.292 | 0.454 |
| 9 | 0.250 | 0.411 |
| 10 | 0.214 | 0.373 |
Appendix 2
Estimation of patient utilities within the CARE-HF trial
Methods
where α is the intercept, β1–7 are the regression coefficients, µ is the random effects parameter, and ε is the random error.
Results
The results of mixed modelling to predict change in EQ-5D score on the basis of change in MLWHF score, baseline quality of life, and pre-specified clinical variables is shown (Table A3). The relationship between difference in MLWHF score and EQ-5D score, baseline quality of life, and gender were highly significant (P<0.0001).
Regression analysis of change in EQ-5D score used in the base-case analysis as pre-specified in the analysis plan
| Effect | Estimate | Lower | Upper | P-value |
|---|---|---|---|---|
| Intercept | 0.7501 | 0.6580 | 0.8421 | <0.0001 |
| Change in MLWHFa | −0.00640 | −0.00719 | −0.00561 | <0.0001 |
| Baseline MLWHF | −0.00597 | −0.00681 | −0.00512 | <0.0001 |
| Baseline EQ-5D | −0.7342 | −0.7928 | −0.6756 | <0.0001 |
| Baseline IVMD | 0.000222 | −0.00024 | 0.000685 | 0.3464 |
| Female | −0.06269 | −0.09123 | −0.03415 | <0.0001 |
| NYHA III | −0.02274 | −0.07649 | 0.03100 | 0.4064 |
| Medical therapy alone | −0.01871 | −0.04457 | 0.007156 | 0.1560 |
| Baseline mitral regurgitation | 0.000463 | −0.00049 | 0.00 | 0.3384 |
aThe relationship between change in EQ-5D and MLWHF scores was estimated on the basis of 90-day score minus baseline score for each patient still alive at 90 days.
Results from the reduced model to predict change in EQ-5D score
| Effect | Estimate | Lower | Upper | P-value |
|---|---|---|---|---|
| Intercept | 0.7396 | 0.6741 | 0.8052 | <0.0001 |
| Difference in MLWHF | −0.00661 | −0.00736 | −0.00587 | <0.0001 |
| Baseline MLWHF | −0.00596 | −0.00679 | −0.00513 | <0.0001 |
| Baseline EQ-5D | −0.7357 | −0.7942 | −0.6771 | <0.0001 |
| Female | −0.06063 | −0.08899 | −0.03226 | <0.0001 |
A reduced model was produced on the basis of stepwise selection of clinical variables that were statistically significant predictors of change in EQ-5D (Table A4) and was used to predict utilities at 18 months and end-of-study in the reduced model sensitivity analysis.
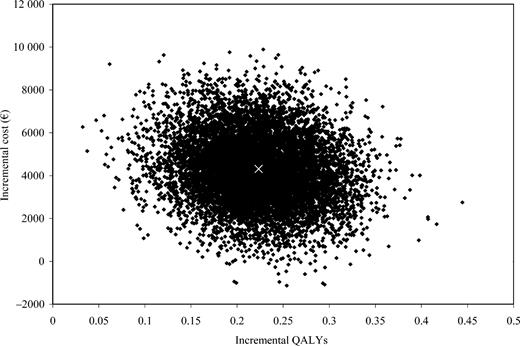
Figure 1 Distribution of incremental costs vs. incremental QALYs for CRT and medical therapy compared with medical therapy alone. Results of 10 000 bootstrap replications are shown and base-case estimate is indicated (×).
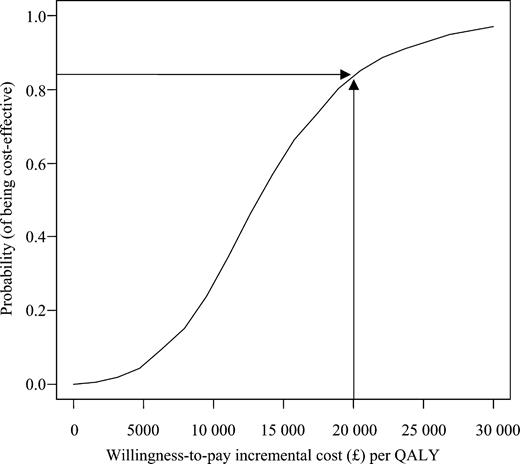
Figure 2 Cost-effectiveness acceptability curve. £20 000=€29 400.
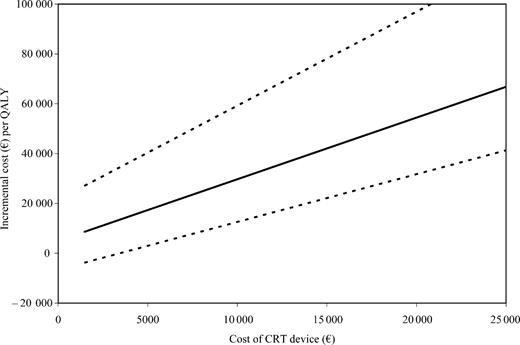
Figure 3 Sensitivity analysis: the effect of varying CRT device cost on cost/QALY estimates. Mean cost/QALY by CRT device is shown with 95% bootstrapped CI. CRT device cost includes cost of the device and leads. LV lead and procedure cost were kept constant.
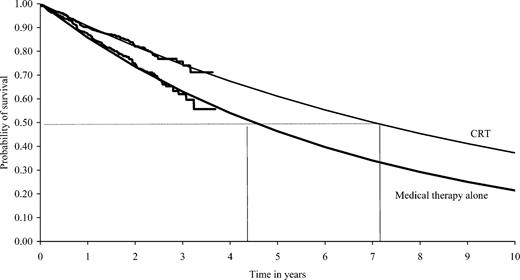
Figure A1 Extrapolated Kaplan–Meier survival curves.
Unit costs of resources and resource use in the CARE-HF trial
| Resource costs | Unit | Cost (€) |
|---|---|---|
| CRT | Device and leads | 5 808 |
| CRT-ICD | Device and leads | 19 977 |
| Left ventricular leads | — | 844 |
| CRT or CRT-ICD procedure cost | — | 1 576 |
| Hospital stay (cardiac) | Day | 240 |
| ICU stay | Day | 1 715 |
| CCU stay | Day | 456 |
| Cardiac day case | Day | 165 |
| Cardiac outpatient visit | Visit | 91 |
| Primary care visit (GP) | Visit | 41 |
| Residential home (private) | Week | 548 |
| Nursing home (private) | Week | 775 |
| Rehabilitation centre | Day | 263 |
| Heart transplant | — | 33 160 |
| CABG | — | 8 710 |
| PTCA | — | 3 356 |
| Resource use | Medical therapy (n=404) | CRT (n=409) |
| Days in hospital per patient, mean (median; interquartile range) | 22.4 (9; 0–31) | 20.7 (9; 4–26) |
| Days in ICU per patient, mean (median; interquartile range) | 0.79 (0; 0–0) | 0.35 (0; 0–0) |
| Days in CCU per patient, mean (median; interquartile range) | 2.52 (0; 0–0) | 2.92 (0; 0–2) |
| Total number of PTCA procedures | 7 | 6 |
| Total number of CABG procedures | 1 | 0 |
| Total number of heart transplants | 9 | 10 |
| Total number of attempted CRT implants | 48 | 467 |
| Total number of attempted CRT-ICD implants | 27 | 9 |
| Number of withdrawals during the studya | 14 | 5 |
aVital status was available for all patients at the end of the study, including those who withdrew from the study.
Incremental costs, effects, and cost-effectiveness of CRT
| Medical therapy alone (n=404) | CRT (n=409) | Mean difference (95% CIa) | |
|---|---|---|---|
| Cost per patient € mean (interquartile range) | 15 795 (3 684–18 185) | 20 110 (9 443–22 540) | 4 316 (1 327–7 485) |
| Mean life-years (interquartile range) | 1.92 (1.51–2.52) | 2.02 (1.62–2.53) | 0.10 (−0.01–0.21) |
| Mean QALYs (interquartile range) | 1.19 (0.65–1.73) | 1.42 (1.01–1.92) | 0.22 (0.13–0.32) |
| Incremental cost-effectiveness | |||
| Cost per QALY gained | €19 319 (5 482–45 402) | ||
| Cost per life-year gained | €43 596 (−146 236–223 849) |
aBootstrapped 95% CI.
Sensitivity analyses
| Analysis | Cost (€)/QALY (95% CI) |
|---|---|
| Base-case analysisa | 19 319 (5 482–45 402) |
| Undiscounted | 18 765 (4 794–42 079) |
| Discounted at annual rate of 3% for costs and benefits | 19 239 (5 054–42 977) |
| Device longevity 5 years | 20 611 (6 165–44 892) |
| Device longevity 7 years | 18 400 (4347–41 869) |
| Hospitalization cost of €735 | 15 957 (−3 759–47 857) |
| Reduced model to predict patient utilities | 21 105 (5 413–49 610) |
| Use of last value carried forward as end-of-study utility for those patients who were censored | 19 608 (5 167–43 543) |
| No cost applied for implant procedure | 12 399 (−1 060–33 146) |
aDiscounted at an annual rate of 3.5% for both costs and benefits, with estimated device battery longevity of 6 years.
References
Khand AU, Gemmell I, Rankin AC, Cleland JGF. Clinical events leading to the progression of heart failure: insights from a national database of hospital discharges.
Xiao HB, Brecker SJD, Gibson DG. Differing effects of right ventricular pacing and left bundle branch block on left ventricular function.
Daubert J, Cazeau S, Leclerc C. Do we have reasons to be enthusiastic about pacing to treated advanced heart failure?
Auricchio A, Klein H, Spinelli F. Pacing for heart failure: selection of patients, techniques and benefits.
Cazeau S, Leclercq C, Lavergne T, Walker S, Varma C, Linde C, Garrigue S, Kappenberger L, Haywood GA, Santini M, Bailleul C, Daubert JC; Multisite Stimulation in Cardiomyopathies (MUSTIC) Study Investigators. Effects of multisite biventricular pacing in patients with heart failure and intraventricular conduction delay.
Young JB, Abraham WT, Smith AL, Leon AR, Lieberman R, Wilkoff B, Canby RC, Schroeder JS, Liem LB, Hall S, Wheelan K; Multicenter InSync ICD Randomized Clinical Evaluation (MIRACLE ICD) Trial Investigators. Combined cardiac resynchronization and implantable cardioversion defibrillation in advanced chronic heart failure: the MIRACLE ICD Trial.
Abraham WT, Fisher WG, Smith AL, Delurgio DB, Leon AR, Loh E, Kocovic DZ, Packer M, Clavell AL, Hayes DL, Ellestad M, Trupp RJ, Underwood J, Pickering F, Truex C, McAtee P, Messenger J; MIRACLE Study Group. Cardiac resynchronization in chronic heart failure.
Higgins SL, Hummel JD, Niazi IK, Giudici MC, Worley SJ, Saxon LA, Boehmer JP, Higginbotham MB, De Marco T, Foster E, Yong PG. Cardiac resynchronization therapy for the treatment of heart failure in patients with intraventricular conduction delay and malignant ventricular tachyarrhythmias.
Bristow MR, Saxon LA, Boehmer J, Krueger S, Kass DA, De Marco T, Carson P, DiCarlo L, DeMets D, White BG, DeVries DW, Feldman AM; Comparison of Medical Therapy, Pacing, and Defibrillation in Heart Failure (COMPANION) Investigators. Cardiac-resynchronization therapy with or without an implantable defibrillator in advanced chronic heart failure.
Bradley DJ, Bradley EA, Baughman KL, Berger RD, Calkins H, Goodman SN, Kass DA, Powe NR. Cardiac resynchronization and death from progressive heart failure: a meta-analysis of randomized controlled trials.
McAlister FA, Ezekowitz JA, Wiebe N, Rowe B, Spooner C, Crumley E, Hartling L, Klassen T, Abraham W. Systematic review: cardiac resynchronization in patients with symptomatic heart failure.
Calvert M, Freemantle N, Cleland JGF. Cardiac resynchronization therapy in heart failure.
Nichol G, Kaul P, Huszti E, Bridges JFP. Cost-effectiveness of cardiac resynchronization therapy in patients with symptomatic heart failure.
Banz K. Cardiac resynchronization therapy (CRT) in heart failure: a model to assess the economic value of this new medical technology.
Cleland JGF, Daubert JC, Erdmann E, Freemantle N, Gras D, Kappenberger L, Freemantle N, Gras D, Kappenberger L, Tavazzi L; Cardiac Resynchronization-Heart Failure (CARE-HF) Study Investigators. The effect of cardiac resynchronization on morbidity and mortality in heart failure.
Cleland JGF, Daubert JC, Erdmann E, Freemantle N, Gras D, Kappenberger L, Klein W, Tavazzi L; CARE-HF study Steering Committee and Investigators. The CARE-HF study (CArdiac REsynchronization in Heart Failure study): rationale, design and end-points.
Akaike H. A new look at statistical model identification.
Euroqol Group. EQ-5D A Measure of Health-Related Quality of Life Developed by the Euroqol Group.
Rector TS, Kubo SH, Cohn JN. Patients' self-assessment of their congestive heart failure. Part 2: content, reliability and validity of a new measure, The Minnesota Living with Heart Failure Questionnaire.
Rector TS, Cohn JN. Assessment of patient outcome with the Minnesota Living with Heart questionnaire: reliability and validity during a randomized, double blind, placebo-controlled trial of pimobendan.
Harrell FE, Lee KL, Mark DB. Multivariable prognostic models: issues in developing models, evaluating assumptions and adequacy, and measuring and reducing errors. Stat Med
Gold MR, Siegel JE, Russell LB, Weinstein MC, eds.
Main C, Palmer S, Griffin S, Jones L, Orton V, Sculpher M, Henderson R, Sudlow C, Hawkins N, Riemsma R. Clopidogrel used in combination with aspirin compared with aspirin alone in the treatment of non-ST-segment-elevation acute coronary syndromes: a systematic review and economic evaluation.
Curtis L, Netten A.
Department of Health.
British National Formulary. http://www.bnf.org/bnf/ (14 March
Drummond M, O'Brien B, Stoddart G, Torrance G.
ICH E9 Expert Working Group. ICH Harmonised Tripartite Guideline. Statistical Principles for Clinical Trials (ICH E9).
Thompson SG, Barber JA. How should cost data in pragmatic randomised trials be analysed?
Rawlins MD, Culyer AJ. National Institute for Clinical Excellence and its value judgments.
http://www.euroqol.org/web/users/valuation_b.php (10 May
Badia X, Roset M, Herdman M, Kind P. A comparison of United Kingdom and Spanish general population time trade-off values for EQ-5D health states.
Johnson JA, Luo N, Shaw JW, Kind P, Coons SJ. Valuations of EQ-5D health states: are the United States and United Kingdom different?
Greiner W, Claes C, Busschbach JJV, Graf von der Schulenburg JM. Validating the EQ-5D with time trade off for the German population.
http://www.guidant.com/news/400/web_release/nr_000435.shtml (12 May

