


Abstract
Aims The adaptation of the myocardial microcirculation in humans to pathologic and physiologic stress has not been examined in vivo so far. We sought to test whether the relative blood volume (rBV) measured by myocardial contrast echocardiography (MCE) can differentiate between left ventricular (LV) hypertrophy (LVH) in hypertensive heart disease and athlete's heart.
Methods and results Four groups were investigated: hypertensive patients with LVH (n=15), semi-professional triathletes with LVH (n=15), professional football players (n=15), and sedentary control individuals without cardiovascular disease (n=15). MCE was performed at rest and during adenosine-induced hyperaemia. The rBV (mL mL−1), its exchange frequency (β, min−1), and myocardial blood flow (mL min−1 g−1) were derived from steady state and refill sequences of ultrasound contrast agent. Hypertensive patients had lower rBV (0.093±0.013 mL mL−1) than triathletes (0.141±0.012 mL mL−1, P<0.001), football players (0.129±0.014 mL mL−1, P<0.001), and sedentary individuals (0.126±0.018 mL mL−1, P<0.001). Conversely, the exchange frequency (β) was significantly higher in hypertensive patients (11.3±3.8 min−1) than in triathletes (7.4±1.8 min−1), football players (7.7±2.3 min−1), and sedentary individuals (9.0±2.5 min−1). An rBV below 0.114 mL mL−1 distinguished hypertensive patients and triathletes with a sensitivity of 93% and a specificity of 100%.
Conclusion Pathologic and physiologic LVH were differentiated non-invasively and accurately by rBV, a measure of vascularisation assessed by MCE.
Introduction
Left ventricular (LV) hypertrophy (LVH) is a structural and functional adaptation to increased wall stress. In patients with hypertensive heart disease, the presence of LVH is a strong predictor of future cardiac events and all-cause mortality.1–3 In athlete's heart, on the contrary, training-induced LVH is believed to pose no such risk and physical fitness reduces all-cause mortality.4 Pathologic LVH due to pressure overload by systemic hypertension arises from hypertrophy of myocytes and extravascular collagen deposition,5 which stiffens the LV and impairs diastolic filling.6 Biopsies demonstrated a reduction of arterioles and capillaries relative to the surrounding tissue.7,8 The arterioles' capacity to dilate is attenuated and consequently, the coronary vasodilator reserve is reduced.9,10 Furthermore, epicardial coronary arteries do not adequately increase in size with the extent of LVH.11 In athlete's heart, depending on the predominance of dynamic and/or static-exercise, volume and/or pressure load exerts LV wall stress, which is compensated by LVH, either eccentric or concentric, albeit this concept is rather relative.12–14 The physiologic nature of exercise-induced LVH has been confirmed by normal systolic and diastolic cardiac function and metabolism, and supernormal coronary vasodilator reserve.15–17 Epicardial coronary arteries increase proportionally in size with LV mass.18,19 Although these two forms of LVH are associated with ‘bad’ or ‘good’ outcome, the adaptation of myocardial microcirculation to increased wall stress remains to be investigated due to the lack of a suitable measurement technique. Recently, we demonstrated that myocardial contrast echocardiography (MCE) accurately measures the myocardial blood flow (MBF) via determination of the underlying microvascular parameters, relative blood volume (rBV), and its exchange frequency (β).20 The rBV corresponds to the intravascular volume fraction and thus reflects the capillary density. The exchange frequency (β) reflects the turnover of rBV and is a measure of the resistance to MBF. The current investigation, was set up to clarify the postulated differences of the microvascular response in hypertensive and athletic LVH.
Methods
Study population
For this pilot study, we included 15 individuals in each of the four groups: hypertensive patients with LVH (n=15), semi-professional triathletes with LVH (n=15), professional football players (n=15), and sedentary control individuals without cardiovascular disease (n=15). We initially screened the semi-professional triathlete teams, and then evaluated the age (range±2 years) and gender matched hypertensive patients with suspected LVH from the out-patient clinic of the Department of Nephrology and Hypertension. As control groups, sedentary individuals from the hospital staff and medical students, as well as members of a swiss premiere league football team were included. However the matching criteria could not be perfectly met for the latter, as they were all male and within a small range of age.
The reasons for ineligibility were the lack of LVH (nine hypertensive patients, 14 triathletes) and the presence of cardiovascular risk factors (one triathlete, four football players, five sedentary individuals). All eligible individuals were included and completed the study examinations.
All participants had no history of cardiac or pulmonary disease or cardiovascular risk factors except arterial hypertension in patients, defined as: systolic and diastolic blood pressure of >140 and >90 mmHg, respectively, in both office cuff and 24 h ambulatory blood pressure monitoring, or the need of antihypertensive drug therapy to maintain normotension. The study protocol was approved by the Ethics Committee of the University of Bern, and all individuals gave written informed consent to participate in the study.
Study protocol
Anaemia or hypercholesterolaemia were excluded by blood samples. All subjects abstained from methyl-xanthines including caffeine 24 h before the study and were studied after an overnight fasting period. Baseline echocardiography was performed in all participants to exclude significant valvulopathies or shunts. LVH was assessed by two-dimensional echocardiography according to the Teichholz formula as LV mass index exceeding ≥134 g m−2 and ≥109 gm−2 in men and women, respectively; a ratio of septal plus posterior wall thickness to LV cavity dimension in diastole greater than 0.45; an end-diastolic septal or posterior wall thickness ≥12 mm. The participants subsequently underwent MCE at rest and during adenosine-induced hyperaemia. Images were obtained from apicals chamber views.
Myocardial contrast echocardiography
Data acquisition
A Sequoia C512 ultrasound scanner (Siemens Medical Solutions, Mountain View, CA, USA) equipped with a 4V1c transducer and the contrast echo software CPS (Coherent Pulse Sequences) was used for real-time MCE. The machine settings were as follows: mechanical index (MI) for microsphere detection 0.13, MI for microsphere destruction 1.3, dynamic range 50 dB, linear post-processing, clip length 300 and 200 frames with intervals of 75 ms for rest and stress imaging, respectively.
Ultrasound contrast agent V08DA (SonoVue, Bracco SA, Mendrisio, Switzerland) was infused into the right cubital vein at a rate of 0.5–1 mL min−1. At rest, saline was infused at a rate of 2.8 mL kg−1 h−1 as a substitute for the adenosine infusion in order to obtain the same steady state concentration of the contrast agent in the intravascular compartment as during hyperaemia. When stable myocardial enhancement was reached, the contrast infusion rate was kept constant, and baseline image acquisition was performed. Steady state and refill sequences of contrast agent were derived before and after microsphere destruction, respectively. After completion of resting perfusion sequences, contrast and saline infusion were stopped, and hyperaemia was induced by intravenous adenosine 140 µg kg−1 min−1 (adenosine 3 mg mL−1 diluted in NaCl 0.9%) via a parallel port resulting in an infusion rate of 2.8 mL kg−1 h−1. After 3 min of adenosine infusion, contrast infusion was started at the same rate as in the resting study. After 6 min of adenosine infusion, hyperaemia perfusion sequences were obtained.
Data analysis
The product of rBV and exchange frequency (β) divided by tissue density (1.05 g mL−1) yielded MBF. Myocardial blood flow reserve (MBFR) was calculated as the ratio of hyperaemic and resting MBF.
Bicycle spiroergometry
All participants performed a bicycle spiroergometry starting at a workload of 100 Watt with a ramp protocol and increasing every minute by 15 Watt until exhaustion. Oxygen uptake (VO2, mL kg−1 min−1) and heart rate were continuously measured and sphygmomanometric blood pressure was obtained every 3 min. Peak VO2 was defined as the highest VO2 achieved during the last 30 s of peak exercise.
Statistical methods
Data were expressed as mean value±standard deviation. Only one measure per patient, i.e. the arithmetic mean of the three assessments obtained for the septal, lateral, and inferior segment, was used for further statistical analysis. All tests were two-sided. Repeated-measures analysis of variance (ANOVA) was performed for participant characteristics, echocardiographic, and MCE data. In case of a significance, paired t-tests were used for post-hoc analyses. In MCE data, uncorrected P-values were indicated for predefined pairwise comparisons (i.e. between hypertensive patients and triathletes, hypertensive patients and sedentary individuals, as well as triathletes and football players), whereas for the remaining pairwise and not predefined comparisons, P-values were adjusted for multiple testing by Holm's procedure.
Linear regression analysis was carried out for the detection of correlation between MBFR and maximal oxygen uptake, as well as maximal workload, respectively. Receiver-operating-characteristics analyses were used to assess the accuracies of rBV and exchange frequency (β). Statistical significance was defined at P<0.05.
Results
Participant characteristics and echocardiographic data
The characteristics of the study population are shown in Table 1. In the group with hypertensive heart disease, 12 patients had essential hypertension and three an underlying renal disease (IgA nephropathy, n=2; renal artery stenosis, n=1) without significant renal functional impairment. All patients were on antihypertensive therapy: angiotensin-converting enzyme inhibitors, n=7; angiotensin receptor antagonists, n=6; beta-blockers, n=6; calcium antagonists, n=4; diuretics, n=7. There was no statistical difference among the age of the groups. Body mass index was significantly higher in hypertensive than in other subjects. Hypertensive patients had systolic hypertension, and an increased rate pressure product. During adenosine-induced hyperaemia, heart rate significantly increased in all groups (hypertensive patients P<0.001, triathletes P=0.002, football players P=0.03, and sedentary individuals P<0.001) and so did the rate pressure product (hypertensive patients P<0.001, triathletes P=0.02, football players P=0.046, and sedentary individuals P=0.003).
Participant characteristics and haemodynamic data
| Hypertensive patients | Triathletes | Football players | Sedentary individuals | ANOVA | |
|---|---|---|---|---|---|
| Number (women) | |||||
| Evaluated | 24(2) | 30(3) | 19(0) | 20(1) | |
| Ineligible | 9(1) | 15(2) | 4(0) | 5(0) | |
| Included | 15(1) | 15(1) | 15(0) | 15(1) | |
| Age, years | 33±9 | 33±9 | 27±4 | 32±8 | 0.18 |
| Body mass index, kg m−2 | 26.6±3.9T**,F*,S** | 22.0±0.8F** | 24.1±1.1 | 22.8±2.5 | <0.001 |
| Rest | |||||
| Heart rate, min−1 | 65(64) ±10T* | 56(56)±5S* | 60(60)±6 | 67(68)±10 | 0.005 |
| Systolic blood pressure, mmHg | 143(137)±17T**,F**,S** | 121(120)±10S* | 119(120)±8 S* | 111(113)±10 | <0.001 |
| Diastolic blood pressure, mmHg | 82(82)±16T*,F**,S** | 73(76)±9S* | 69(65)±10 | 64(65)±11 | <0.001 |
| Rate pressure product, min−1 mmHg | 9418(8505)±2444T**,F**,S* | 6814(6724)±827 | 7102(7018)±789 | 7509(7202)±1450 | <0.001 |
| Hyperaemia | |||||
| Heart Rate, min−1 | 90(87)±13T**,F** | 67(65)±13S** | 69(72)±15S* | 82(80)±13 | <0.001 |
| Systolic blood pressure, mmHg | 135(137)±9T**,F**,S** | 115(114)±11 | 119(120)±12S* | 109(107)±10 | <0.001 |
| Diastolic blood pressure, mmHg | 76(73)±9T*,F*,S** | 66(65)±12 | 65(66)±11 | 62(63)±11 | 0.002 |
| Rate pressure product, min−1 mmHg | 12221(12400)±2119T**,F**,S** | 7697(7410)±1613S* | 8244(7776)±2266 | 8961(9095)±1708 | <0.001 |
ANOVA repeated-measures analysis of variance, if significant two-sided t-tests were performed for pairwise comparisons. Values are denoted as mean(median)±standard deviation or number. T, F, and S denote comparison with triathletes, football players, and sedentary individuals, respectively.*P<0.05, **P<0.01.
Echocardiographic data are summarized in Table 2. LV ejection fraction (EF) was not different among the groups. Hypertensive patients showed several transmitral and mitral annular Doppler parameters indicative of LV diastolic dysfunction, whereas the other groups (in particular the triathletes) did not.
Echocardiographic data
| Hypertensive patients | Triathletes | Football players | Sedentary individuals | ANOVA | |
|---|---|---|---|---|---|
| LV EF, % | 64±4 | 65±3 | 64±2 | 65±3 | 0.50 |
| Interventricular septum (ED), mm | 15.7±2.6T**,F**,S** | 13.3±1.6F**,S** | 11.1±1.0S* | 10.2±0.7 | <0.001 |
| Posterior wall (ED), mm | 13.6±1.8T**,F**,S** | 11.9±1.8F**,S** | 10.5±0.6S* | 9.7±0.8 | <0.001 |
| LV (ED) diameter, mm | 46.2±6.5F** | 49.9±4.1 | 51.3±2.9S** | 48.6±3.9 | 0.03 |
| LV mass index, g m−2 | 140±30F**,S** | 134±15F**,S** | 108±14S** | 94±13 | <0.001 |
| Left atrial diameter, mm | 38.7±3.6 | 39.6±5.0 | 37.8±3.8 | 35.3±4.7 | 0.06 |
| Diastolic parameters | |||||
| Early diastolic peak velocity (E), cm s−1 | 72.3±17.5 | 73.1±12.6 | 66.5±10.3 | 70.2±10.4 | 0.59 |
| Late diastolic peak velocity (A), cm s−1 | 65.7±12.9T**,F**,S** | 44.9±10.5 | 39.6±5.4 | 44.5±11.7 | <0.001 |
| E/A | 1.16±0.45T*,F*,S* | 1.68±0.38 | 1.70±0.30 | 1.66±0.42 | <0.007 |
| Deceleration time of E, ms | 198±40F** | 184±24F** | 153±26 | 169±20 | <0.001 |
| Isovolumertic relaxation time, ms | 97±26 | 83±15 | 84±11 | 85±11 | 0.07 |
| Mitral annular E velocity TDI, cm s−1 | 7.5±1.4 | 12.0±2.4 | 13.0±3.0 | 10.4±1.6 | 0.85 |
| Mitral annular A velocity TDI, cm s−1 | 9.7±1.9 | 10.3±3.0 | 8.0±1.5 | 9.3±2.5 | 0.38 |
ANOVA repeated-measures analysis of variance, if significant two-sided t-tests were performed for pairwise comparisons. Values are denoted as mean(median)±standard deviation or number. T, F, and S denote comparison with triathletes, football players, and sedentary individuals, respectively. *P<0.05, **P<0.01.
MCE data
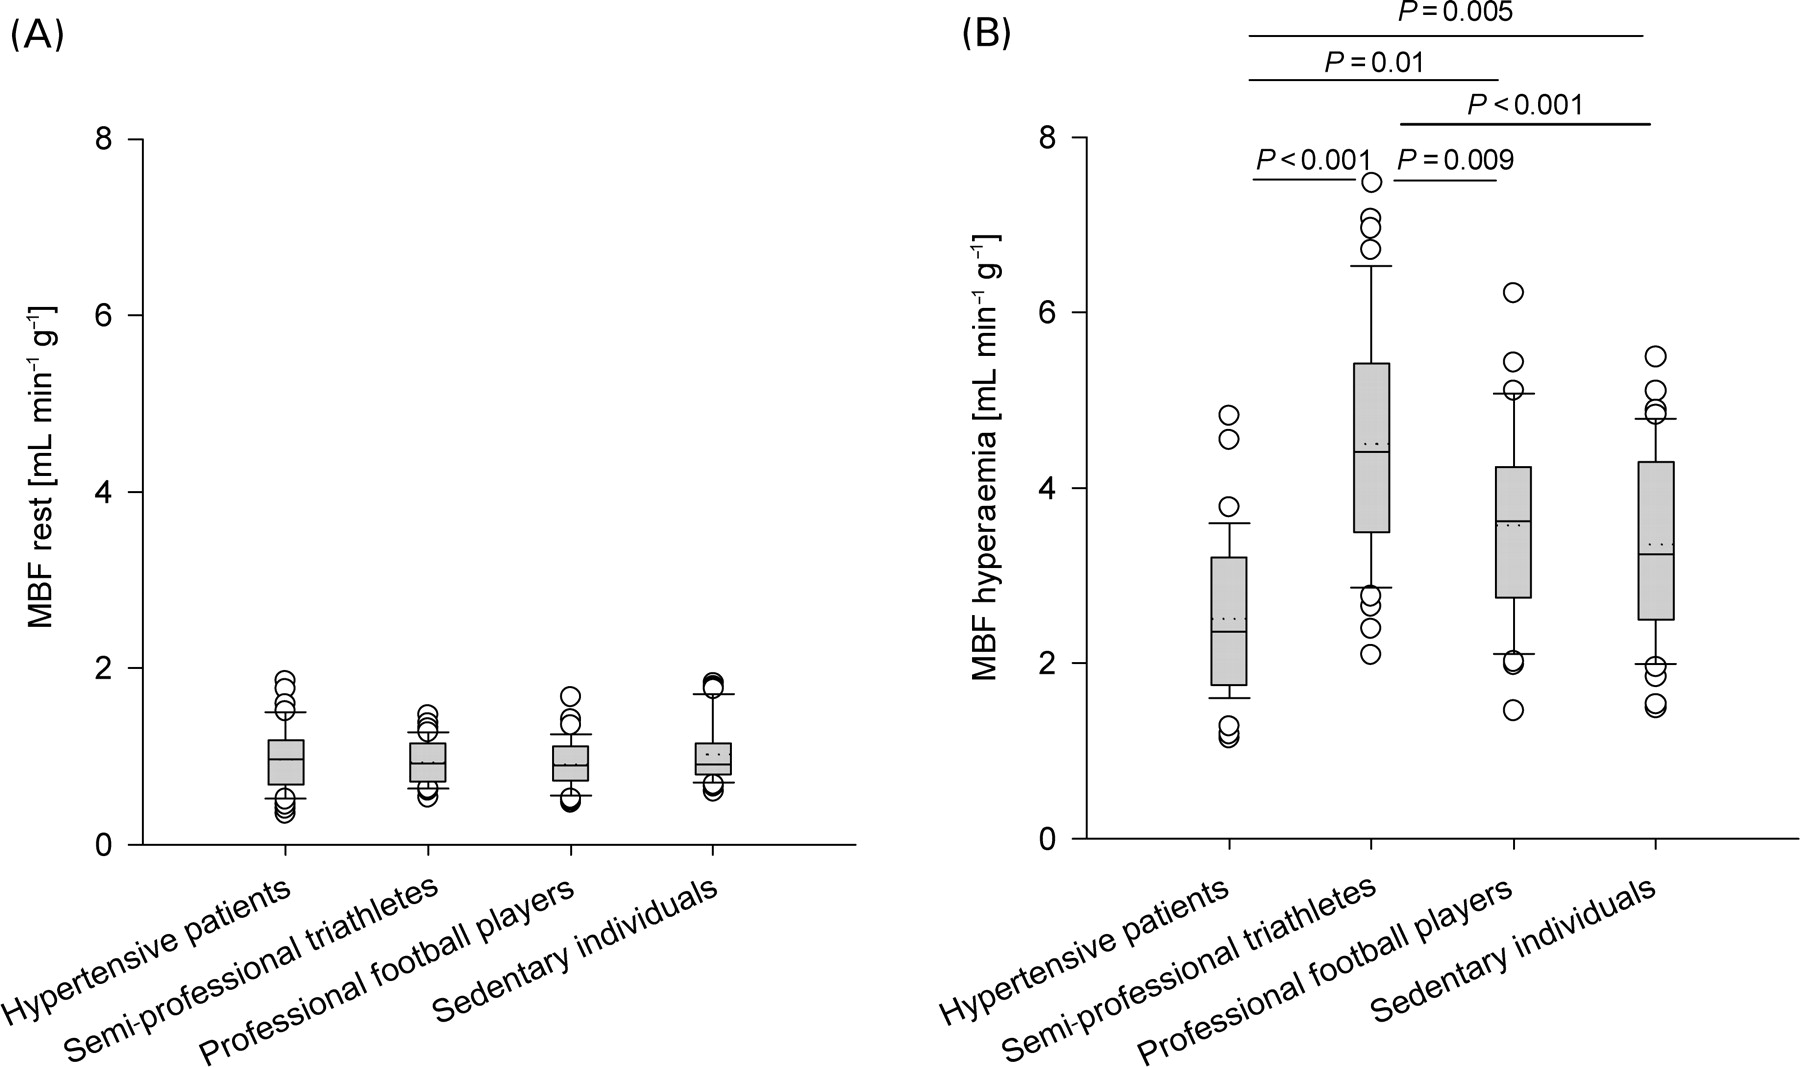
Analysis was feasible in 160 of 180 investigated segments and success rate of mid-septal, mid-lateral, and mid-inferior regions was 100, 67, and 100%, respectively. MBF at rest (Figure 1A) was not different among the groups (hypertensive patients 0.97±0.27 mL min−1 g−1, triathletes 0.95±0.21 mL min−1 g−1, football players 0.90±0.22 mL min−1 g−1, and sedentary individuals 1.04±0.27 mL min−1 g−1). In contrast, MBF during hyperaemia (Figure 1B) was lower in hypertensive patients (2.55±0.70 mL min−1 g−1) than in triathletes (4.53±1.05 mL min−1 g−1, P<0.001), football players (3.53±0.085 mL min−1 g−1, P<0.01), and sedentary individuals (3.38±0.86 mL min−1 g−1, P=0.005). Consequently, MBFR was lower in hypertensive patients (2.75±0.32) than in triathletes (4.96±1.17; P<0.001) and football players (4.20±1.19; P<0.001), but not significantly different compared with the sedentary individuals (3.38±0.70; P=0.14). In triathletes, MBFR was higher than in sedentary individuals (P<0.001) but not comparable with football players (P=0.111).
MBF (mL min−1 g−1) at rest (A) and during adenosine-induced hyperaemia (B) in hypertensive patients with LVH (n=15), semi-professional triathletes with LVH (n=15), professional football players (n=15), and sedentary individuals (n=15). Boxplot shows each outlier as an open circle.
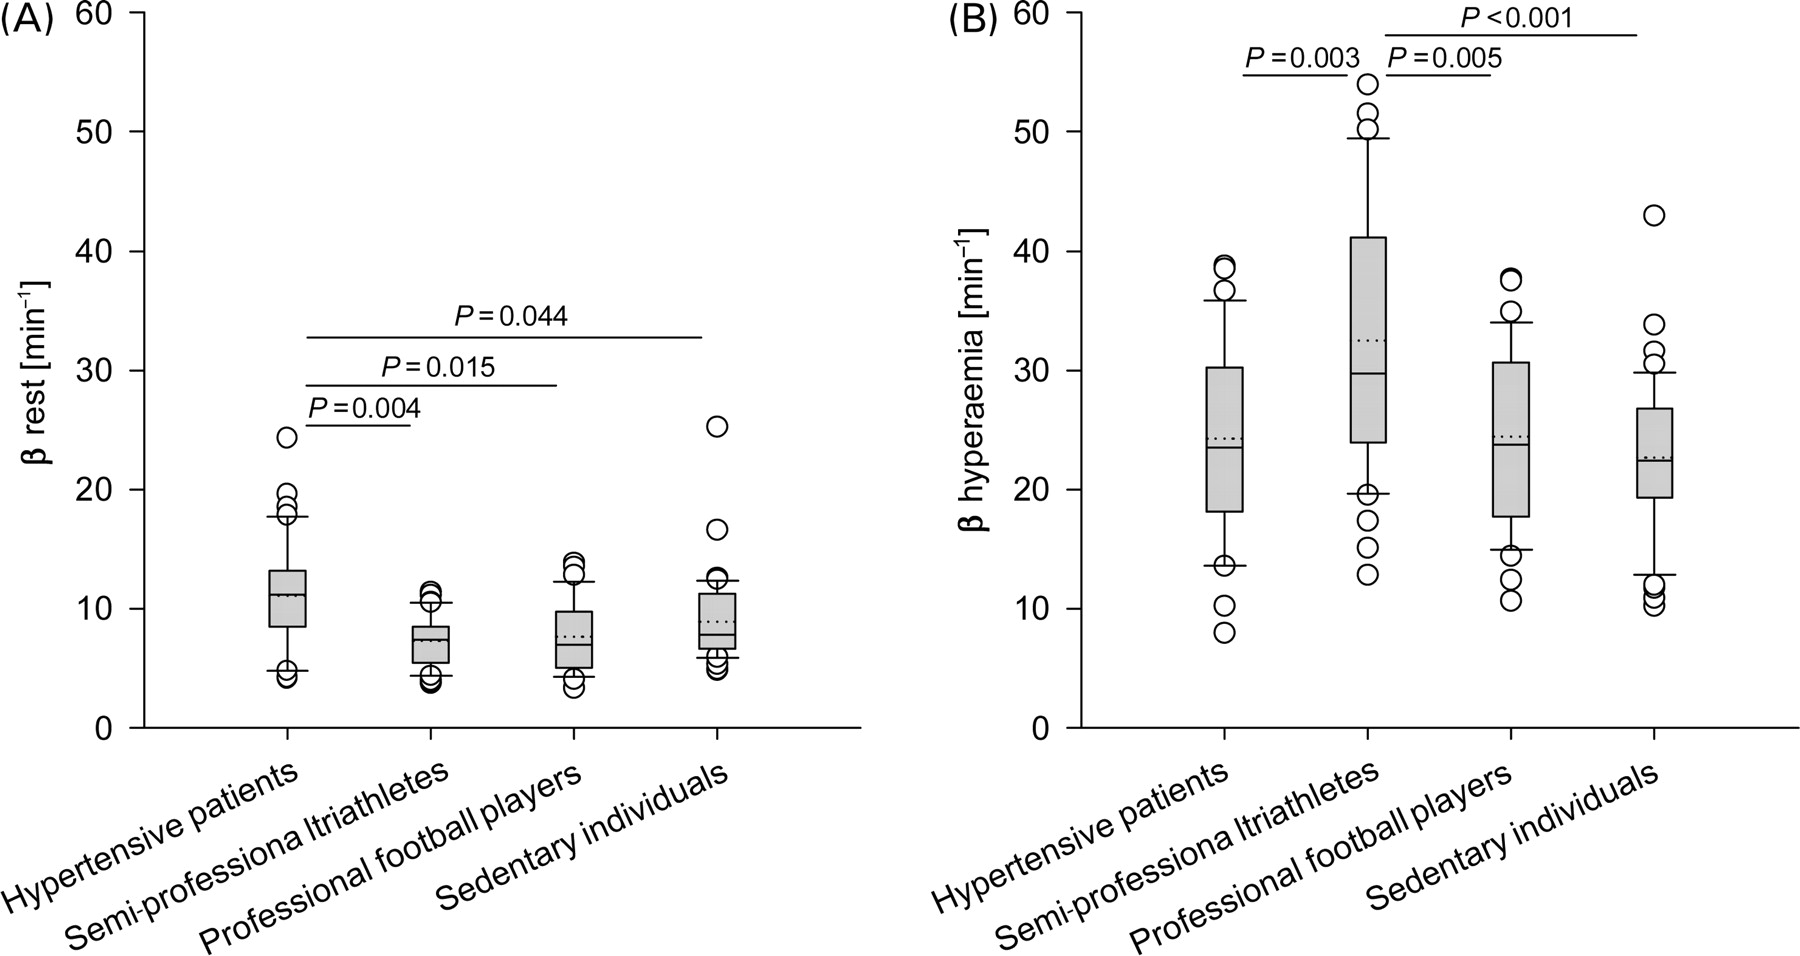
The exchange frequency (β) at rest (Figure 2A) was higher in hypertensive patients (11.3±3.8 min−1) than in triathletes (7.4±1.8 min−1), football players (7.7±2.3 min−1), and sedentary individuals (9.0±2.5 min−1). During hyperaemia (Figure 2B), the exchange frequency (β) in hypertensive patients, triathletes, football players, and sedentary individuals were 24.6±6.4, 32.9±7.5, 24.3±5.1, and 22.7±5.1 min−1, respectively. Triathletes had a higher exchange frequency (β) during hyperaemia compared with the other groups. Exchange frequency (β) of hypertensive patients, triathletes, football players, and sedentary individuals increased significantly from rest to stress by a factor of 2.28±0.57, 4.58±0.98, 3.37±0.98, and 2.64±0.69, respectively. Accuracy of the resting exchange frequency (β) was poor for the distinction between hypertensive heart disease and athlete's heart (best cut-off 8.15 min−1, sensitivity 73%, specificity 80%, area under the curve 0.83, positive predictive value 79%, negative predictive value 75%), respectively, sedentary individuals (best cut-off 10.0 min−1, sensitivity 53%, specificity 73%, area under the curve 0.68, positive predictive value 67%, negative predictive value 61%).

Exchange frequency (β, min−1) at rest (A) and during adenosine-induced hyperaemia (B). Boxplot shows each outlier as an open circle.
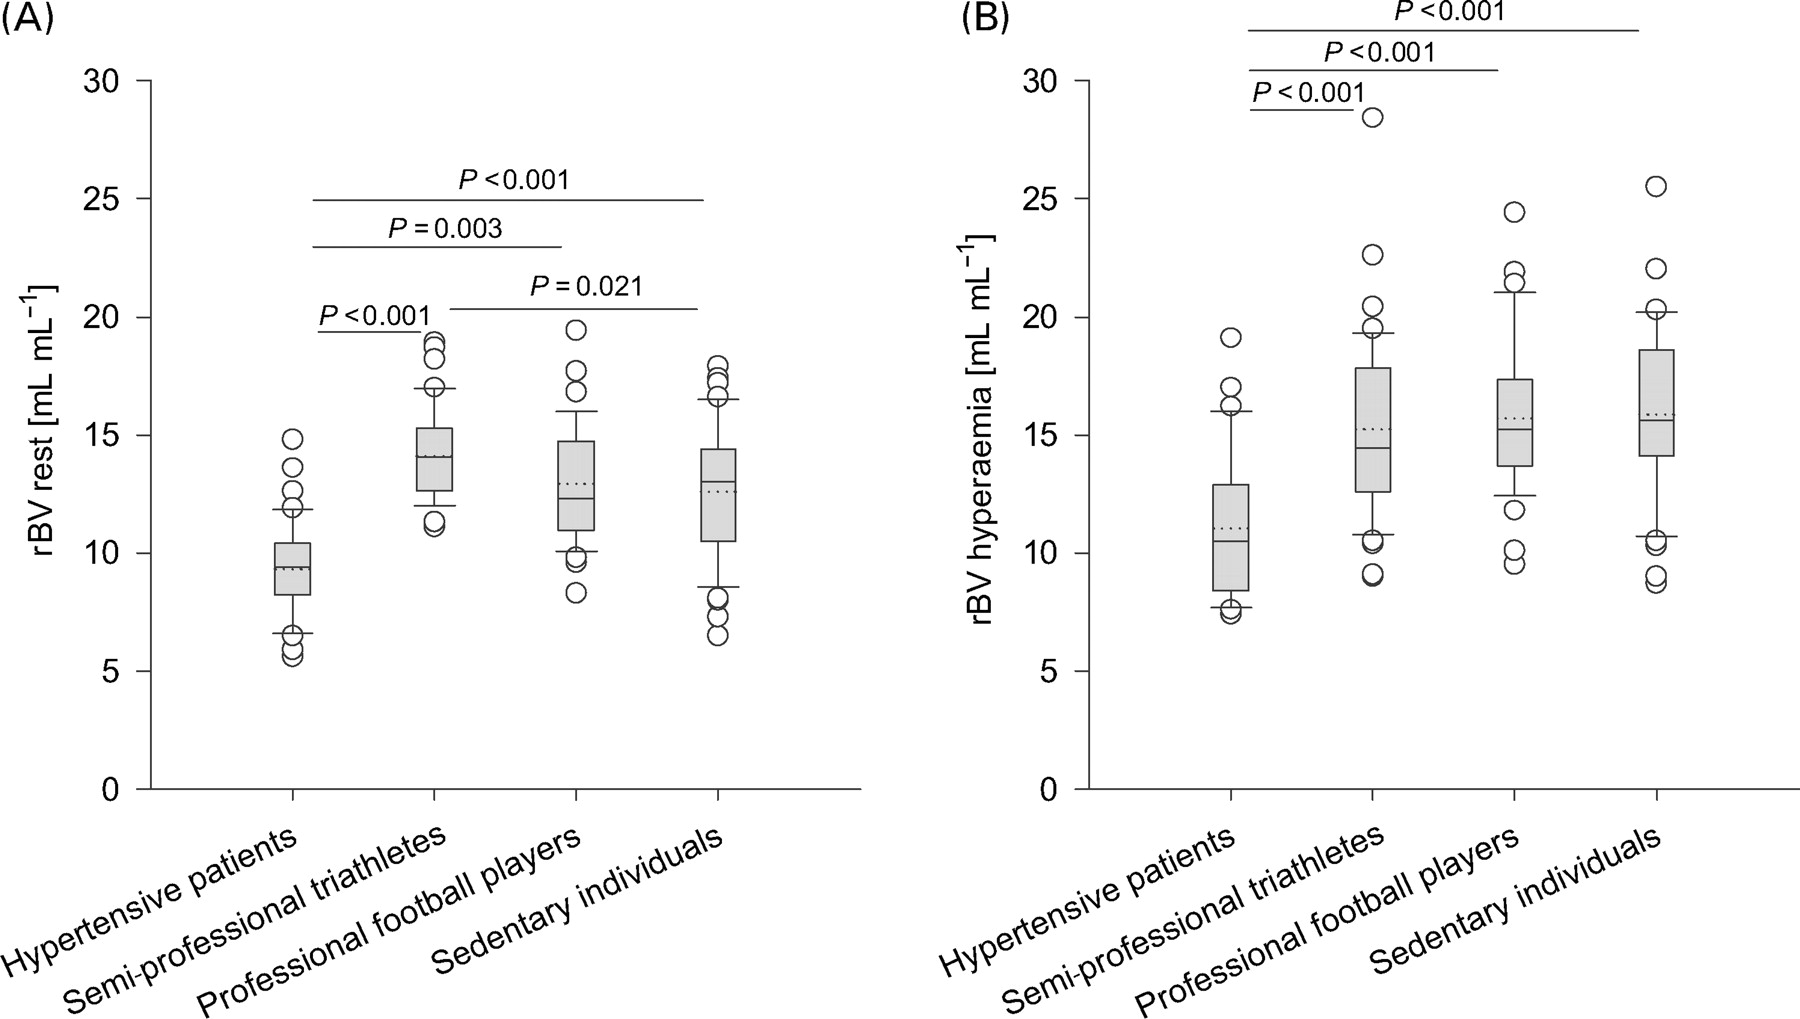
At rest (Figure 3A), rBV was lower in hypertensive patients (0.093±0.013 mL mL−1) than in triathletes (0.141±0.012 mL mL−1), football players (0.129±0.014 mL mL−1), and sedentary individuals (0.126±0.018 mL mL−1). During hyperaemia (Figure 3B), rBV was lower in hypertensive patients (0.111±0.021 mL mL−1) compared to triathletes (0.151±0.026 mL mL−1), and football players (0.157±0.026 mL mL−1) but not compared with sedentary individuals (0.159±0.017 mL mL−1, P<0.06). In all groups except triathletes, rBV increased significantly from rest to stress by a factor of 1.21±0.25 in hypertensive patients, 1.07±0.18 in triathletes, 1.22±0.20 in football players, and 1.28±0.17 in sedentary individuals. At rest, an rBV of 0.114 mL mL−1 distinguished hypertensive patients and triathletes with a sensitivity of 93% and a specificity of 100% (area under the curve 0.99, positive predictive value 100%, negative predictive value 94%); an rBV of 0.107 mL mL−1 distinguished hypertensive patients and sedentary individuals with a sensitivity 93% and a specificity of 87% (area under the curve 0.94, positive predictive value 88%, negative predictive value 93%).

rBV (%) at rest (A) and during adenosine-induced hyperaemia (B). Boxplot shows each outlier as an open circle.
A positive linear relationship with modest correlation was found between MBFR and maximal oxygen uptake (y=0.050x+1.476, r2=0.33, P<0.001), the maximal workload achieved in Watt per kilogram (y=0.007x+1.574, r2=0.305, P<0.001).
Discussion
This study investigated the myocardial microvascularisation by quantification of rBV, i.e. the regional blood volume relative to the surrounding tissue. Hypertensive patients had reduced rBV, which was compensated by increased exchange frequency (β) of this volume and consequently, MBF at rest was normal. Thus, pathologic LVH in hypertensive patients is accurately and non-invasively distinguishable from physiologic LVH in an athlete's heart using MCE.
Hypertensive heart disease
Patients with hypertension-induced LVH may suffer from myocardial ischaemia, ventricular dysfunction, causing congestive heart failure and lethal arrhythmias.2,5 Structural abnormalities of the heart such as reduced myocardial capillary density, inadequately sized epicardial coronary arteries, as well as periarteriolar and ventricular fibrosis have been identified,8 and lead to reduced MBFR. However, impaired MBFR may either be due to coronary artery stenosis or microvascular disease. MBF can be measured non-invasively by positron emission tomography and lately by MCE,20 which provides additional information on the microcirculation, i.e. the rBV and its exchange frequency (β). We found that MBF at rest was similar in hypertensive patients compared with the other groups, a finding, which is in line with the recent PET studies.10,21,22
Capillary density can be estimated by rBV as 90% of myocardial blood volume resides at this level of the circulation.23 The reduced rBV in our hypertensive patients therefore reflects inadequate growth of capillaries, which may be explained by constant mechanical stress favouring collagen deposition whereas intermittent exercise in athletes leaves the heart enough time to adapt physiologically. In contrast, Di Bello et al.24 found no difference in peak signal intensity, a surrogate measure for rBV, and in the exchange frequency between patients with hypertensive heart disease and controls. However, to equate rBV with peak signal intensity is not entirely correct because the latter depends on variations in contrast agent concentration and different acoustic properties in patients, and therefore, corresponds only loosely to rBV. The fact that they found no difference in exchange frequency (β) may be explained by their use of intermittent imaging, which prolongs the intervals of contrast agent destruction.
We found in our study, that MBFR in all groups was predominantly governed by an increase of exchange frequency (β) and only to a smaller extent by an increase of rBV (e.g. increase in hypertensive patients: exchange frequency (β) 2.28-fold, rBV 1.21-fold). In hypertensive patients, the reserve in exchange frequency (β) was lower due to the increased exchange frequency (β) at rest, therefore MBFR was reduced compared with triathletes and football players. Hamasaki et al.9 showed with intracoronary Doppler reduced coronary flow reserve in patients with hypertensive heart disease compared to controls. This may be explained by them having included older and symptomatic patients referred for cardiac catheterization. Unlike them, we did not include patients with cardiovascular risk factors other than hypertension. In our hypertensive patients, rBV more accurately detected microvascular dysfunction than MBFR, which was still normal.
Athlete's heart
In athlete's heart, on the contrary, training-induced LVH is believed to be benign and physical fitness has been shown to reduce the all-cause mortality.4 Cardiac function such as MBFR is supernormal. Therefore, it was assumed that myocytes as well as the surrounding vasculature grew in proportion. Nevertheless, this interpretation remained hypothetical as myocardial biopsies are not available due to ethical reasons. In this respect, rBV allows non-invasive assessment of the degree of vascularisation and its functional response to vasodilators. In triathletes, rBV at rest (0.141±0.012 mL mL−1) was higher than in hypertensive patients (0.093±0.013 mL mL−1) but also in comparison to sedentary individuals (0.126±0.018 mL mL−1) without LVH. White et al.25 showed with morphometry in a porcine model that exercise training increased total cross-sectional vascular bed area by 37% after 16 weeks. Thus, our results add to the idea of a myocardial vasculature growth out of proportion in endurance exercise-induced LVH as compared to controls, to meet the increased metabolic demands. This is in accordance with the theoretically described and practically confirmed power-law relationship between the epicardial coronary artery cross-sectional area and the dependent, downstream myocardial mass.19
Apart from our current results, two studies examined MBF and MBFR in athlete's heart with conflicting results. Using positron emission tomography, Takala et al.26 found in nine athletes that MBF at rest was 33% lower than in controls and speculated that energy metabolism would be more efficient, however, the small number suggests a random finding. In contradiction, Toraa et al.17 found no such difference, neither did we in the present study. MBFR of our triathletes (5.0±1.6) was in the same range as in these studies.17,18 The higher value (6.1±1.9) in the study by Toraa et al. may be explained by the higher LV mass index, reflecting a higher fitness level compared with our triathletes.
As expected, the high MBFR in triathletes, the subjects with the most intense aerobic endurance training, was due to an extreme increase in exchange frequency (β, 4.55-fold), and only little was contributed by an increase in rBV (1.11-fold). Adenosine relaxes smooth muscle cells of resistance vessels, and thereby decreases the resistance to flow. Therefore, it can be speculated that the increase in exchange frequency (β) inversely correlates with resistance to flow. In dogs, it has been shown that exercise training increases resistance vessels' sensitivity and maximal responsiveness to adenosine.27–29
Comparison with other techniques
So far, no other imaging technique has been validated for the measurement of rBV in humans. Magnetic resonance imaging uses the detection of longitudinal relaxation changes (T1) during the inflow of arterial blood and corrects for an assumed ratio of haematocrit in capillaries and the ventricle.30,31 The use of such a correction factor restricts the quantitation of MBF and rBV. Also the BOLD (blood oxygenation level-dependent) method only provides a qualitative measurement of rBV changes.32 Attempts have been made to calculate rBV by electron-beam computed tomography using signal intensity curves. rBV was determined indirectly by measuring perfusion, and using a model with recruitable and non-recruitable blood volumes with coefficients that needed to be determined experimentally.33 This method further suffers from the dissolution of tracers into the extravascular space, which distorts signal intensity curves. Finally, its use has to be restricted due to the radiation exposure (especially in followup-studies). Wu et al.34 calculated myocardial blood volume in dogs by dividing MBF derived from radio-labeled microspheres with exchange frequency derived from MCE. Thus, two techniques were used non-simultaneously to calculate myocardial blood volume.
Yano et al.35 estimated myocardial blood volume to be 4.0±2.2 and 0.6±0.3% in normal and akinetic myocardium, respectively. This low values most likely arose from their signal decompression, as they divided the negative exponent by 10 instead of 20. Moreover, they used intermittent imaging with a pulsing interval of four heartbeats, which might be too short to allow steady state capillary filling. Instead, we demonstrated by real-time MCE in a flow phantom with known intrvascular volume that rBV equals the ratio of decompressed (division with factor 20 in the exponent) signal intensities in the myocardium and adjacent LV after background correction.20
Limitations
According to the matching criteria, young patients (33±9 years) with long-standing hypertension were included, and consequently all of them were on antihypertensive therapy. The influences of antihypertensive drugs on MBF and coronary vasodilatator reserve were examined only in a small number of studies, which mainly found that angiotensin-converting enzyme inhibitors improved coronary vasodilatator reserve.36,37 However, the effects on the rBV are unknown, but this parameter might serve as a new endpoint for the assessment of changes in myocardial structure.
Although we studied young asymptomatic patients, coronary angiography was not performed, and thus, it cannot be excluded that the presence of early-stage atherosclerosis may have biased our results. However, relevant coronary atherosclerosis is unlikely given the fact that cardiovascular risk factors other than hypertension were absent and MBFR was normal in 32 of 39 analysable coronary artery territories.
MCE with its purely intravascular tracer has to be considered as the reference method for the in vivo measurement of rBV in humans. However, a comparison to another technique is still lacking and in this respect, measurements based on myocardial biopsies need to be interpreted carefully because filling of the vasculature is affected by the fixation process and therefore does not correspond to the one in vivo.
Conclusion
Myocardial microvascularisation, i.e. rBV, measured by MCE accurately differentiates between LVH in hypertensive patients and athletes, respectively. Potential future clinical applications of rBV could be the non-invasive differentiation of reduced MBFR in coronary artery disease and microvascular disease; controlling the reversibility of hypertensive heart disease under antihypertensive treatment; and the monitoring of clinical trials promoting myocardial angiogenesis. This parameter might be as well useful for the distinction between athlete's heart and hypertrophic cardiomyopathy because myocardial biopsies have indicated that arteriolar and capillary density are even more reduced in hypertrophic cardiomyopathy than in hypertensive heart disease.8
Acknowledgement
This work was supported by grants from the Swiss National Science Foundation (No 32-58945.99, C.S.) and the Swiss Heart Foundation.
Conflict of interest: none declared.
References
Author notes
The first two authors contributed equally to this work.

