


Abstract
The hypothesis of ‘metabolically healthy obesity’ implies that, in the absence of metabolic dysfunction, individuals with excess adiposity are not at greater cardiovascular risk. We tested this hypothesis in a large pan-European prospective study.
We conducted a case-cohort analysis in the 520 000-person European Prospective Investigation into Cancer and Nutrition study (‘EPIC-CVD’). During a median follow-up of 12.2 years, we recorded 7637 incident coronary heart disease (CHD) cases. Using cut-offs recommended by guidelines, we defined obesity and overweight using body mass index (BMI), and metabolic dysfunction (‘unhealthy’) as ≥ 3 of elevated blood pressure, hypertriglyceridaemia, low HDL-cholesterol, hyperglycaemia, and elevated waist circumference. We calculated hazard ratios (HRs) and 95% confidence intervals (95% CI) within each country using Prentice-weighted Cox proportional hazard regressions, accounting for age, sex, centre, education, smoking, diet, and physical activity. Compared with metabolically healthy normal weight people (reference), HRs were 2.15 (95% CI: 1.79; 2.57) for unhealthy normal weight, 2.33 (1.97; 2.76) for unhealthy overweight, and 2.54 (2.21; 2.92) for unhealthy obese people. Compared with the reference group, HRs were 1.26 (1.14; 1.40) and 1.28 (1.03; 1.58) for metabolically healthy overweight and obese people, respectively. These results were robust to various sensitivity analyses.
Irrespective of BMI, metabolically unhealthy individuals had higher CHD risk than their healthy counterparts. Conversely, irrespective of metabolic health, overweight and obese people had higher CHD risk than lean people. These findings challenge the concept of ‘metabolically healthy obesity’, encouraging population-wide strategies to tackle obesity.
Introduction
Overall and abdominal obesity, commonly measured by body mass index (BMI) and waist circumference (WC), are important risk factors for coronary heart disease (CHD).1–3 The effects of obesity on CHD are thought to be largely mediated by other cardiometabolic risk factors such as insulin resistance, atherogenic dyslipidaemia, and type 2 diabetes.4 However, many obese people have few or no elevated metabolic risk factors included in the definition of the Metabolic Syndrome (MetS),5 suggesting that there may be a group of obese people—the ‘metabolically healthy obese’—who are not at higher cardiovascular risk.6 There is no consensus on the criteria to define this subtype, and an estimated 3–57% of obese individuals are considered ‘metabolically healthy obese’ depending on the population under study and the definition used.7 There has been conflicting evidence on whether ‘metabolically healthy obese’ people are at higher risk of cardiovascular disease (CVD) or type 2 diabetes,8–17 with recent meta-analyses challenging the concept of the ‘metabolically healthy obesity’ by showing higher cardiovascular risk among obese individuals with no MetS.14 , 15 , 17 , 18 The existence of ‘metabolically healthy obesity’ has also been questioned by the latest European Society of Cardiology (ESC) guidelines for CVD prevention.19 However, previous studies have been limited by incomplete adjustment for potentially important confounders (such as physical activity and smoking), short duration of follow-up (and hence small numbers of incident CHD events) and use of composite outcomes, such as all-cause mortality. More powerful and detailed studies with precisely defined outcomes are therefore needed to clarify the association with CHD risk, since heterogeneous effects of obesity according to metabolic health could have important implications for risk prevention strategies.
To address this, we analysed 7637 incident CHD cases recorded during 12.2 years of follow-up from the European Prospective Investigation into Cancer and Nutrition cardiovascular disease (EPIC-CVD) case-cohort study. Our primary aim was to examine the separate and combined associations of obesity and metabolic health with CHD.
Methods
Study population
EPIC-CVD is a prospective case-cohort study nested within the European Prospective Investigation into Cancer and Nutrition (EPIC) study. Briefly, EPIC includes 366 521 women and 153 457 men, mostly aged 35 to 70 years old at baseline, recruited between 1991 and 1999 at 23 centres across 10 European countries: Denmark, France, Germany, Greece, Italy, the Netherlands, Norway, Spain, Sweden, and the UK. Adults were invited from the local general population except in the French centre (women in a national health insurance plan), some Italian and Spanish centres (recruited through local blood donor associations), Utrecht (The Netherlands), and Florence (Italy) (women invited for population-based breast cancer screening programmes), and Oxford (UK) (specifically recruited a substantial proportion of vegetarians). At baseline, participants gave a blood sample and completed questionnaires on diet, lifestyle, and medical history. Detailed baseline characteristics of the EPIC cohort have been previously described.20
A case-cohort study nested in a large prospective cohort is similar to a nested case–control study with the difference that a random subcohort is selected for use as a reference group, rather than matched controls. This design is efficient as it does not require all study participants to have exposure measurement and has the advantages of a longitudinal cohort study with prospective assessment of key exposures that are not subject to recall bias. Unlike the nested case-control design, it allows risk to be measured at any time until the end of follow-up and permits time-to-event analysis.21 A representative random subcohort of 18 249 participants (62% women), stratified by centre, was selected for the EPIC-CVD project, constituting a case-cohort design. After exclusion of 609 participants with a prior history of myocardial infarction or stroke at baseline, 17 640 subcohort members remained. In total in the EPIC study, 13 964 incident CHD cases developed during follow-up, of whom 631 belong to the subcohort. Ethical review boards of the International Agency for Research on Cancer and all local institutions where participants had been recruited gave approval for the original EPIC study, and all participants gave written informed consent.
Blood pressure measurements were not available for the centres in Norway, Asturias, or Navarra, and WC was not recorded in Norway and Umea.22 These centres were excluded from the analyses, as well as the French centre due to the limited number of incident CHD events (n = 41). Further exclusions were performed based on missing exposure and covariate data, described below. All analyses were performed in a sample restricted to participants with no missing data (complete-case analysis). Because exclusions due to missing data may result in a selected sample, we also used a multiple imputation approach as a sensitivity analysis to compare the results with the complete-case approach. A schematic representation of the EPIC-CVD case-cohort design and sample selection is given in Supplementary material online, Figure S1.
Definitions of obesity and metabolic disorders
Trained health professionals measured blood pressure (BP),23 weight, height, and waist circumference (WC),24 except in the France and Oxford centres where body size measurements were self-reported.25 BMI was calculated as weight (kg) divided by the square of height (m2). Obesity was defined according to the World Health Organization26 as BMI ≥ 30 kg/m2, overweight as 25 ≤ BMI < 30 kg/m2, and normal weight as 18.5 ≤ BMI < 25 kg/m2. Underweight (BMI < 18.5) participants were excluded due to the limited number (n = 264, less than 1% of the subcohort).
Total cholesterol, HDL-cholesterol, triglycerides, and glucose were measured in baseline serum samples on a Roche auto-analyser (Roche diagnostics, USA) and HbA1c was measured in the erythrocyte fraction using the Tosoh-G8 HPLC analyser (Tosoh Bioscience, Japan) at Stichting Huisartsen Laboratorium (Etten-Leur, Netherlands). Fasting status was available for 87% of participants. Metabolic Syndrome (MetS) was defined according to the 2009 Joint Interim Statement of the International Diabetes Federation Task Force on Epidemiology and Prevention; National Heart, Lung, and Blood Institute; American Heart Association; World Heart Federation; International Atherosclerosis Society; and International Association for the Study of Obesity5 as having three or more of the following metabolic abnormalities: (i) elevated BP, defined as systolic BP ≥ 130 and/or diastolic BP ≥ 85 mmHg and/or use of antihypertensive medication at baseline and/or self-reported history of hypertension; (ii) hypertriglyceridaemia, defined as triglycerides ≥1.7 mmol/L (150 mg/dL) or current use of lipid-lowering medication at baseline; (iii) low HDL-cholesterol, defined as <1.0 mmol/L (40 mg/dL) for men and <1.3 mmol/L (50 mg/dL) for women; (iv) hyperglycaemia, defined as fasting blood glucose ≥5.6 mmol/L (100 mg/dL) or non-fasting blood glucose ≥7.8 mmol/L (140 mg/dL, with fasting defined as ≥3 h between last meal and blood draw27) and/or current use of antidiabetic medication at baseline and/or self-reported history of diabetes; or (v) elevated waist circumference, defined as WC ≥ 94 cm for men and WC ≥ 80 cm for women. Where information on fasting status was not available (23% of participants), the non-fasting cut-off was used for glucose. Diabetes was defined as a self-reported history and/or HbA1c ≥ 6.5%.
Covariate definition
Validated questionnaires were used to obtain information on education, smoking habits, dietary intake (including alcohol intake), and physical activity at study baseline. The Cambridge Index of physical activity was derived by combining occupational with recreational activity level to produce four groups: active, moderately active, moderately inactive and inactive.28 Usual diet over the previous 12 months was assessed using validated country/centre-specific dietary questionnaires,24 allowing the calculation of food group, individual energy and nutrient intakes (derived from the EPIC nutrient database29). To summarize diet quality for adjustment purposes, we computed a Mediterranean diet score, ranging from 0 to 18, with greater scores given to higher intakes of fruit, vegetables, legumes, nuts, grains, and fish, lower intakes of red meat and dairy, and moderate intake of alcohol.30
Outcome ascertainment
Incident CHD cases were defined as first CHD events, whether non-fatal or fatal, consisting of ICD-10 codes I20–I25, which include myocardial infarction, other acute ischaemic heart diseases, chronic ischaemic heart disease and angina pectoris.31 EPIC centres used methods including self-report, linkage to primary and secondary care registers, hospital admissions, and mortality data to ascertain events. Non-fatal CHD events were further validated by additional review of individual medical records and/or linkage with registries with validation rates ranging from 82 to 100%,32 while fatal CHD events were generally ascertained through mortality registries. End of follow-up for CHD events varied between centres and ranged between 2003 and 2010. Participants known to have left the country were considered lost to follow-up and censored at their date of last follow-up.
Statistical analyses
Characteristics of participants in the subcohort were described across body size phenotypes and compared using ANCOVA, giving adjusted least square means and percentages (and confidence interval) across the six phenotypes. Adjustments were made for centre, sex, age, education, smoking status, and energy intake (for description of dietary intake only).
To assess the association of adiposity markers and metabolically-defined body size phenotypes with incident CHD, we used Prentice-weighted Cox proportional hazards models with robust standard errors to account for the case-cohort design.21 Age was the underlying time scale, with entry time defined as the participant’s age at recruitment and exit time as age at first fatal or non-fatal CHD event or censoring (whichever came first). For all analyses, we stratified the models by sex and centre. To account for the multi-country design, we followed a two-stage approach where models were fitted separately within country and then country-specific HRs were combined using multivariate random-effects meta-analysis.33
To assess the shape of associations of BMI and WC with CHD risk, country-specific HRs were calculated by comparing quintiles (defined using all participants) of baseline adiposity values with the lowest quintile. The pooled hazard ratios were then plotted against mean values of the adiposity measure within each quintile, accompanied by a group-specific confidence interval derived only from the variance of the log risk in that category (including the reference quintile).34 As associations were approximately log-linear, we calculated HRs associated with 1 standard deviation (SD) higher baseline value (4.10 kg/m2 for BMI, 12.7 cm for WC). Heterogeneity between countries was quantified using the I2 statistic.35
For analyses of adiposity measures, Model 0 was adjusted for baseline age and smoking status (never, former, current). Model 1 was further adjusted for highest educational level (no schooling/primary, secondary, vocational/university), physical activity, Mediterranean diet score, energy and alcohol intake. Model 2 was further adjusted for the different body size markers, i.e. WC for BMI and BMI for WC. In Model 3, to explore biological pathways potentially underlying the associations, we adjusted for baseline age, smoking status, and intermediate cardiovascular risk factors: blood cholesterol (total and HDL), systolic blood pressure, and diabetes. Interactions on the multiplicative scale between BMI and WC and between BMI and MetS were formally tested.
For analyses of metabolically-defined body size phenotypes, Model A was adjusted for baseline age, smoking status (never, former, current) and highest educational level (no schooling/primary, secondary, vocational/university). To investigate the potential mediating effect of lifestyle habits36 , 37 on the association between metabolically-defined body size phenotypes and CHD risk, we compared Model A to Model B, which further included adjustment for physical activity (Cambridge index: inactive, moderately inactive, moderately active, active), alcohol consumption (g ethanol/day), Mediterranean diet score and energy intake (kcal/day).
The primary complete-case analyses included only participants with non-missing data on anthropometric measurements, blood pressure, blood biomarkers and all covariates, with sensitivity analyses that maximized the number of participants by only excluding those with missing data on the covariates in each analysis model. Additional sensitivity analyses performed were: (i) excluding the first 2 years of follow-up to minimize the potential for reverse causality; (ii) including only ‘hard’ CHD events, i.e. myocardial infarction and coronary death; (iii) including only events validated with a high level of certainty; (iv) restricting analyses to ‘never smokers’ only, to apply more rigid control for smoking; (v) separately for men and women to investigate potential differences by sex. For comparability with other studies, we also performed sensitivity analyses with different definitions of obesity or metabolic health: (vi) excluding the WC criterion from the definition of MetS, modifying the definition of metabolically healthy to be <2 abnormalities;17 , 38 (vii) defining metabolically healthy participants as having none of four possible abnormalities (elevated blood pressure, triglyceridaemia, hyperglycaemia, low HDL-cholesterol); (viii) using abdominal obesity index defined as WC ≥ 102 cm for men and WC ≥ 88 cm for women. For the latter, a model (Model C) was fitted including BMI as a continuous covariate. Finally, (ix) we used a multiple imputation approach to impute the missing values for the non-systematically missing variables (i.e. after exclusion of the centres with no data on blood pressure or waist circumference). Five imputed datasets were generated and estimates were combined using Rubin’s rules.
All analyses were performed with SAS 9.3 (SAS Institute, Cary, NC, USA) and STATA MP 13.1. We summarize the key aspects of the modelling strategy in Supplementary material online, Figure S2.
Results
After exclusions, there were 10 474 subcohort participants and 7637 incident CHD cases (394 of whom are also in the subcohort) comprising a total of 17 733 participants who contributed 117 829 person-years at risk in the complete-case analysis. 63% of subcohort participants were female and the mean (SD) age and BMI were 53.6 (9.3) years and 26.1 (4.1) kg/m2 respectively (Table 1). Median follow-up was 12.2 years (interquartile range: 9.7–13.6). 15.8% of subcohort participants were obese, 25.6% had MetS, whilst 45.2% of obese participants were ‘metabolically healthy’. Metabolically healthy obese participants were younger and had lower BMI than obese participants with MetS (P < 0.0001). The metabolically healthy obese had worse metabolic parameters (higher lipid levels, blood pressure, HbA1c, C-reactive protein), had higher red meat intake, were less likely to be current smokers, more likely to be inactive and less educated than metabolically healthy normal weight participants (all P < 0.0001, Table 1). The proportion of obese participants ranged from 11% in the UK to 30% in Greece and the proportion of obese participants who were metabolically healthy ranged from 31.7% in Germany to 57.9% in Spain (see Supplementary material online, Table S1).
Baseline characteristicsa of subcohort participants across metabolically defined body size phenotypes
| Metabolically healthy normal weight | Metabolically unhealthy normal weight | Metabolically healthy overweight | Metabolically unhealthy overweight | Metabolically healthy obese | Metabolically unhealthy obese | P healthy vs. unhealthy obeseb | P healthy obese vs. normal weightb | Unadjusted meanc | |
|---|---|---|---|---|---|---|---|---|---|
| N | 4282 | 368 | 2761 | 1403 | 751 | 909 | |||
| Women (%) | 69 (67, 71) | 69 (64, 73) | 55 (53, 57) | 51 (48, 53) | 64 (61, 67) | 59 (56, 62) | 0.01 | 0.01 | 63 |
| Age (years) | 50.8 (50.6, 51.1) | 55.5 (54.7, 56.3) | 52.3 (51.9, 52.6) | 54.8 (54.4, 55.3) | 52.8 (52.2, 53.4) | 54.4 (53.9, 54.9) | <0.0001 | <0.0001 | 53.6 (9.3) |
| BMI (kg/m2) | 22.7 (22.6, 22.7) | 23.5 (23.3, 23.7) | 26.9 (26.9, 27.0) | 27.5 (27.4, 27.6) | 32.6 (32.5, 32.8) | 33.3 (33.2, 33.5) | <0.0001 | NR | 26.1 (4.1) |
| WC (cm)d | 79.9 (79.7, 80.1) | 85.5 (84.9, 86.2) | 88.9 (88.7, 89.2) | 93.1 (92.8, 93.5) | 101.2 (100.8, 101.7) | 105.2 (104.7, 105.6) | NR | NR | 86.3 (12.6) |
| Glucose (mmol/L)d , e | 4.78 (4.73, 4.83) | 5.39 (5.24, 5.54) | 4.80 (4.75, 4.86) | 5.39 (5.31, 5.47) | 4.83 (4.72, 4.93) | 5.84 (5.74, 5.94) | NR | 0.40 | 5.04 (1.59) |
| HbA1c (%) | 5.45 (5.43, 5.47) | 5.62 (5.56, 5.68) | 5.47 (5.45, 5.50) | 5.69 (5.66, 5.72) | 5.57 (5.52, 5.61) | 5.96 (5.92, 6.00) | <0.0001 | <0.0001 | 5.5 (0.6) |
| SBP (mmHg)d | 127.7 (127.1, 128.3) | 137.6 (135.8, 139.3) | 131.5 (130.8, 132.2) | 139.0 (138.1, 139.9) | 135.5 (134.2, 136.7) | 143.2 (142.0, 144.3) | NR | <0.0001 | 132.9 (19.7) |
| DBP (mm Hg)d | 78.9 (78.5, 79.2) | 84.0 (83.0, 85.0) | 81.6 (81.2, 81.9) | 85.5 (84.9, 86.0) | 84.4 (83.7, 85.1) | 87.9 (87.2, 88.6) | NR | <0.0001 | 82 (10.7) |
| HDL, chol (mmol/L)d, e | 1.60 (1.58, 1.61) | 1.17 (1.13, 1.20) | 1.48 (1.47, 1.50) | 1.15 (1.13, 1.16) | 1.46 (1.43, 1.48) | 1.10 (1.08, 1.13) | NR | <0.0001 | 1.48 (0.42) |
| Total chol (mmol/L)e | 5.82 (5.78, 5.86) | 6.35 (6.24, 6.46) | 5.99 (5.95, 6.04) | 6.33 (6.27, 6.39) | 5.94 (5.87, 6.02) | 6.23 (6.15, 6.30) | <0.0001 | 0.004 | 6.01 (1.13) |
| Non HDL, chol (mmol/L)e | 4.22 (4.18, 4.26) | 5.18 (5.07, 5.30) | 4.51 (4.47, 4.55) | 5.19 (5.13, 5.25) | 4.49 (4.41, 4.57) | 5.12 (5.05, 5.20) | <0.0001 | <0.0001 | 4.53 (1.18) |
| CRP (mg/L) | 1.58 (1.43, 1.73) | 2.06 (1.63, 2.49) | 2.20 (2.03, 2.37) | 2.63 (2.40, 2.86) | 3.74 (3.44, 4.05) | 4.39 (4.11, 4.67) | 0.001 | <0.0001 | 2.34 (4.23) |
| Triglycerides (mmol/L)d , e | 1.13 (1.10, 1.15) | 2.25 (2.17, 2.33) | 1.22 (1.19, 1.25) | 2.25 (2.20, 2.29) | 1.22 (1.16, 1.27) | 2.31 (2.25, 2.36) | NR | 0.003 | 1.41 (0.93) |
| Vegetables (portions/d)f | 2.67 (2.62, 2.71) | 2.65 (2.52, 2.78) | 2.68 (2.63, 2.73) | 2.73 (2.66, 2.80) | 2.60 (2.51, 2.70) | 2.71 (2.62, 2.80) | 0.08 | 0.19 | 2.54 (1.81) |
| Fruit (portions/day)g | 2.92 (2.85, 2.99) | 2.94 (2.73, 3.15) | 3.09 (3.01, 3.17) | 3.07 (2.96, 3.18) | 3.03 (2.88, 3.18) | 3.16 (3.03, 3.30) | 0.17 | 0.19 | 3.02 (2.29) |
| Red meat (portions/day)h | 1.03 (1.01, 1.05) | 1.09 (1.03, 1.15) | 1.12 (1.10, 1.14) | 1.14 (1.11, 1.17) | 1.15 (1.11, 1.19) | 1.21 (1.17, 1.24) | 0.05 | <0.0001 | 1.09 (0.74) |
| Mediterranean diet score | 8.84 (8.77, 8.92) | 8.64 (8.42, 8.86) | 8.75 (8.66, 8.83) | 8.76 (8.65, 8.88) | 8.72 (8.57, 8.88) | 8.59 (8.45, 8.74) | 0.21 | 0.16 | 8.55 (3.08) |
| Energy intake (kcal/day) | 2201 (2181, 2220) | 2186 (2128, 2243) | 2202 (2180, 2224) | 2196 (2165, 2226) | 2240 (2199, 2280) | 2228 (2191, 2265) | 0.67 | 0.08 | 2149 (623) |
| Alcohol (drinks/day)i | 1.85 (1.78, 1.91) | 1.82 (1.62, 2.01) | 1.84 (1.76, 1.92) | 1.82 (1.72, 1.93) | 1.78 (1.64, 1.92) | 1.72 (1.59, 1.85) | 0.56 | 0.36 | 1.62 (2.13) |
| Physical activity (%) | |||||||||
| Inactive | 22 (21, 24) | 25 (21, 29) | 23 (22, 25) | 27 (25, 29) | 31 (28, 34) | 32 (29, 34) | 0.71 | <0.0001 | 23 |
| Moderately inactive | 34 (32, 35) | 39 (35, 44) | 34 (32, 36) | 36 (33, 38) | 29 (26, 33) | 34 (31, 37) | 0.04 | 0.02 | 33 |
| Moderately active | 24 (23, 25) | 19 (14, 23) | 22 (21, 24) | 19 (17, 22) | 20 (17, 23) | 18 (16, 21) | 0.37 | 0.02 | 22 |
| Active | 20 (19, 22) | 16 (12, 21) | 20 (19, 22) | 17 (15, 20) | 19 (17, 22) | 16 (13, 19) | 0.07 | 0.63 | 21 |
| Education (%) | |||||||||
| No schooling/Primary | 35 (33, 36) | 43 (39, 48) | 43 (41, 44) | 46 (44, 48) | 52 (49, 55) | 51 (48, 54) | 0.65 | <0.0001 | 38 |
| Secondary | 15 (14, 16) | 12 (09, 16) | 14 (12, 15) | 11 (09, 13) | 11 (08, 13) | 10 (07, 12) | 0.44 | 0.002 | 15 |
| Vocational/University | 50 (48, 51) | 44 (40, 49) | 44 (42, 46) | 43 (40, 45) | 37 (34, 41) | 40 (37, 43) | 0.31 | <0.0001 | 47 |
| Smoking status (%) | |||||||||
| Never | 42 (40, 44) | 38 (33, 43) | 45 (44, 47) | 41 (38, 43) | 46 (42, 49) | 44 (41, 48) | 0.54 | 0.04 | 45 |
| Former | 29 (27, 30) | 24 (20, 29) | 31 (29, 33) | 33 (30, 35) | 34 (31, 38) | 32 (29, 35) | 0.36 | 0.002 | 29 |
| Current | 30 (28, 31) | 38 (34, 42) | 24 (22, 25) | 27 (24, 29) | 20 (17, 23) | 23 (20, 26) | 0.10 | <0.0001 | 26 |
BMI, body mass index; WC, waist circumference; chol, cholesterol; CRP, C-reactive protein; NR, not relevant.
Values are adjusted means or percentages (and confidence interval) from ANCOVA, adjusted for centre, sex, age, education, and smoking, as well as energy intake for dietary variables.
P-values were calculated using F-test.
Unadjusted means (SD) or percentages overall in the subcohort (n = 10 474).
Values in bold are components of the metabolic syndrome. The test for difference between metabolically healthy and unhealthy is not presented for these variables as it is not relevant (NR).
Conversion factors from mmol/L to mg/dL: glucose ×18.02; cholesterol ×38.67; triglycerides ×88.57.
1 vegetable portion = 80 g.
1 fruit portion = 80 g.
1 red meat portion = 110 g of unprocessed meat and 50 g of processed meat.
1 alcoholic drink corresponds to 10 g of ethanol.
Associations between body size and coronary heart disease
There was a positive approximately log linear association between BMI and CHD risk (Figure 1 and Table 2) after adjusting for potential confounders (Model 1): HR per-standard deviation = 1.25 (95% CI 1.19, 1.32), P < 0.0001. While the association was almost perfectly log-linear from quintile 1 to 4, departure from log-linearity was observed at the highest quintile. The risk of CHD almost doubled comparing the highest quintile (mean BMI = 32.7 kg/m2) to the lowest quintile (mean BMI = 21.5 kg/m2) (HR = 1.96 [95% CI 1.66, 2.32], P < 0.0001). The association was substantially less strong after adjustment for WC (HR =1.06 [95% CI 0.97, 1.15], P = 0.20), likely reflecting the effect of lean mass and peripheral adipose tissue. The association was also substantially attenuated in a model adjusted for intermediate cardiometabolic risk factors (blood pressure, total and HDL-cholesterol, diabetes) (HR = 1.05 [95% CI 1.01, 1.10], P = 0.03, Table 2). There was moderate heterogeneity across countries. Results were very similar in sensitivity analyses that use all available individuals with complete data for each model in turn (Supplementary material online, Table S2). However, results with multiply imputed data showed that, despite being strongly attenuated, the HRs remained significant when adjusted for WC or for intermediate CVD risk factors (Supplementary material online, Table S3). Waist circumference also had positive approximately linear associations with CHD (Figure 1, Table 2), which were robust to adjustment for BMI (HR = 1.24 [95% CI 1.10, 1.40], P < 0.0001). Adjustment for cardiometabolic factors substantially attenuated the association (Figure 1, Table 2).
Multivariate hazard ratios for coronary heart disease associated with body mass index and waist circumference
| HRa | 95% CI | P-value | I 2 b | 95% CI | |
|---|---|---|---|---|---|
| Model 0c | |||||
| BMI (kg/m2) | 1.27 | (1.21, 1.33) | <.0001 | 44% | (0%, 75%) |
| Waist circumference (cm) | 1.34 | (1.26, 1.42) | <.0001 | 47% | (0%, 76%) |
| Model 1d | |||||
| BMI (kg/m2) | 1.25 | (1.19, 1.32) | <.0001 | 46% | (0%, 76%) |
| Waist circumference (cm) | 1.32 | (1.24, 1.41) | <.0001 | 51% | (0%, 78%) |
| Model 2e | |||||
| BMI (kg/m2) | 1.06 | (0.97, 1.15) | 0.20 | 19% | (0%, 62%) |
| Waist circumference (cm) | 1.24 | (1.10, 1.40) | <.0001 | 43% | (0%, 75%) |
| Model 3f | |||||
| BMI (kg/m2) | 1.05 | (1.01, 1.10) | 0.03 | 0% | (0%, 68%) |
| Waist circumference (cm) | 1.06 | (1.00, 1.13) | 0.06 | 34% | (0%, 71%) |
BMI, body mass index; CHD, coronary heart disease.
Country-specific HRs were estimated from Prentice-weighted Cox proportional hazards models, and 95% CI estimated with robust variance, to take into account the case-cohort design. Hazard ratios were combined by multivariate random-effects meta-analysis across eight countries. Hazard ratios are expressed per 1 SD increase of anthropometric marker (BMI: 4.10 kg/m2, WC: 12.7 cm), with age as the primary time variable, stratified by sex and centre. n = 17 733 (7637 cases).
Heterogeneity across eight European countries.
Model 0. HR adjusted for age and smoking.
Model 1. HR adjusted for age, smoking, physical activity, Mediterranean diet score, energy and alcohol intake, educational level.
Model 2. Model 1 + waist circumference (for BMI) or BMI (for waist circumference).
Model 3. HR adjusted for age, smoking, systolic blood pressure, total cholesterol, HDL cholesterol, history of diabetes.
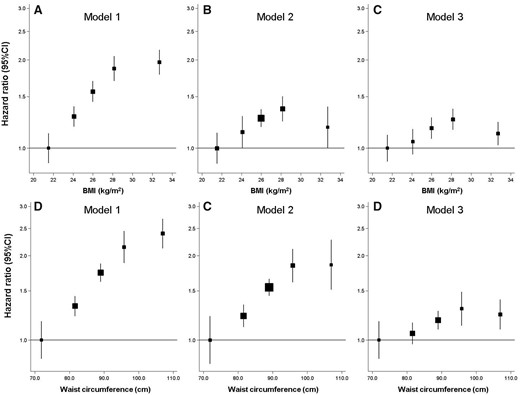
Multivariate hazard ratios for coronary heart disease across quintiles of body mass index (BMI) (A–C) and waist circumference (D–F). Country-specific hazard ratios (HRs) were estimated from Prentice-weighted Cox proportional hazards models, and 95% confidence interval (95% CI) estimated with robust variance, to take into account the case-cohort design. Hazard ratio (HRs) were combined by multivariate random-effects meta-analysis across eight countries and accompanied by a group-specific confidence interval (allowing a confidence interval to be attributed to the reference category). Age was used as the primary time variable, and analyses were stratified by sex and centre. n = 17 733 (7637 cases). Model 1 (A and D): Adjusted for age, smoking, physical activity, Mediterranean diet score, energy, and alcohol intake, educational level. Model 2: Model 1 + adjusted for WC (for BMI, B) or BMI (for WC, E). Model 3 (C and F): Adjusted for age, smoking status, systolic blood pressure, total cholesterol, HDL cholesterol, and history of diabetes. BMI, body mass index; WC, waist circumference, CHD; coronary heart disease.
There was a significant interaction between BMI and WC (P = 0.005), with a weaker association observed in the upper tertile of each anthropometric factor (Figure 2). For BMI, the HR per-standard deviation increase was 1.27 (95% CI 1.17, 1.38) in the lowest tertile of WC, whereas it was 1.10 (95% CI 1.03, 1.16) in the highest tertile. The association of WC with CHD was stronger at every level of BMI than any of the associations of BMI with CHD across the tertiles of WC: the HR per-standard deviation increase of WC was 1.65 (95% CI 1.43, 1.89) in the lowest tertile of BMI and 1.29 (95% CI 1.21, 1.38) in the highest tertile of BMI.
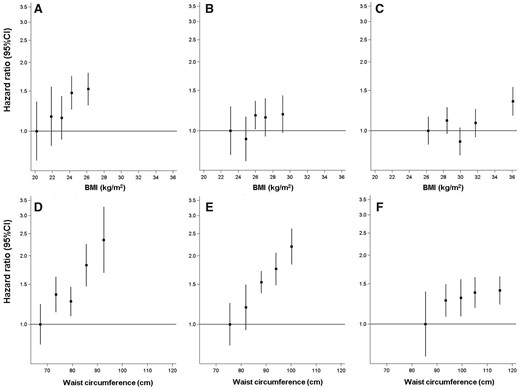
Multivariate hazard ratios (HRs, Model 1a) for CHD associated with quintiles of BMI per sex-specific tertile of WC (A–C) and quintiles of WC per sex-specific tertile of BMI (D–F). aCountry-specific HRs of CHD were estimated from Prentice-weighted Cox proportional hazards models, and 95% confidence interval (95% CI) estimated with robust variance, to take into account the case-cohort design. HRs were combined by multivariate random-effect meta-analysis across eight countries and accompanied by a group-specific confidence interval (allowing a confidence interval to be attributed to the reference category). Age was used as the primary time variable, and analyses were stratified by sex and centre. n = 17 733 (7637 cases). Model 1: Adjusted for age at baseline, smoking, physical activity, educational level, Mediterranean diet score, energy, and alcohol intake. Hazard ratios for quintiles of BMI, in the first (A), second (B), and third (C) sex-specific tertile of WC. Boundaries (cm) by tertiles: Tertile 1, 59–91 (M), 54–76 (F); Tertile 2, 92–99 (M),77–86 (F); Tertile 3, 100–151 (M), 87–137 (F). Hazard ratios for quintiles of WC, in the first (D), second (E), and third (F) sex-specific tertile of BMI. Boundaries (kg/m2) by tertiles: Tertile 1, 18.5–25.1 (M), 18.5–23.8 (F); Tertile 2, 25.1–27.9 (M), 23.8–27.4 (F); Tertile 3, 27.9–49.4 (M), 27.4–62.5 (F). P for interaction between BMI and WC = 0.005. BMI, body mass index; WC, waist circumference; CHD, coronary heart disease.
Associations between metabolically-defined body size phenotypes and coronary heart disease
Compared to the normal weight participants without MetS (reference group), all other metabolically-defined body size phenotypes were at significantly higher risk of CHD (Figure 3) in a fully adjusted model (Model B). Metabolically healthy obese individuals were at higher risk of CHD (HR = 1.28 [95% CI 1.03, 1.58], P = 0.02) but this was considerably lower than the risk in metabolically unhealthy groups. MetS was strongly positively associated with CHD risk, regardless of adiposity, with a HR of 2.15 (95% CI 1.79, 2.57: P < 0.0001) for metabolically unhealthy normal weight participants with MetS and a HR of 2.54 (95% CI 2.21, 2.92: P < 0.0001) in their obese counterparts. Results were generally consistent across countries (see Supplementary material online, Figure S3; Figure 3). Similar results were obtained from models unadjusted for physical activity and diet (Model A): the HRs were 1.25 (95% CI 1.14, 1.38) and 1.27 (95% CI 1.03–1.57) in the healthy overweight and obese, and 2.17 (95% CI 1.82, 2.59), 2.35 (95% CI 2.02, 2.74) and 2.63 (95% CI 2.30, 3.01) in the unhealthy normal weight, overweight and obese, respectively. There were no significant interactions between BMI and MetS (P = 0.19).
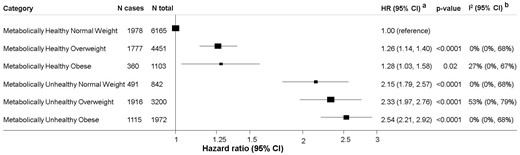
Multivariate hazard ratios of CHD in metabolically-defined body size phenotypes. aCountry-specific HRs of CHD were estimated from Prentice-weighted Cox proportional hazards models, and 95% CI estimated with robust variance, to take into account the case-cohort design. Hazard ratios were combined by multivariate random-effects meta-analysis across eight countries. Age was used as the underlying time scale, analyses were stratified by sex and centre, HRs adjusted for age, smoking, educational level, physical activity, Mediterranean diet score, energy, and alcohol intake (Model B). n = 17 733 participants (7637 CHD cases). P for interaction between BMI and MetS = 0.19. bHeterogeneity across eight European countries.
Sensitivity analyses show similar results after excluding the first 2 years of follow-up (see Supplementary material online, Table S4), when analyses were restricted to ‘harder’ CHD events only (see Supplementary material online, Table S5), or when restricting the sample to non-smokers only (see Supplementary material online, Table S6). Analyses restricted to events only validated to the highest level of certainty were qualitatively similar but less precise (see Supplementary material online, Table S7). There was no difference between men and women (p for interaction = 0.63, Supplementary material online, Table S8). Estimates from the multiple imputation showed similar trends with the exception of an HR of greater magnitude for the metabolically healthy obese (1.67 [95% CI 1.39; 1.99]) (see Supplementary material online, Table S3).
Sensitivity analyses using a definition of MetS that excludes the WC criterion showed somewhat stronger positive associations for all phenotypes (see Supplementary material online, Table S9). Results were qualitatively similar to the main analysis (but less precise) when a stricter definition of metabolically healthy was used (i.e. having none of the MetS abnormalities) (see Supplementary material online, Table S10). Finally, when obesity was defined by WC (and not by BMI), and MetS did not include the WC criteria, HRs were again qualitatively similar to the main analysis although somewhat stronger (see Supplementary material online, Table S11). When further adjusted for BMI, HRs were attenuated. Agreement between the two definitions of metabolically-defined body size phenotypes where body size is defined by BMI or by WC was only moderate, with a weighted kappa of 0.667 (see Supplementary material online, Table S12).
Discussion
In this prospective case-cohort study with 7637 CHD cases from eight European countries followed-up for a median of 12.2 years, we assessed the separate and combined effects of body size and metabolic health on CHD. We observed higher CHD risk for general and central adiposity, as defined by BMI and WC, respectively. Whilst the effect of BMI was substantially attenuated on adjustment for WC, the effect of WC appeared to be robust to adjustment for BMI. Metabolically healthy overweight and obese individuals were at higher risk of CHD compared to their normal weight counterparts. However, CHD risk in metabolically unhealthy individuals was markedly higher than in their metabolically healthy counterparts across all BMI categories.
Our study, which is the largest to address this question in terms of the number of incident CHD events, suggests that ‘metabolically healthy’ obesity is not a benign condition. This is of particular importance as overweight people (BMI ≥25 and <30) with no traditional cardiometabolic risk factors are not recommended for weight loss treatment by recent UK or USA guidelines.39 , 40 The risk of CHD in metabolically healthy overweight or obese individuals was significantly lower than in the ‘metabolically unhealthy’ groups, suggesting that obese and overweight individuals without metabolic abnormalities are at intermediate cardiovascular risk between metabolically healthy normal weight individuals and metabolically unhealthy individuals. In support of this hypothesis, we showed that only 6% of the obese had strictly no cardiometabolic abnormality vs. 31% of the normal weight, and that metabolically healthy obese individuals have worse cardiometabolic health than their normal weight counterparts, reflected by higher blood pressure, HbA1c, pro-atherogenic lipids, and C-reactive protein. These data concur with studies that used repeated measurements to evaluate the evolution of metabolically healthy obesity over time, showing that metabolically healthy obese people were more likely to go on to develop metabolic abnormalities (and become metabolically unhealthy obese) than their normal weight counterparts.41–47 Despite being acknowledged as a risk factor for CVD, excess weight is not included in the prediction model SCORE.48 This algorithm estimates the 10 year risk of fatal CVD and its use is recommended by the ESC Guidelines for CVD risk assessment of patients to assist health professionals in their prevention and treatment strategies.19 Our results suggest that, even in the absence of multiple traditional CVD risk factors (smoking, type 2 diabetes, high blood pressure, high blood cholesterol), weight-loss strategies through intensive lifestyle advice (diet, exercise, and behaviour modifications) or medical therapy (orlistat or bariatric surgery) should be recommended for obese patients to try to achieve and maintain a healthy body weight to decrease CVD risk. Overall, these results support a population-wide strategy for prevention of obesity and overweight regardless of the initial metabolic status of individuals.
In accordance with previous evidence on CVD, type 2 diabetes, breast and colorectal cancer,14 , 17 , 49–51 normal weight individuals with metabolic abnormalities had twice the risk of normal weight individuals without metabolic abnormalities. This is consistent with the adverse effects of metabolic factors in cardiovascular health, which are independent of obesity and accumulation of fat, and could involve inflammation, high-blood pressure, lipotoxicity, and atherosclerosis.4 , 52 We also found that a higher WC was associated with higher risk of CHD at all levels of BMI, including for those in the normal weight category. This is in line with pooled results from 11 prospective studies which found a linear positive association between WC and mortality risk at all levels of BMI ranging from 20 to 50 kg/m2,53 advocating for the importance of an increased waistline at whole spectrum of BMI. Furthermore, a growing body of literature based on novel imaging markers has shown heterogeneity in the cardiovascular phenotype of obesity depending on location of adipose depots, with increased risk observed with visceral adipose tissue compared to subcutaneous fat.54–56 This implies that targeted visceral fat loss, rather than overall weight loss, may be a more efficient treatment of obesity to prevent cardiovascular events. Medical therapy with orlistat, which leads to greater reduction in visceral adipose tissue compared to placebo in clinical trials,57 , 58 is a treatment option recommended by the latest ESC guidelines.19
Positive associations between BMI and WC and CHD are also consistent with previous evidence.1–4 Our study confirms both the shape and magnitude of a combined analysis of 39 prospective studies (5259 CHD cases) by the Emerging Risk Factors Collaboration,3 which found a HR of 1.29 (1.22–1.37) for an increase in BMI of 4.56 kg/m2 and 1.32 (1.24–1.40) for an increase in WC of 12.6 cm. Our results also align with those of the recent study by the Global BMI Mortality Collaboration, which found a significantly higher risk of CHD death in both the overweight and obesity groups compared with the normal weight group in an analysis including 3 599 426 participants and 54 872 CHD deaths.1 Although substantially attenuated, an independent effect of BMI and WC remained after adjustment for major potential mediators (SBP, cholesterol, diabetes), indicating that the excess risk for CHD due to high BMI or WC is at least partially mediated by other factors. This is consistent with a pooled analysis of 97 prospective cohort studies from the Prospective Studies Collaboration (57 161 CHD cases), which estimated that these three factors collectively explained 46% of the excess risk due to adiposity.4 The association between adiposity and CHD has been suggested to be causal by Mendelian randomization studies, which have shown that genetic scores indexing BMI or waist-to-hip ratio are associated with risk of CHD.59–61 Similar studies have shown causal associations of adiposity with cardiovascular risk factors, supporting the hypothesis of mediation by blood pressure and cholesterol.62
Our study had various strengths, including its prospective design and its large sample size, allowing assessment of risk in various subgroups. Anthropometric factors were mostly measured by trained health professionals, which should reduce measurement error, and concomitant measurement of weight, height, and waist circumference allowed direct comparison of BMI and WC in the same participants. The biomarkers measured and information on medical history permitted exploration of various commonly used definitions of MetS, and the extensive information on covariates (smoking, physical activity, diet quality, alcohol, education) allowed adjustment for a range of potential confounders. However, we cannot rule out the possibility of unmeasured confounding. In particular, as behaviours like physical activity and diet are self-reported at a single time point and were therefore prone to measurement error,28 , 63 it is likely that they were not fully captured.
Study limitations
A potential limitation when comparing our results with previous studies is the lack of consistency in the definition of metabolically healthy obesity.38 , 64 Moreover, by definition, the MetS gives a simplified picture of diverse and complex phenotypes. To overcome this limitation, we chose the most common definition14 , 15 , 17 (absence of the MetS5) and compared several alternative definitions in sensitivity analyses, all of which gave qualitatively similar results. The absence of repeated assessment of metabolic health or adiposity during follow-up meant we were unable to assess within-person variability in adiposity and shed light on the proportion of metabolically healthy obese individuals who became metabolically unhealthy, preventing analyses of ‘stable metabolically healthy obesity’ and ‘transient metabolically healthy obesity’. Finally, we acknowledge that some of the centres included in the EPIC study are not representative of the general population, potentially limiting the generalizability of our findings. For example, the prevalence of metabolically healthy obesity within obese participants (45%) in EPIC-CVD is higher than in some other population-based studies,64 suggesting that EPIC participants are likely to be healthier than the general population. However, even if the participants are different from the general population, as long as there is enough variability in the exposure (here, obesity and metabolic health markers), CHD risk estimates and generalizability of the associations are unlikely to be affected.
Conclusions
In this large pan-European study, overweight and obesity were associated with higher risk of CHD, even in the absence of MetS. The presence of metabolic abnormalities was associated with a higher risk of CHD at all levels of adiposity, including in normal weight individuals. Overweight and obese individuals without metabolic dysfunction were at intermediate risk of CHD between healthy normal weight and metabolically unhealthy individuals. Our results highlight the importance of both obesity and metabolic health in CHD prevention and do not support the concept of ‘metabolically healthy obesity’. Population-wide prevention and treatment of obesity is therefore warranted, regardless of metabolic health.
Supplementary material
Supplementary material is available at European Heart Journal online.
Acknowledgements
We thank all EPIC participants and staff for their contribution to the study. We thank staff from the EPIC-CVD and EPIC-InterAct Coordinating Centres for carrying out sample preparation and data-handling work, particularly Sarah Spackman (EPIC-CVD Data Manager).
Funding
EPIC-CVD has been supported by the European Union Framework 7 (HEALTH-F2-2012-279233), the European Research Council (268834), the UK Medical Research Council (G0800270 and MR/L003120/1), the British Heart Foundation (SP/09/002 and RG/08/014 and RG13/13/30194), and the UK National Institute of Health Research. EPIC Asturias was also supported by the Regional Government of Asturias. EPIC-Greece is also supported by the Hellenic Health Foundation. EPIC-Heidelberg was also supported by the German Cancer Aid, German Cancer Research Centre, German Federal Ministry of Education and Research. EPIC-Oxford was also supported by the UK Medical Research Council (MR/M012190/1) and Cancer Research UK (570/A16491). EPIC-Ragusa was also supported by the Sicilian Government, Associazione Iblea per la Ricerca Epidemiologica (A.I.R.E.) - ONLUS Ragusa, and Associazione Volontari Italiani Sangue AVIS Ragusa. EPIC-Turin was supported also by the Compagnia di San Paolo and the Human Genetics Foundation-Torino (HuGeF).
Data sharing: For information on how to submit an application for gaining access to EPIC data and/or biospecimens, please follow the instructions at http://epic.iarc.fr/access/index.php.
Conflict of interest: none declared.
References
Author notes
Camille Lassale and Ioanna Tzoulaki authors contributed equally to this manuscript.
See page 407 for the editorial comment on this article (doi: )


Comments
We read with interest the report by Lassale and colleagues that irrespective of metabolic health, overweight and obese people have higher coronary heart disease (CHD) risk than lean people. Recently, we happen to be preforming a meta-analysis of prospective cohort studies to evaluate whether metabolically healthy obese patients carry an elevated risk of cardiovascular disease (CVD) and all-cause mortality. We include the prospective cohort studies with six mutually exclusive groups including: 1) metabolically healthy and normal weight (MHN), 2) metabolically healthy and overweight (MH-OW), 3) metabolically healthy obese (MHO), 4) metabolically unhealthy normal weight (MU-NW), 5) metabolically unhealthy overweight (MU-OW), and 6) metabolically unhealthy obese (MUO).
Nine studies are included in the meta-analysis. In agreement with the results of the Lassale et al, the results of meta-analysis based on nine studies find that both overweight and obese people with metabolic health confer a significant increased risk of CVD [MHN: Referent; MH-OW: HR = 1.19, 95% CI: 1.08, 1.29; MHO: HR = 1.27, 95% CI: 1.06, 1.47; MU-NW: HR = 1.73, 95% CI: 1.50, 1.97; MU-OW: HR = 1.72, 95% CI: 1.41, 2.03; MUO: HR = 2.07, 95% CI: 1.66, 2.49]. Absolutely, MH-OW and MHO phenotypes are associated with lower risk than the metabolically unhealthy overweight and obese. However, the results of meta-analysis based on three studies find MHO phenotype did not confer a higher for all-cause mortality [MHN: Referent; MH-OW: HR = 1.36, 95% CI: 1.05, 1.66; MHO: HR = 1.05, 95% CI: 0.85, 1.24; MU-NW: HR = 1.32, 95% CI: 1.11, 1.54; MU-OW: HR = 1.52, 95% CI: 1.11, 1.93; MUO: HR = 1.94, 95% CI: 1.42, 2.46]. The three limited number of included studies may retard our exploration of the reason, and it may be necessary to evaluate the association of ‘metabolically healthy obesity’ with all-cause mortality.
Yafeng Wang, Zhaoqiang Cui
Cardiovascular Department
Fudan University Zhongshan hospital
Shanghai, China
E-mail: wyf.90.25.wyf@stu.xjtu.edu.cn