


Abstract
In atrial fibrillation (AF), mortality remains high despite effective anticoagulation. A model predicting the risk of death in these patients is currently not available. We developed and validated a risk score for death in anticoagulated patients with AF including both clinical information and biomarkers.
The new risk score was developed and internally validated in 14 611 patients with AF randomized to apixaban vs. warfarin for a median of 1.9 years. External validation was performed in 8548 patients with AF randomized to dabigatran vs. warfarin for 2.0 years. Biomarker samples were obtained at study entry. Variables significantly contributing to the prediction of all-cause mortality were assessed by Cox-regression. Each variable obtained a weight proportional to the model coefficients. There were 1047 all-cause deaths in the derivation and 594 in the validation cohort. The most important predictors of death were N-terminal pro B-type natriuretic peptide, troponin-T, growth differentiation factor-15, age, and heart failure, and these were included in the ABC (Age, Biomarkers, Clinical history)-death risk score. The score was well-calibrated and yielded higher c-indices than a model based on all clinical variables in both the derivation (0.74 vs. 0.68) and validation cohorts (0.74 vs. 0.67). The reduction in mortality with apixaban was most pronounced in patients with a high ABC-death score.
A new biomarker-based score for predicting risk of death in anticoagulated AF patients was developed, internally and externally validated, and well-calibrated in two large cohorts. The ABC-death risk score performed well and may contribute to overall risk assessment in AF.
NCT00412984 and NCT00262600
Introduction
Atrial fibrillation (AF) is the most common clinical arrhythmia and the prevalence is projected to increase markedly in the coming decades.1 Atrial fibrillation is independently associated with up to a two-fold higher risk of death.2 , 3 During the last two decades, the mortality associated with AF has doubled.4 In the USA alone, AF has been estimated to contribute to 130 000 deaths each year.5 Several risk scores are available in AF; however, none specifically to estimate the risk of death, the most common severe outcome event in anticoagulated patients with AF.6–9
Several biomarkers have previously been shown to be powerful predictors for stroke, major bleeding, or risk of death in patients with AF.10–13 Biomarker-based risk scores for stroke and bleeding in AF have recently been developed and validated.14–16 These biomarker-based ABC (Age, Biomarkers, and Clinical history) risk scores outperformed other contemporary risk scores17–19 in patients with AF concerning predictive ability and calibration.14–16 Based on these advantages, we aimed to develop and validate a novel risk score that included the most important prognostic biomarkers and clinical characteristics to predict all-cause and cardiovascular death in anticoagulated patients with AF. The development and internal validation cohort consisted of 14 701 patients with AF in the Apixaban for Reduction in Stroke and Other Thromboembolic Events in Atrial Fibrillation (ARISTOTLE) trial,9 , 20 and the external validation cohort of 8548 participants with AF and biomarkers measured at entry in the Randomized Evaluation of Long-Term Anticoagulation Therapy (RE-LY) trial.8 , 21
Methods
Study populations
The ARISTOTLE trial randomized 18 201 patients with AF and an increased risk of stroke to warfarin or apixaban.9 , 20 Biomarker samples at baseline were available from 14 611 participants, with a median length of follow-up of 1.9 years. The RE-LY trial randomized 18 113 patients with AF to dabigatran or warfarin.8 , 21 Biomarker samples at baseline were available in 8548 participants, with a median length of follow-up of 2.0 years. Overall, both the ARISTOTLE and RE-LY biomarker cohorts were representative of each respective study cohort and have been described in detail previously.10 , 22
Endpoint and outcome assessment
In both the ARISTOTLE and the RE-LY trial, the primary efficacy study outcome was stroke or systemic embolism, and the primary safety outcome was major bleeding.8 , 9 Among key secondary outcomes was death from any cause. Deaths were further classified either as cardiovascular or non-cardiovascular. Blinded Clinical Events Committees reviewed and centrally adjudicated these outcome events.
Biochemical methods
Blood samples were collected in both the ARISTOTLE and RE-LY studies in EDTA tubes at randomization and immediately centrifuged, frozen in aliquots, and stored at −70 °C until analysed centrally at the UCR Laboratory, Uppsala, Sweden. Cardiac troponin-I (cTnI-hs) levels were determined with high-sensitivity immunoassays on the ARCHITECT i1000SR (Abbott Diagnostics), Troponin-T (cTnT-hs) and N-terminal pro B-type natriuretic peptide (NT-proBNP) with high-sensitivity immunoassays on the Cobas® Analytics e601 (Roche Diagnostics), growth differentiation factor-15 (GDF-15) with the Elecsys GDF-15 pre-commercial assay kit P03 with the same standardization as the recently introduced routine reagent (ROCHE Diagnostics). All analyses were performed according to the instructions of the manufacturer and have been detailed previously.13 , 23–29 Plasma creatinine (Roche Modular) and haemoglobin (Beckman Coulter) measurements were performed by central laboratories. Estimated glomerular filtration rate was calculated by the Chronic Kidney Disease Epidemiology Collaboration (CKD-EPI) equation.
Statistical analyses
A detailed description of the statistical methods is presented in the Supplementary Material online. In the first step, a model including all candidate predictors (listed in Figure 1) was fitted in 14 611 patients from the ARISTOTLE trial. The full model was then approximated, blinded for the outcome, by a smaller model including the most predictive variables. An alternative model was created in the same manner but replacing cTnT-hs with cTnI-hs. Similarly, a model was developed for cardiovascular mortality. The equations of the final models are presented both in the Supplementary Material online and as nomograms. Risk categories were created according to 0–2%, 2–5%, 5–10%, and >10% risk for all-cause death within 1 year.
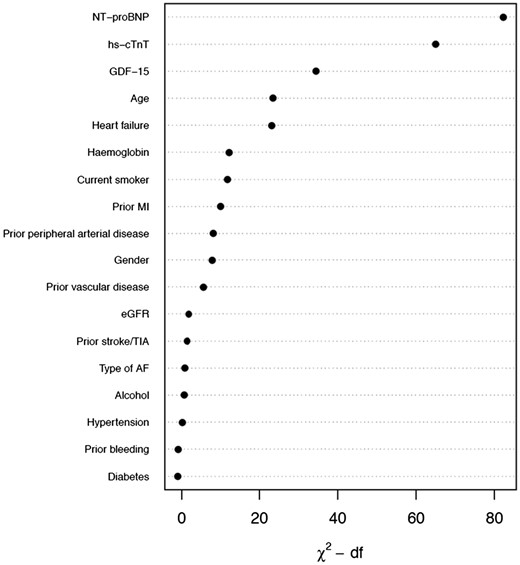
Relative importance of each variable in the full model. Measured by partial Wald χ2 minus the predictor degrees of freedom. NT-proBNP, N-terminal pro B-type natriuretic peptide; cTnT-hs, cardiac troponin T measured with high-sensitivity assay; GDF-15, growth differentiation factor-15; MI, myocardial infarction; eGFR, estimated glomerular filtration rate; TIA, transient ischaemic attack; AF, atrial fibrillation; df, degrees of freedom.
Internal and external model validation
The model was internally validated using 150 bootstrap samples. External validation was conducted in 8548 patients from the RE-LY trial. In order to thoroughly compare the prognostication of all-cause and cardiovascular death, the new biomarker-based risk model was evaluated against a multivariable model solely based on clinical variables and the widely used CHA2DS2-VASc score, although originally created for stroke prediction.
Discrimination was assessed by Harrell’s c-index30 and by comparing Kaplan–Meier curves and hazard ratios between the predefined risk categories. Calibration was assessed by comparing observed 1-year event rates with predictions from the final model. Clinical usefulness and net benefit were estimated with decision curve analysis.31 The final model was also evaluated in different subgroups; without a history of stroke, without heart failure diagnosis, low time in therapeutic range (TTR), and in the groups randomized to apixaban and dabigatran therapy, respectively.
The analyses followed the framework for derivation and validation of prediction models proposed by Harrell,30 Steyerberg and Vergouwe,32 and Royston and Altman.33 The reporting followed the TRIPOD statement.34 All analyses were performed using R version 3.2.
Results
Baseline demographics and biomarker levels in the derivation and validation cohorts
Baseline demographics and concentrations of the evaluated biomarkers in both cohorts are presented in Table 1. The median age was 70 years in the derivation cohort and 72 years in the validation cohort. In both cohorts, ∼36% were women, and a majority had non-paroxysmal AF.
Demographics and baseline characteristics in the derivation and external validation cohorts
| Variable | Derivation N = 14 980 | Validation N = 9369 |
|---|---|---|
| Age (years) | 70.0 (63.0–76.0) | 72.0 (67.0–77.0) |
| Gender: female | 35.6% (5331) | 36.4% (3408) |
| Current smoker | 8.1% (1219) [14] | 7.7% (721) [0] |
| Alcohol | 2.5% (378) | 14.1% (1322) |
| Antiplatelet/NSAID | 38.6% (5778) | 43.4% (4063) |
| Diabetes | 24.7% (3697) | 22.2% (2079) |
| Heart failure | 31.0% (4651) [0] | 28.9% (2711) [1] |
| Hypertension | 87.5% (13 114) | 78.9% (7391) |
| Permanent or persistent AF | 84.9% (12 711) [3] | 67.6% (6333) [4] |
| Prior stroke/TIA | 18.7% (2809) | 19.5% (1823) |
| Prior myocardial infarction | 12.9% (1926) [1] | 17.0% (1589) [0] |
| Peripheral arterial disease | 4.9% (730) [1] | 3.7% (345) [1] |
| Vascular disease | 24.8% (3723) | 19.4% (1819) |
| Renal function (CKD-EPI, mL/min) | 56.0 (45.3–68.0) [9] | 64.8 (53.7–77.0) [91] |
| cTnI-hs (ng/L) | 5.4 (3.3–10.1) [158] | 6.9 (4.3–13.0) [454] |
| cTnT-hs (ng/L) | 11.0 (7.5–16.7) [82] | 12.2 (7.7–19.5) [650] |
| GDF-15 (ng/L) | 1383.0 (977.0–2052.0) [181] | 1514.0 (1109.5–2194.0) [718] |
| Hemoglobin (g/dL) | 14.2 (13.2–15.3) [70] | 14.3 (13.2–15.3) [159] |
| NT-proBNP (ng/L) | 713.5 (363.0–1250.0) [87] | 814.5 (391.0–1438.2) [73] |
Variables are represented as median (Q1–Q3) or percentage (frequency). Numbers in brackets represents the number of missing values. A total of 8548 subjects in the validation cohort had complete data on all variables included in the final model and were used in the validation of the new risk model.
NSAID, non-steroidal anti-inflammatory drugs; AF, atrial fibrillation; TIA, transient ischaemic attack; eGFR, estimated glomerular filtration rate; cTn-hs, cardiac troponin with high sensitivity assay; NT-proBNP, N-terminal fragment B-type natriuretic peptide; GDF-15, growth differentiation factor 15; IL-6, interleukin-6.
Development and internal validation of a biomarker-based risk score for all-cause mortality in atrial fibrillation
The development and internal validation of the new score was based on 28 396 person-years of follow-up and 1047 events (incidence rate 3.69 per 100 person-years). The full model including the candidate variables listed in Table 1 had a c-index of 0.75 [95% confidence interval (95% CI 0.74–0.77)]. Internal bootstrap validation indicated only modest over-fitting (optimism-corrected c-index 0.74). The most important predictors were NT-proBNP, cTnT-hs, GDF-15, age, and heart failure (Figure 1). A model based on only these five variables approximated 91.8% of the full Cox-model. The regression equation is presented in the Supplementary Material online and as a nomogram in Figure 2. The new biomarker-based risk score for prediction of all-cause mortality in AF was given the acronym ABC-death [Age, Biomarkers (NT-proBNP, cTnT-hs, GDF-15), and Clinical history of heart failure].
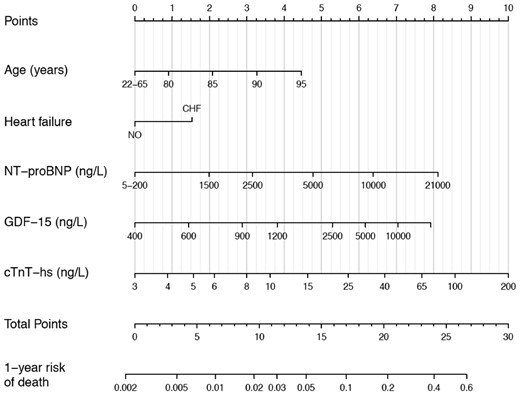
Nomogram for the final biomarker-based ABC-death risk score. Note that the continuous variables are only represented from the respective 1st to the 99th percentiles. Application of the nomogram is exemplified in Supplementary material online, Figure S9.
The new ABC-death score yielded a c-index of 0.74 (95% CI 0.73–0.76). The ABC-death score consistently achieved good c-indices when evaluated in multiple clinically relevant subgroups (Table 2). The ABC-death score performed equally well in patients randomized to warfarin or apixaban.
C-indices for all-cause mortality according to the ABC-death score (including alternative biomarkers) compared with the CHA2DS2-VASc in the full cohorts and in subgroups
| Full cohort | No prior stroke/TIA | No prior HF | TTR < 65% | NOACa | |
|---|---|---|---|---|---|
| Derivation cohort, Events/N | 1047/14 611 | 816/11 858 | 575/10 080 | 686/8346 | 506/7319 |
| ABC-death (cTnT) | 0.74 (0.73, 0.76) | 0.75 (0.73, 0.76) | 0.73 (0.71, 0.75) | 0.74 (0.72, 0.77) | 0.75 (0.72, 0.77) |
| ABC-death (cTnI) | 0.75 (0.73, 0.76) | 0.75 (0.73, 0.77) | 0.74 (0.72, 0.76) | 0.74 (0.71, 0.76) | 0.75 (0.73, 0.77) |
| All clinical information | 0.68 (0.66, 0.70) | 0.68 (0.66, 0.70) | 0.67 (0.64, 0.69) | 0.69 (0.66, 0.71] | 0.67 (0.65, 0.70) |
| CHA2DS2-VASc | 0.59 (0.57, 0.61) | 0.59 (0.57, 0.61) | 0.59 (0.57, 0.62) | 0.57 (0.54, 0.60) | 0.59 (0.57, 0.62) |
| Validation cohort, Events/N | 594/8548 | 474/6893 | 324/6095 | 101/1119 | 391/5697 |
| ABC-death (cTnT) | 0.74 (0.72, 0.76) | 0.74 (0.72, 0.76) | 0.72 (0.69, 0.75) | 0.73 (0.68, 0.78) | 0.75 (0.73, 0.78) |
| ABC-death (cTnI) | 0.73 (0.71, 0.75) | 0.73 (0.70, 0.75) | 0.70 (0.67, 0.73) | 0.70 (0.65, 0.76) | 0.74 (0.72, 0.77) |
| All clinical information | 0.67 (0.65, 0.69) | 0.67 (0.65, 0.69) | 0.65 (0.62, 0.68) | 0.61 (0.56, 0.67) | 0.69 (0.67, 0.72) |
| CHA2DS2-VASc | 0.58 (0.56, 0.61) | 0.59 (0.56, 0.61) | 0.57 (0.56, 0.61) | 0.54 (0.48, 0.59) | 0.59 (0.57, 0.62) |
All clinical information—a model solely consisting of clinical variables (age, gender, smoking, alcohol, prior stroke/TIA, diabetes, hypertension, heart failure, prior myocardial infarction, peripheral arterial disease, vascular disease, AF-type, and prior bleeding). CHA2DS2-VASc—assigns 1 point each for Congestive heart failure, Hypertension, Diabetes mellitus, Vascular disease, Age 65–74 years, and Gender category (female gender), and 2 points for Age ≥ 75 years and, prior Stroke/transient ischaemic attack).
TTR, time in therapeutic range (INR 2.0–3.0); ABC-death, Age, Biomarkers (cardiac troponin, NT-proBNP, and GDF-15), Clinical history of heart failure); NOAC, non-vitamin K antagonist oral anticoagulation.
Apixaban in the derivation cohort and dabigatran in the validation cohort.
In comparison, the risk prediction model consisting only of clinical variables (age, gender, smoking, alcohol, prior stroke/TIA, diabetes, hypertension, heart failure, prior myocardial infarction, peripheral arterial disease, vascular disease, AF-type, and prior bleeding) achieved a c-index of 0.68 (95% CI 0.66–0.70) for all-cause mortality. The widely used CHA2DS2-VASc score, although created for stroke prediction, yielded a c-index of 0.59 (95% CI 0.57–0.61).
External validation of the novel biomarker-based ABC-death risk score in atrial fibrillation
The external validation was based on 16 794 person-years of follow-up and 594 events (incidence rate 3.54 per 100 person-years) in the RE-LY cohort. The ABC-death score achieved a c-index of 0.74 (95% CI 0.72–0.76). The model with clinical variables only achieved a c-index of 0.67 (95% CI 0.65–0.69). The CHA2DS2-VASc score achieved a c-index of 0.58 (95% CI 0.56–0.61). The ABC-death score consistently achieved good c-indices when evaluated in multiple clinically relevant subgroups (Table 2). The ABC-death score performed equally well in patients randomized to warfarin or dabigatran. As compared to the recently developed ABC-stroke and ABC-bleeding risk scores, the discrimination of the risk of all-cause mortality was superior with the ABC-death risk score (see Supplementary material online, Table S1).
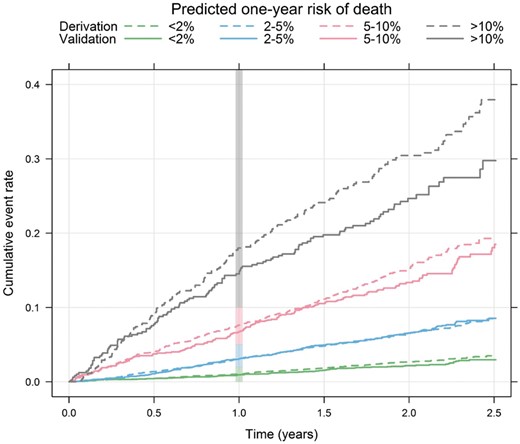
The incidence rates per year were similar in the derivation and external validation data within each predefined risk class: 1.39 vs. 1.14% (low), 3.44 vs. 3.66% (intermediate), 8.37 vs. 7.73% (high), and 18.49 vs. 14.09% (very high) (see Supplementary material online, Table S2). The hazard ratios between the risk classes in the derivation and validation cohorts were also similar (see Supplementary material online, Table S2). The ABC-death score was well calibrated as demonstrated by comparison of event rates within risk classes in the derivation and validation data (Take home figure) and on a continuous scale (see Supplementary material online, Figure S1). The absolute difference in mortality between the apixaban and warfarin groups was more pronounced in patients with a predicted annual risk ≥ 5% in the ABC-death score (see Supplementary material online, Figure S2).
Cumulative risk of death by predicted 1-year ABC-death risk group for the derivation (dashed lines, n = 14 611) and the validation (solid lines, n = 8548) data. The vertical bar indicates the 1-year risk.
To evaluate the clinical utility of the ABC-death score decision curve analysis was used (Figure 4). Decision curve analysis graphically shows the clinical usefulness of a model based on a continuum of potential thresholds for risk (x-axis) and the net benefit of using the model to risk stratify patients (y-axis) relative to assuming that no patient will have an event (death). The ABC-death risk score displayed consistent positive and larger net benefit across a broad range of risk thresholds compared to the model with clinical variables only.
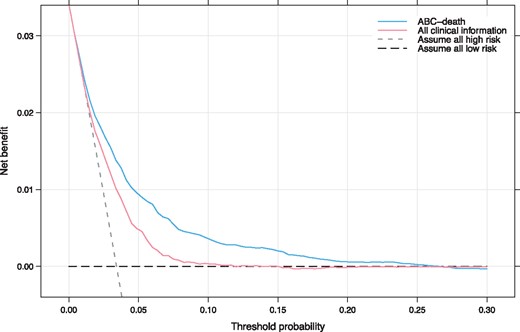
Decision curve analysis. Net benefit of using a model to predict 1-year event of death as compared with strategies of ‘assume high risk to all’ or ‘assume low risk to all’ for different thresholds. A multivariable model based on all clinical information was used for comparison. The analysis is based on 24 348 patients from the ARISTOTLE and RE-LY trials. ABC-death—Age, Biomarkers (cardiac troponin, NT-proBNP, and GDF-15), Clinical history of heart failure). All clinical information—a model solely consisting of clinical variables (age, gender, smoking, alcohol, prior stroke/TIA, diabetes, hypertension, heart failure, prior myocardial infarction, peripheral arterial disease, vascular disease, AF-type, and prior bleeding). As an example, in a population with approximately 37 deaths per 1000 person-years, for a decision threshold of 5% 1-year risk of death, compared with not using any model the ABC-death model would identify 10 additional true deaths within 1 year per 1000 subjects, without increasing the number of false positive predictions. Not using a model would assume that all subjects have the same risk and is illustrated by the two alternatives of either assuming all are at low risk or that all are at high risk. The corresponding net benefit of using a model with all clinical information is five additional true deaths.
ABC-death risk score for cardiovascular mortality in atrial fibrillation
There was a total of 532 deaths due to cardiovascular cause in the ARISTOTLE biomarker cohort and 385 in total in the RE-LY biomarker cohort. The nomogram for the ABC-death for cardiovascular mortality is presented in Supplementary material online, Figure S3. The discriminatory ability of the ABC-death risk score for cardiovascular death remained good with C-indices of 0.76 (95% CI 0.74–0.78) and 0.77 (95% CI 0.74–0.79) in the derivation and validation cohorts respectively. The ABC-death score performed equally well in subgroups, and without any significant interaction with the effects of the randomized treatment (Table 3). The absolute difference in rates of cardiovascular death between the apixaban and warfarin groups was more pronounced in patients with a predicted annual risk ≥ 2% in the ABC-death score (Figure 5). In comparison, the multivariable model solely consisting of clinical variables (age, gender, smoking, alcohol, prior stroke/TIA, diabetes, hypertension, heart failure, prior myocardial infarction, peripheral arterial disease, vascular disease, AF-type, and prior bleeding) achieved c-indices of 0.70 (95% CI 0.68–0.73) and 0.68 (95% CI 0.66–0.71) for cardiovascular death in the internal and external validations, respectively (Table 3). The CHA2DS2-VASc score achieved c-indices of 0.58 (95% CI 0.56–0.61) and 0.59 (95% CI 0.56–0.61) in the internal and external validations, respectively (Table 3). The ABC-death score for cardiovascular mortality was well calibrated (see Supplementary material online, Figure S4) and displayed consistent positive and larger net benefit compared to the model with clinical variables only across a broad range of risk thresholds according to decision curve analysis (see Supplementary material online, Figure S5).
C-indices for cardiovascular mortality according to the ABC-death score (including alternative biomarkers) compared with the CHA2DS2-VASc in the full cohorts and in subgroups
| Full cohort | No prior stroke/TIA | No prior HF | TTR < 65% | NOACa | |
|---|---|---|---|---|---|
| Derivation cohort, Events/N | 532/14 611 | 406/11 858 | 268/10 080 | 373/8346 | 506/7319 |
| ABC-death (cTnT) | 0.76 (0.74, 0.78) | 0.76 (0.73, 0.78) | 0.74 (0.71, 0.77) | 0.77 (0.74, 0.81) | 0.74 (0.71, 0.78) |
| ABC-death (cTnI) | 0.74 (0.73, 0.76) | 0.76 (0.74, 0.79) | 0.75 (0.72, 0.78) | 0.77 (0.74, 0.81) | 0.75 (0.72, 0.78) |
| All clinical information | 0.70 (0.68, 0.73) | 0.70 (0.67, 0.72) | 0.67 (0.64, 0.71) | 0.72 (0.68, 0.75) | 0.69 (0.65, 0.72) |
| CHA2DS2-VASc | 0.58 (0.56, 0.61) | 0.56 (0.53, 0.59) | 0.59 (0.55, 0.62) | 0.56 (0.52, 0.60) | 0.58 (0.54, 0.62) |
| Validation cohort; Events/N | 385/8548 | 306/6893 | 182/6095 | 76/1119 | 391/5697 |
| ABC-death (cTnT) | 0.77 (0.74, 0.79) | 0.76 (0.74, 0.79) | 0.72 (0.68, 0.75) | 0.77 (0.72, 0.82) | 0.77 (0.74, 0.80) |
| ABC-death (cTnI) | 0.75 (0.73, 0.78) | 0.75 (0.72, 0.78) | 0.70 (0.66, 0.74) | 0.74 (0.68, 0.79) | 0.76 (0.73, 0.79) |
| All clinical information | 0.68 (0.66, 0.71) | 0.68 (0.65, 0.71) | 0.62 (0.58, 0.66) | 0.63 (0.57, 0.69) | 0.70 (0.67, 0.73) |
| CHA2DS2-VASc | 0.59 (0.56, 0.62) | 0.59 (0.56, 0.62) | 0.57 (0.53, 0.61) | 0.53 (0.46, 0.59) | 0.61 (0.57, 0.64) |
All clinical information—a model solely consisting of clinical variables (age, gender, smoking, alcohol, prior stroke/TIA, diabetes, hypertension, heart failure, prior myocardial infarction, peripheral arterial disease, vascular disease, AF-type, and prior bleeding).
CHA2DS2-VASc—assigns 1 point each for Congestive heart failure, Hypertension, Diabetes mellitus, Vascular disease, Age 65–74 years, and Gender category (female gender), and 2 points for Age ≥ 75 years and, prior Stroke/transient ischaemic attack).
TTR, time in therapeutic range (INR 2.0–3.0); ABC-death, Age, Biomarkers (cardiac troponin, NT-proBNP, and GDF-15), Clinical history of heart failure); NOAC, non-vitamin K antagonist oral anticoagulation.
Apixaban in the derivation cohort and dabigatran in the validation cohort.
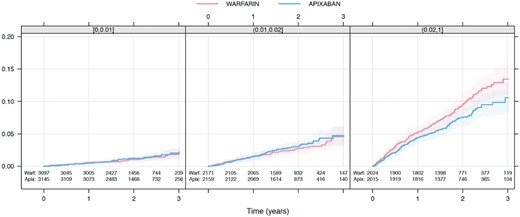
Kaplan–Meier estimated cumulative event rate by randomized treatment (colour) by predicted ABC-death risk classes (panel): 0–1%, 1–2%, and ≥2%.
ABC-death risk score with alternative biomarkers
A risk model using cTnI-hs instead of cTnT-hs was also investigated and validated. With cTnI-hs the ABC-death score achieved similar c-indices of 0.75 (95% CI 0.73–0.76) and 0.73 (95% CI 0.71–0.75) in the internal and external validation, respectively (Table 2). The nomogram for the ABC-death model using cTnI-hs is presented in Supplementary material online, Figure S6).
Finally, risk models for death and cardiovascular death without the very recent biomarker GDF-15 consisting of age, the biomarkers NT-proBNP and cTnT-hs, and clinical history of heart failure, were developed. The ABC-death score without GDF-15 performed slightly poorer than the models with GDF-15 but still consistently outperformed the comparators and remained well calibrated (see Supplementary material online, Table S3). The nomogram for the ABC-death risk score without GDF-15 is presented in Supplementary material online, Figure S7 for all-cause mortality and Supplementary material online, Figure S8 for cardiovascular mortality.
Discussion
In this study, we developed, validated, and presented a well-calibrated novel biomarker-based risk score to estimate the risk of death in two large cohorts of patients with AF receiving oral anticoagulation. The novel ABC-death score included the strongest predictors of death in patients with AF which were age, a clinical history of heart failure, and the biomarkers NT-proBNP, cTnT-hs, and GDF-15. The biomarker-based ABC-death score consistently predicted risk of all-cause and cardiovascular death with a better accuracy than a model based on all clinical information and substantially better the most widely used risk score in AF, the CHA2DS2-VASc, albeit the latter was developed for prediction of ischaemic stroke. The results were consistent when validated internally and externally as well as in several clinically relevant subgroups. Importantly, the ABC-death score also showed a good calibration and clinical usefulness based on utility analyses. Further, the ABC-death score predicted cardiovascular mortality with a consistently high accuracy and outperformed a model based on clinical information only and the CHA2DS2-VASc risk score for this outcome as well. Finally, a high ABC-death score identified the patients with the largest absolute reduction in mortality during treatment with apixaban compared with warfarin.
Clinical guidelines in AF have traditionally focused primarily on identifying patients with different risks of stroke and of major bleeding, in order to tailor the treatment to obtain the best balance between reduction in the risk of stroke and the increased risks of bleeding with oral anticoagulation. Although the new oral anticoagulants as compared to warfarin may provide both lower risks of stroke and severe bleeding, mortality still remains elevated and thereby the most common severe adverse event in patients with AF treated with oral anticoagulants.6–9 The European guidelines for the management of patients with AF accordingly recommend a holistic approach to risk factor management to improve the outcomes in AF patients.7 Besides the recently presented biomarker-based ABC-scores for stroke and bleeding, the novel ABC-death score now, for the first time, provides a model exclusively developed, and validated, to assess risk of all-cause and cardiovascular death in patients with AF on oral anticoagulation. Several prior studies have developed and examined risk scores in AF patients for stroke, bleeding, or composite outcomes (stroke and death), although not solely for death outcomes.6 , 7
In AF patients on oral anticoagulants, the major causes of deaths are heart failure and sudden cardiac death.35–38 A score to assess the risk of death in these patients may therefore identify patients with a need of more intense management of risk factors for these events such as structural heart disease, myocardial systolic or diastolic dysfunction, coronary artery disease and metabolic abnormalities. The ABC-death score may also improve the identification of patients that could benefit from a more stringent assessment of indications for cardiac resynchronization and/or implantable cardioverter defibrillator therapy in the efforts to mitigate non-thrombo-embolic risks.39–43 The ABC-death score therefore has the potential to improve counselling and provide support to treatment decisions for patients with AF. The score may also support selection of anticoagulant treatment as risk stratification with the ABC-death score indicated that the largest gain in prevention of death with apixaban as compared to warfarin were obtained in patients with intermediate to high risk.
Among the evaluated candidate variables for risk of death, the cardiovascular biomarkers were, by far, those most strongly associated with mortality. We have previously shown that all these biomarkers individually are independent risk markers for death in patients with AF on oral anticoagulation.10–13 The troponin and NT-proBNP assays are widely available internationally, and GDF-15 was recently launched. N-terminal pro B-type natriuretic peptide is a well-known marker of myocyte stress and dysfunction.10 , 27 Cardiac troponin is routinely used to assess myocardial injury and is also associated with structural heart disease, renal dysfunction, and aging.22 , 25 , 26 Growth differentiation factor-15 is a marker of cellular ageing, stress, and inflammation and has repeatedly been associated with risk of death.13 Overall, the biomarkers possess unique features as they carry the ability to provide information on silent disease states and also on disease severity, and thereby improve the prognostication.12 Recently, biomarker-based risk score models was also shown to provide accurate prognostication over time, and the clinical utility does therefore not seem to be affected by small analytical imprecisions or diurnal variations.
An additional strength of the ABC-death risk score is that there are options to use alternative biomarkers making the results immediately applicable in most hospitals. The ABC-death risk score using alternative biomarkers with cTnI-hs instead of cTnT-hs performed similarly well. Although the ABC-death score without GDF-15 performed slightly poorer than the full ABC model still it provides an opportunity for start-up of the score as GDF-15 only recently became available for routine laboratories.
In order to specifically assess the risk of death due to cardiovascular causes, the ABC-death risk score was adjusted also for this outcome. Also, this version of the score was successfully validated and well calibrated in the external cohort. The ABC-death risk score thereby provides clinicians with the opportunity to simultaneously assess risk of all-cause and cardiovascular mortality. The clinical implementation of the ABC-death score algorithm can either be based on the nomogram, or preferably based on an electronic tool integrated into electronic patient records or as an online tool, please visit www.ucr.uu.se/en/services/abc-riskcalculators. As the ABC-death risk score includes the same biomarkers as the ABC-stroke and ABC-bleeding scores, it provides complementary information concerning the risk of death, without spending additional resources. Therefore, based only on an additional computer algorithm, it may be easily implemented in clinical practice allowing simultaneous assessment of risk of all the three major outcome events in patients with AF.
Strengths and limitations
A limitation might be that the both cohorts were based on randomized clinical trial data. However, this also confers substantial strengths of the development and validation of the ABC-death risk score as it includes two large independent trial cohorts, with standardized recording of clinical characteristics, complete follow-up, and centrally adjudicated clinical outcomes, whereas the exclusion of patient with a short-life expectancy or lone AF may be a limitation. Another strength is the development and evaluation of the score in a modern AF care setting as large proportions received non-vitamin K antagonist oral anticoagulants. The efficacy of dabigatran in relation to the ABC-death score could not be reliably estimated as the sample size was smaller and further divided into three different treatment arms. Importantly, the ABC-death risk score development adhered to the recently developed TRIPOD statement and used established statistical methods for the development of the clinical prediction models.34 Finally, as with all risk scores, a prospective evaluation would be desirable with focus on cause of death in order to assess the clinical usefulness of the ABC-death score.
Conclusions
A new biomarker-based risk score for predicting risk of death in anticoagulated patients with AF was successfully developed, internally and externally validated, and shown to be well calibrated in two large independent clinical trial cohorts. The ABC-death risk score using age, heart failure, and three biomarkers (NT-proBNP, hs-troponin, and GDF-15), performed well and may assist physicians in patient education and decision-making when treating patients with AF. As these biomarkers also are parts of the previously developed ABC-stroke and ABC-bleeding scores, the novel ABC-death score may be easily implemented in clinical practice allowing the full assessment of the different spectrum of risks in patients with AF.
Supplementary material
Supplementary material is available at European Heart Journal online.
Funding
The ARISTOTLE trial was funded by Bristol-Myers Squibb, Co Princeton, NJ, USA and Pfizer Inc., New York, NY, USA and coordinated by the Duke Clinical Research Institute, Durham, NC, USA and Uppsala Clinical Research Center, Uppsala, Sweden. The RE-LY trial was funded by Boehringer-Ingelheim, Ingelheim, Germany, and coordinated by the Population Health Research Institute, Hamilton, Canada and Uppsala Clinical Research Center, Uppsala, Sweden. Bristol-Myers Squibb, Pfizer, Boehringer-Ingelheim; grants from The Swedish Foundation for Strategic Research (Grant Number RB13-0197); and Swedish Heart-Lung Foundation (20090183). Roche Diagnostics, Rotkreuz, Switzerland, provided the pre-commercial assay of GDF-15. The funding sources were given the opportunity to review and comment on the final version of the manuscript. The first (Z.H.), second (J.O.) and senior authors (L.W.) and the statistician (J.L.) were responsible for and accordingly had full access to the database. The decision on submission was made by all co-authors.
Conflict of interest: Dr Z.H.: lecture fees from Boehringer Ingelheim, Roche, Bristol-Myers Squibb and Pfizer; consulting fees from Merck Sharp & Dohme, Roche, Bristol-Myers Squibb and Pfizer. GDF-15 assays support by Roche. Dr J.O.: consulting and lecture fees from Boehringer Ingelheim, Bayer, Bristol-Myers Squibb, Pfizer. Mr J.L.: Institutional research grants from Boehringer Ingelheim, Bristol-Myers Squibb/Pfizer. Dr J.H.A.: Institutional research grants and consulting fee/honoraria from Bristol-Myers Squibb, Regado Biosciences, Merck; consulting fee/honoraria from Pfizer, AstraZeneca, Boehringer Ingelheim, Ortho-McNeil-Janssen, Polymedix, Bayer. Dr S.J.C.: consulting fees, speaker fees and research grants from Boehringer Ingelheim, Bristol-Myers Squibb, Bayer, Portola; consulting fees and research grants from Sanofi-Aventis; research grants from Boston Scientific. Dr J.W.E.: grants and honoraria from AstraZeneca, Bayer, Boehringer Ingelheim, Bristol-Myers Squibb/Pfizer, Daiichi-Sankyo, GlaxoSmithKline, Janssen, Sanofi-Aventis; honoraria from Eli Lilly. Dr M.D.E.: consulting fees from Boehringer Ingelheim, Pfizer, Sanofi, Bristol-Myers Squibb, Portola, Bayer, Daiichi-Sankyo, Medtronics, Aegerion, Merck, Johnson & Johnson, Gilead, Janssen Scientific Affairs, Pozen Inc., Amgen, Coherex, Armatheon. Dr C.H.: Institutional research grant and speaker’s bureau from AstraZeneca; institution research grants from Bristol-Myers Squibb, GlaxoSmithKline, Merck & Co, Roche. Dr E.M.H.: Advisory board member and symposium lecture fees from Bayer, Boehringer Ingelheim, Bristol-Myers Squibb; advisory board member for Daiichi Sankyo, Janssen, Medtronic, Pfizer, Portola, Armetheon. Dr R.D.L.: Institutional research grant and consulting fees from Bristol-Myers Squibb; institutional research grant from GlaxoSmithKline; consulting fees from Bayer, Boehringer Ingleheim, Pfizer, Merck, Portola. Dr S.Y.: consulting fees, lecture fees and grant support from Boehringer Ingelheim, AstraZeneca, Bristol-Myers Squibb, Sanofi-Aventis, Bayer, Cadila. Dr C.B.G.: Grants and personal fees from GlaxoSmithKline, Boehringer Ingelheim, Bristol-Myers Squibb, Pfizer, Sanofi-Aventis, Takeda, The Medicines Company, Janssen, Bayer, Hoffmann-La Roche; grants from Medtronics Foundation, Merck & Co., Armetheon; personal fees from Lilly, AstraZeneca, Daiichi Sankyo, Ross Medical Corporation, Salix Pharmaceuticals, Gilead. Dr A.S.: institutional research grants from AstraZeneca, Boehringer Ingelheim, Bristol-Myers Squibb/Pfizer, GlaxoSmithKline. Dr L.W.: institutional research grants, consultancy fees, lecture fees, and travel support from Bristol-Myers Squibb/Pfizer, AstraZeneca, GlaxoSmithKline, Boehringer Ingelheim; institutional research grants from Merck & Co, Roche; consultancy fees from Abbott; holds two patents involving GDF-15.
References
Author notes
See page 486 for the editorial comment on this article (doi: )

