


Abstract
It remains unknown whether the treatment of hypertension influences the mortality of patients diagnosed with coronavirus disease 2019 (COVID-19).
This is a retrospective observational study of all patients admitted with COVID-19 to Huo Shen Shan Hospital. The hospital was dedicated solely to the treatment of COVID-19 in Wuhan, China. Hypertension and the treatments were stratified according to the medical history or medications administrated prior to the infection. Among 2877 hospitalized patients, 29.5% (850/2877) had a history of hypertension. After adjustment for confounders, patients with hypertension had a two-fold increase in the relative risk of mortality as compared with patients without hypertension [4.0% vs. 1.1%, adjusted hazard ratio (HR) 2.12, 95% confidence interval (CI) 1.17–3.82, P = 0.013]. Patients with a history of hypertension but without antihypertensive treatment (n = 140) were associated with a significantly higher risk of mortality compared with those with antihypertensive treatments (n = 730) (7.9% vs. 3.2%, adjusted HR 2.17, 95% CI 1.03–4.57, P = 0.041). The mortality rates were similar between the renin–angiotensin–aldosterone system (RAAS) inhibitor (4/183) and non-RAAS inhibitor (19/527) cohorts (2.2% vs. 3.6%, adjusted HR 0.85, 95% CI 0.28–2.58, P = 0.774). However, in a study-level meta-analysis of four studies, the result showed that patients with RAAS inhibitor use tend to have a lower risk of mortality (relative risk 0.65, 95% CI 0.45–0.94, P = 0.20).
While hypertension and the discontinuation of antihypertensive treatment are suspected to be related to increased risk of mortality, in this retrospective observational analysis, we did not detect any harm of RAAS inhibitors in patients infected with COVID-19. However, the results should be considered as exploratory and interpreted cautiously.
Introduction
Coronavirus disease 2019 (COVID-19) is a current pandemic disease caused by the positive-sense RNA virus named severe acute respiratory syndrome coronavirus 2 (SARS-CoV-2). Along with the highly infectious capacity of the virus, the mortality rates have been reported to range from 1% to >5%.1 It has been reported that patients with COVID-19 and hypertension may have an increased risk for adverse outcomes in unadjusted epidemiological studies summarizing the characteristics of the COVID-19 epidemic in China. Despite limited sample sizes, previous studies have reported that hypertension had a hazard ratio (HR) of 1.70 [95% confidence interval (CI) 0.92–3.14] to 3.05 (95% CI 1.57–5.92) for mortality, respectively.2 , 3 However, neither of these previous studies has adjusted for confounding factors, for example, age, which is emerging as the strongest predictor of COVID-19-related death.3 , 4
Angiotensin-converting enzyme 2 (ACE2) is required for viral entry of SARS-CoV-2.5 ACE2 is widely expressed in the human body, with expression found in the gastrointestinal tract, heart, and kidney, and alveolar cells in the lungs.6 , 7 Angiotensin-converting enzyme inhibitors (ACEIs) and angiotensin receptor blockers (ARBs) are the two types of renin–angiotensin–aldosterone system (RAAS) inhibitors widely used for treating hypertension, and heart and renal failure. There are reports in animal models8 and humans9 suggesting that the expression of ACE2 may be increased after treatment with an ACEI or ARB (some reports incriminated only ARBs10), which might augment patients’ susceptibility to viral host cell entry and propagation.11 Although the effects of ACEIs or ARBs on ACE2 in humans are still inconclusive, previous findings have led to a growing concern that ACEIs or ARBs may increase (or decrease) mortality in patients with COVID-19.12 , 13 Therefore, evidence of the impact of these medications in patients with COVID-19 is urgently needed.
Here, we investigated 2877 consecutive patients admitted to Huo Shen Shan Hospital, which is a hospital dedicated solely to the treatment of COVID-19, in Wuhan, China. We tested the hypothesis that treatment of hypertension, especially with RAAS inhibitors, might impact on the mortality of patients with COVID-19.
Methods
Study design and participants
This is a retrospective observational study comparing the association of both hypertensive status and antihypertensive treatment class with mortality among hospitalized patients with COVID-19. All patients admitted to Huo Shen Shan Hospital, Wuhan, China, from 5 February to 15 March 2020, with confirmed COVID-19 were included in this study. Huo Shen Shan Hospital was opened by the government on 5 February 2020, and assigned to treat exclusively COVID-19 patients. Patients with COVID-19 included in this study were diagnosed according to World Health Organization interim guidance and Diagnosis and Treatment Protocol for Novel Coronavirus Pneumonia from the the National Health Commission of China.14 , 15 In brief, clinical manifestations of COVID-19 are defined as the development of fever and/or respiratory symptoms; computed tomography (CT) imaging showing characteristics consistent with COVID-19; or normal or decreased white blood cell (WBC) count, and normal or decreased lymphocyte count in the early stage of the disease. Patients with a suspicious epidemiological history (i.e. contact with novel coronavirus-infected people or patients from Wuhan who have fever or respiratory symptoms) plus any two clinical manifestations or no clear epidemiological history but with all three clinical manifestations were considered as possible COVID-19 case. Patients who were considered as possible COVID-19 cases, with or without laboratory confirmation of SARS-Cov-2 infection, were admitted to the Huo Shen Shan Hospital.
The confirmation of SARS-Cov-2 infection was defined as suspect cases with one of the following serological findings; (i) real-time fluorescent reverse transcription–PCR (RT–PCR) positive for new coronavirus nucleic acid; (ii) viral gene sequence highly homologous to known new coronaviruses; and (iii) SARS-Cov-2-specific IgM or IgG are detected in serum, or SARS-Cov-2-specific IgG is detectable or reaches a titration of at least a four-fold increase during convalescence compared with the acute phase.
This study was approved by the National Health Commission of China and the institutional review board at Huo Shen Shan Hospital (Wuhan, China). Written informed consent was waived by the ethics committee of the designated hospital for patients with emerging infectious diseases.
Data collection
Patients’ demographic characteristics and clinical data (symptoms, comorbidities, laboratory findings, and outcomes) during hospitalization were collected from electronic medical records by two investigators (R.Z. and Y.C). All data were independently reviewed and entered into the computer database by two analysts (C.G. and Y.C.).
Clinical endpoints
The primary endpoint was all-cause mortality during hospitalization. Other endpoints included the time elapsed between onset of symptoms and discharge, the rates of use of invasive mechanical ventilation, and the severity of COVID-19. The severity of COVID-19 was categorized as mild, severe, or critical. Mild included non-pneumonia and mild pneumonia cases. Severe was characterized by dyspnoea, respiratory frequency ≥30/min, blood oxygen saturation ≤93%, PaO2/FiO2 ratio <300, and/or lung infiltrates >50% within 24–48 h. Critical cases were defined as respiratory failure requiring mechanic ventilation, septic shock, and/or multiple organ dysfunction/failure.1 , 16 The final date of follow-up was 1 April 2020 and the median duration of follow-up (hospitalization) was 21 (12–32) days.
The diagnosis of hypertension was given by the patient’s physician prior to the infection with SARS-CoV-2. These data were collected from patients’ documented medical files (e.g. the diagnosed patients with antihypertensive drugs and blood pressure <140/90 mmHg upon admission were still identified as ‘with a history of hypertension’). There was no formal committee to adjudicate the status of hypertension; however, these diagnoses were rechecked by two individual investigators (R.Z. and Y.C) during data collection, using office systolic blood pressure ≥140 mmHg and/or diastolic blood pressure values ≥90 mmHg17 as the criteria.
Figure 1 shows the flow chart of the study. The antihypertensive regimens were in principle unchanged during hospitalization whenever the patients had previous prescriptions before admission. Discontinuation or alteration of the antihypertensive treatment during hospitalization was at the physician’s discretion. Those who required antihypertensive medication during hospitalization with no prior prescription, or those who had discontinued the medications prior to admission, were treated with calcium channel blockers (CCBs) or diuretics. The cohorts of ‘without antihypertensive’ and ‘with antihypertensive treatments’, as well as the cohorts of ‘RAAS inhibitors’ (ACEI/ARBs) and ‘non-RAAS inhibitors’ (beta-blockers, CCBs, or diuretics) , were stratified at the time of their admission and according to their pre-admission medications. There were 15 patients (no death events) taking spirolactone but were categorized in the ‘non-RAAS inhibitors’ group in the analysis. Patients were included in the RAAS inhibitor cohort whenever at least one RAAS inhibitor (an ACEI or ARB) was prescribed, disregarding whether or not they were treated with a beta-blocker, CCB, or diuretics. Nevertheless, a sensitivity analysis was performed by including patients who were treated solely with one medication (Supplementary material online, Table S3).
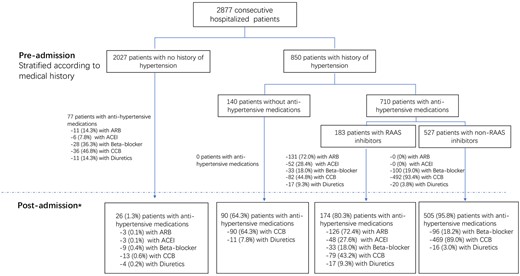
Study flow chart.
Statistical analysis
Continuous variables with normal distribution are expressed as mean ± standard deviation (SD), and those with skewed distribution are expressed as median ± interquartile range (IQR). Categorical variables are presented as counts and percentages. Means of two continuous variables were compared by independent Student’s t-test or Mann–Whitney U-test when appropriate. The frequencies of categorical variables were compared using Fisher’s exact test. Survival was estimated by the Kaplan–Meier method (Figure 2). The variances in outcomes between exposure cohorts were assessed by the multivariable Cox proportional hazards model. The covariates in the multivariable model included age (as a continuous variable), sex, medical history of diabetes, insulin-treated diabetes, myocardial infarction, treatment by percutaneous coronary intervention (PCI) or coronary artery bypass grafting (CABG), renal failure, chronic heart failure, asthma, chronic obstructive coronary disease (COPD), and stroke (as binary variables). Cox proportionality assumptions were checked by using the Schoenfeld residuals against the transformed time, and the assumptions were met in all models. There was no formal correction for multiple testing, taking into account the observational nature of the analysis.18
The details of statistical approaches for the meta-analysis are provided in Supplementary material online, Methods. Analyses were performed using the R-project (R Foundation, Vienna, Austria). A two-sided P-value <0.05 was considered as statistically significant.
Results
Participants
In total, 2877 consecutive hospitalized patients with confirmed COVID-19 were enrolled in the study. The median time from symptom onset to discharge (last follow-up) was 39 (30–50) days. Baseline characteristics are presented in Table 1. The results of the laboratory tests are presented in the Supplementary material online, Tables S6–S8. Among these patients, 29.5% (850/2877) had a medical history of hypertension. When compared with patients without hypertension, those with hypertension were older, more often had a prior history of diabetes, angina, stroke, renal failure, or previous revascularization (PCI or CABG), and were receiving more medication for diabetes and hypertension. The spectrum of symptoms of COVID-19 at admission between the two cohorts did not differ significantly.
Baseline characteristics
| Hypertension (–) (n = 2027) | Hypertension (+) (n = 850) | P-value | Antihypertension (–) (n = 140) | Antihypertension (+) (n = 710) | P-value | RAAS inhibitor (–) (n = 527) | RAAS inhibitor (+) (n = 183) | P-value | |
|---|---|---|---|---|---|---|---|---|---|
| Age, years | 55.38 (14.86) | 64.24 (11.2) | <0.001 | 64.08 (11.3) | 64.27 (11.17) | 0.433 | 64.84 (11.19) | 62.64 (11) | 0.919 |
| Male sex | 1027 (50.7%) | 443 (52.1%) | 0.487 | 73 (52.1%) | 370 (52.1%) | 1 | 266 (50.5%) | 104 (56.8%) | 0.145 |
| Symptoms at admission | |||||||||
| Fever | 1492 (73.6%) | 611 (71.9%) | 0.357 | 97 (69.3%) | 514 (72.4%) | 0.472 | 385 (73.1%) | 129 (70.5%) | 0.503 |
| Cough | 1405 (69.3%) | 585 (68.8%) | 0.791 | 103 (73.6%) | 482 (67.9%) | 0.196 | 356 (67.6%) | 126 (68.9%) | 0.783 |
| Fatigue | 1090 (53.8%) | 471 (55.4%) | 0.436 | 73 (52.1%) | 398 (56.1%) | 0.404 | 300 (56.9%) | 98 (53.6%) | 0.438 |
| Muscle ache | 667 (32.9%) | 248 (29.2%) | 0.054 | 45 (32.1%) | 203 (28.6%) | 0.416 | 160 (30.4%) | 43 (23.5%) | 0.087 |
| Headache | 40 (2.0%) | 18 (2.1%) | 0.773 | 2 (1.4%) | 16 (2.3%) | 0.752 | 12 (2.3%) | 4 (2.2%) | 1 |
| Haemoptysis | 11 (0.54%) | 2 (0.2%) | 0.368 | 0 (0%) | 2 (0.3%) | 1 | 2 (0.4%) | 0 (0%) | 1 |
| Shortness of breath | 904 (44.6%) | 399 (46.9%) | 0.251 | 66 (47.1%) | 333 (46.9%) | 1 | 248 (47.1%) | 85 (46.5%) | 0.932 |
| Chest pain | 36 (1.8%) | 21 (2.5%) | 0.241 | 4 (2.9%) | 17 (2.4%) | 0.765 | 15 (2.9%) | 2 (1.1%) | 0.263 |
| Diarrhoea | 94 (4.6%) | 44 (5.2%) | 0.566 | 11 (7.9%) | 33 (4.7%) | 0.141 | 23 (4.4%) | 10 (5.5%) | 0.544 |
| Shivering | 31 (1.5%) | 20 (2.4%) | 0.162 | 6 (4.3%) | 14 (2%) | 0.121 | 14 (2.7%) | 0 (0%) | 0.026 |
| Blood pressure at admission (mmHg) | |||||||||
| Systolic | 126 (118, 135) | 136 (125, 150) | <0.001 | 137 (125–152) | 136 (125–150) | 0.902 | 136 (125–150) | 136 (125–152) | 0.934 |
| Diastolic | 80 (73, 87) | 83.5 (76, 91) | <0.001 | 84.5 (77–92) | 83 (76–91) | 0.644 | 83 (76–91) | 84 (76–92) | 0.894 |
| Heart rate (b.p.m.) | 86.76 (13.4) | 86.77 (13.3) | 0.988 | 85.72 (13.32) | 86.97 (13.23) | 0.872 | 87.19 (13.17) | 86.35 (13.4) | 0.896 |
| Respiratory rate (per/min) | 20.25 (2.5) | 20.45 (2.8) | 0.057 | 20.32 (2.63) | 20.48 (2.8) | 0.667 | 20.54 (2.85) | 20.3 (2.64) | 0.815 |
| Medical history | |||||||||
| Diabetes | 159 (7.8%) | 228 (26.8%) | <0.001 | 33 (23.6%) | 195 (27.5%) | 0.404 | 140 (26.6%) | 55 (30.1%) | 0.387 |
| Myocardial angina | 83 (4.1%) | 138 (16.2%) | <0.001 | 26 (18.6%) | 112 (15.8%) | 0.452 | 80 (15.2%) | 32 (17.5%) | 0.481 |
| Myocardial infarction | 8 (0.4%) | 4 (0.5%) | 0.757 | 1 (0.7%) | 3 (0.4%) | 0.514 | 3 (0.6%) | 0 (0%) | 0.573 |
| PCI/CABG | 21 (1.0%) | 41 (4.8%) | <0.001 | 4 (2.9%) | 37 (5.2%) | 0.286 | 28 (5.3%) | 9 (4.9%) | 1.000 |
| Peripheral vascular disease | 0 (0%) | 2 (0.2%) | 0.087 | 0 (0%) | 2 (0.3%) | 1.000 | 1 (0.2%) | 1 (0.6%) | 0.449 |
| Chronic heart failure | 13 (0.6%) | 10 (1.2%) | 0.215 | 1 (0.7%) | 9 (1.3%) | 0.900 | 8 (1.5%) | 1 (0.5%) | 0.530 |
| Stroke | 20 (1.0%) | 32 (3.8%) | <0.001 | 6 (4.3%) | 26 (3.7%) | 0.634 | 20 (3.8%) | 6 (3.3%) | 1.000 |
| Renal failure | 11 (0.5%) | 18 (2.1%) | <0.001 | 6 (4.3%) | 12 (1.7%) | 0.098 | 10 (1.9%) | 2 (1.1%) | 0.740 |
| Chronic obstructive pulmonary disease | 20 (1.0%) | 11 (1.3%) | 0.437 | 2 (1.4%) | 9 (1.3%) | 0.700 | 8 (1.5%) | 1 (0.6%) | 0.460 |
| Pneumonia | 23 (1.1%) | 13 (1.5%) | 0.365 | 3 (2.1%) | 10 (1.4%) | 0.459 | 8 (1.5%) | 2 (1.1%) | 1.000 |
| Obstructive sleep apnoea | 2 (0.1%) | 0 (0.0%) | 0.888 | 0 (0.0%) | 0 (0.0%) | NA | 0 (0%) | 0 (0%) | NA |
| Asthma | 17 (0.8%) | 5 (0.6%) | 0.639 | 1 (0.7%) | 4 (0.6%) | 1.000 | 3 (0.6%) | 1 (0.5%) | 1.000 |
| Cancer | 34 (1.7%) | 15 (1.8%) | 0.875 | 1 (0.7%) | 14 (2%) | 0.487 | 9 (1.7%) | 5 (2.7%) | 0.368 |
| Alcoholism | 91 (4.5%) | 33 (3.9%) | 0.546 | 4 (2.9%) | 29 (4.1%) | 0.635 | 20 (3.8%) | 9 (4.9%) | 0.518 |
| Smoking | 133 (6.6%) | 57 (6.7%) | 0.870 | 10 (7.1%) | 47 (6.6%) | 0.853 | 33 (6.3%) | 14 (7.7%) | 0.494 |
There were 710/850 (83.5%) patients with hypertension taking antihypertensive medications. The medical history, symptoms onset, and blood pressure at admission did not differ significantly between patients with no antihypertensive medications and those with medications, except that patients with antihypertensive medications were treated more often with oral medication for diabetes. There were 183 (25.7%) patients treated with RAAS inhibitors and 527 (74.2%) treated with beta-blockers, CCBs, or diuretics (non-RAAS inhibitors) (Supplementary material online, Table S1). The medical history and blood pressure at admission did not differ significantly between the RAAS inhibitor-treated [RAASi (+)] and non-RAAS inhibitor-treated patients [RAASi (–)]. There were 14 patients who reported shivering at admission in the RAASi (–) cohort, compared with none in the RAASi (+) cohort (Table 1).
Outcomes of the patients
A total of 34/850 (4.0%) patients died in the hypertension cohort and 22/2027 (1.1%) died in the no hypertension cohort (crude HR 3.75, 95% CI 2.19–6.41, P < 0.001; Figure 1A). After adjustment for confounders, hypertension was still associated with a two-fold increase in the risk of mortality as compared with no hypertension (adjusted HR 2.12, 95% CI 1.17–3.82, P = 0.013; Table 2). The time from symptom onset to discharge was comparable between the two cohorts; however, patients with hypertension had the propensity to develop more severe/critical COVID-19 disease (P for trend < 0.001) and were more likely to receive invasive mechanical ventilation (P < 0.001) (Table 3).
Comparison of mortality between cohorts
| Hypertension | No history of hypertension | HR (95% CI) | P-value | |
|---|---|---|---|---|
| 34/850 (4.0%) | 22/2027 (1.1%) | Unadjusted | 3.75 (2.19–6.41) | <0.001 |
| Adjusted | 2.06 (1.10–3.83) | 0.023 | ||
| Propensity score adjusted | 3.45 (1.39–8.55) | 0.008 | ||
| No antihypertensive treatment | Antihypertensive treatment | HR (95% CI) | P-value | |
| 11/140 (7.9%) | 23/710 (3.2%) | Unadjusted | 2.52 (1.23–5.17) | 0.012 |
| Adjusted | 2.24 (1.05–4.76) | 0.037 | ||
| Propensity score adjusted | 2.43 (1.01–5.38) | 0.028 | ||
| RAAS inhibitors | Non-RAAS inhibitors | HR (95% CI) | P-value | |
| 4/183 (2.2%) | 19/527 (3.6%) | Unadjusted | 0.60 (0.20–1.76) | 0.354 |
| Adjusted | 0.85 (0.28–2.58) | 0.774 | ||
| Propensity score adjusted | 0.93 (0.31–2.84) | 0.901 |
Adjusted for age, sex, medical history of diabetes, insulin-treated diabetes, myocardial infarction, underwent PCI/CABG, renal failure, stroke, heart failure, and COPD.
Comparison of clinical outcomes between cohorts
| Time from symptom onset to discharge [median (IQR), days] | Severity of COVID-19 | Invasive mechanical ventilation | ||||||||
|---|---|---|---|---|---|---|---|---|---|---|
| Overall cases | P-value | Severe/ critical cases | P-value | Mild | Severe | Critical | P for trend | No. of ventilations (%) | P-value | |
| No history of hypertension | 39 (30–50) | 0.263 | 41 (30–52) | 0.003 | 1578 (77.8%) | 431 (21.3%) | 18 (0.9%) | <0.001 | 26 (1.3%) | <0.001 |
| Hypertension | 40 (30–49) | 44 (34–56) | 555 (65.3%) | 270 (31.8%) | 25 (2.9%) | 39 (4.6%) | ||||
| No antihypertensive treatment | 39 (30–46) | 0.538 | 42 (31–52) | 0.014 | 98 (70%) | 37 (26.4%) | 5 (3.6%) | 0.331 | 9 (6.4%) | 0.268 |
| Antihypertensive treatment | 40 (31–50) | 35 (21–48) | 457 (64.4%) | 233 (32.8%) | 20 (2.8%) | 30 (4.2%) | ||||
| Non-RAAS inhibitors | 40 (31–49) | 0.372 | 46 (36–56) | 0.004 | 348 (66.0%) | 161 (30.6%) | 18 (3.4%) | 0.372 | 25 (4.7%) | 0.292 |
| RAAS inhibitors | 42 (33–51) | 40 (30–50) | 109 (59.6%) | 72 (39.3%) | 2 (1.1%) | 5 (2.7%) | ||||
For the patients with hypertension, those without antihypertensive treatment (11/140) had a significantly higher rate of mortality compared with those with antihypertensive (23/710) treatments (7.9% vs. 3.2%, HR 2.52, 95% CI 1.23–5.17, P = 0.012; Figure 1B; Table 2). After adjustment, the risk of mortality was still higher in patients without antihypertensive treatment (HR 2.17, 95% CI 1.03–4.57, P = 0.041).
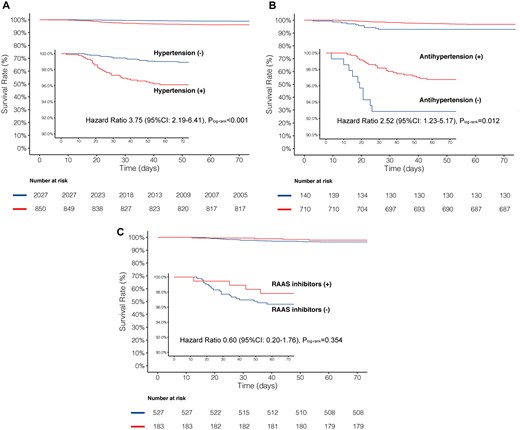
Kaplan–Meier survival curves for mortality from the time of symptom onset. (A) Patients with or without hypertension, (B) patients with or without antihypertensive treatment, (C) patients with ACEI/ARBs (RAAS inhibitors), or beta-blocker, CCB, or diuretics (non-RAAS inhibitors),
There were 183 (25.7%) patients treated with RAAS inhibitors and 527 (74.2%) with beta-blockers, CCBs, or diuretics (non-RAAS inhibitors). The numerical difference in rates of mortality between the RAAS inhibitor and non-RAAS inhibitor cohorts were non-significant before or after adjustment (2.2% vs. 3.6%, adjusted HR 0.85, 95% CI 0.28–2.58, P = 0.774). The time from symptom onset to discharge, the severity of the COVID-19, and percentage of ventilation were all similar between the two cohorts.
To understand whether ACEIs and ARBs had distinct effects on outcomes, we have also compared the influence of ACEIs and ARBs with those of non-RAAS inhibitors. Compared with non-RAAS inhibitors, the risks of mortality in patients with ARBs or ACEIs were both numerically lower. Since the sample size was small in both groups, any results could be largely due to play of chance; however, these results did not show an obvious propensity that ARBs and ACEIs had an adverse HR (>1) as far as the mortality is concerned (Supplementary material online, Table S2).
Comparison of characteristics between patients who survived and those who died
To further explore the potential risk factors for mortality, we performed a multivariable Cox regression analysis with backwards-stepwise selection to identify the predictors of mortality. A total of seven variables were identified, namely fatigue, age, hypertension, myocardial infarction, renal failure, respiratory rate, and chronic heart failure. These results are shown in the Supplementary material online, Tables S4 and S5; Figure S1.
Meta-analysis
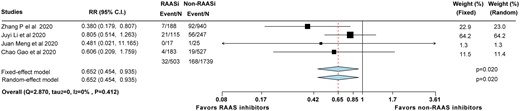
Most recently, there are three other groups in China who have reported their data regarding the influence of RAAS inhibitors in COVID-19 patients. We have summarized all the available data in a meta-analysis.19–21 Together with our current data, we found that compared with non-RAAS inhibitors, RAAS inhibitors were associated with a lower risk of mortality (relative risk 0.65; 95% CI, 0.45–0.94, P = 0.02), regardless of the model used.
Discussion
The main findings of this analysis can be summarized as follows: (i) after adjustment for confounders and compared with the non-hypertensive patients, the hypertensive patients continued to demonstrate a two-fold relative increase in the risk of COVID-19 mortality; (ii) the patients with a history of hypertension but without antihypertensive treatment were associated with a significantly higher risk of mortality compared with those with antihypertensive treatments; and (iii) the relative rates of mortality, the severity of COVID-19, and percentages of ventilation were not statistically different between the patients treated with RAAS inhibitors and non-RAAS inhibitors. However, in the meta-analysis, RAAS inhibitors tend to be associated with a lower risk of mortality.
Patients with COVID-19 and hypertension have been reported to have an increased risk of adverse outcomes. Chen et al. suggested that chronic hypertension was more frequent among patients who died compared with recovered patients.22 In line with this finding, Wu et al. found that hypertension has an HR of 1.70 for death in 201 patients with COVID-19,2 and Zhou et al. found hypertension had an HR of 3.05 for in-hospital mortality in 191 patients with COVID-19.3 Meanwhile, there was also a study which enrolled 416 patients which suggested that after the adjustment for confounders, hypertension was no longer an independent risk factor for COVID-19.23 In the current study, we found that after adjustment for confounders, patients with hypertension still had a significantly two-fold higher risk of mortality when compared with patients with no hypertension.
So far, there is limited clinical evidence demonstrating that antihypertensive treatments could influence the prognosis of COVID-19. Despite the lack of evidence, the Council on Hypertension of the European Society of Cardiology (ESC) recommends that physicians and patients should continue treatment with their usual antihypertensive therapy.24 Our analysis showed that patients with antihypertensive treatments pre-admission had a lower rate of mortality compared with those without treatment of hypertension. These data support ESC’s recommendation stating that patients should not discontinue or change their antihypertensive treatment, unless instructed by a physician.
Recently ACE2 has been identified to be necessary for viral entry for SARS-CoV-2. As ACE generates angiotensin II from angiotensin I, ACE2 degrades angiotensin II to angiotensin (1-7), which, after binding to the Mas receptor, shifts the balance from vasoconstriction with angiotensin II to vasodilation. Under normal circumstances, the circulating levels of soluble ACE2 are low and the functional role of ACE2 in the lungs appears to be relatively limited,25 but may be up-regulated with certain medications or clinical states. This has led to a two-fold concern whereby ACEIs and ARBs might affect the severity and mortality of COVID-19.12 , 13 One is that ACEIs could directly inhibit ACE2. However, despite substantial structural homology between ACE and ACE2, their enzyme active sites are distinct. As a result, ACEIs in clinical use do not directly affect ACE2 functions.26
In addition, there is the concern that the use of ACEIs and ARBs will increase the expression of ACE28 and therefore increase patient susceptibility to viral host cell entry and propagation. Conflicting and limited evidence stemming from laboratory or clinical studies has shown changes in serum or pulmonary ACE2 levels in response to ACEIs or ARBs.12 However, even if an ACEI or ARB could actually modify ACE2 levels or activity (or both) in target tissue beds, evidence is still lacking to indicate whether this would facilitate greater involvement of spike protein and cell entry of SARS-CoV-2.
Given the uncertainty due to lack of clinical data, there are both advocates and objectors toward the use of RAAS inhibitors during the COVID-19 pandemic. In our study, we found that the risks of mortality after adjustment were not significantly different between RAAS inhibitors and non-RAAS inhibitors. Furthermore, after pooling with previously published data19–21 in a study-level meta-analysis, we found that patients with RAAS inhibitor use were possibly associated with a lower risk of mortality (Take home figure).
Forest plot of the meta-analysis showing the mortality rates of those receiving RAAS inhibitors and non-RAAS inhibitors.
The underlying mechanism of why patients could eventually benefit from RAAS inhibitors during COVID-19 is putative. However, results from laboratory studies reported that after the initial engagement of SARS-CoV-1 spike protein, ACE2 abundance was down-regulated on cell surfaces.27 The down-regulation of ACE2 and the dysregulation of its activity in the lungs may facilitate the initial neutrophil infiltration in response to bacterial endotoxin and may result in unopposed angiotensin II accumulation and local RAAS activation.28 An animal study has also shown that in mouse models, exposure to SARS-CoV-1 spike protein induced acute lung injury, which is limited by RAAS blockade.27 Therefore, some researchers have hypothesized that high ACE2 expression could be deleterious during the contamination phase, whereas the high ACE2 expression could, in contrast, be beneficial during the inflammation phase27 and may possibly prevent organ injury in COVID-19.29 , 30 To further verify our results, as well as this hypothesis, we have also designed a randomized controlled trial, which is ongoing, investigating this issue (NCT04330300).
As described above, these data showed that untreated hypertensive patients are at the highest risk. There are remaining questions: (i) which kind of medication should be given to those patients (CCBs or RAAS inhibitors); (ii) could such medications mitigate the risk of these patients; and (iii) will the use of RAAS inhibitors affect the risk of infection when equally exposed to the virus?
Limitations
The multivariable-adjusted Cox proportional hazard models were performed in an attempt to estimate the true treatment effects of antihypertensive medications. However, the usual deficiency of observational studies exists, such as the inability to include all relevant confounders, especially those unmeasured, causing bias that cannot be adjusted.
Although the current study enrolled 2877 patients, to our knowledge so far one of the largest cohorts reported, only 183 patients with RAAS inhibitors and 527 patients with non-RAAS inhibitors were compared. Statistically underpowered, our findings should be interpreted cautiously.
As a retrospective study, some data such as electrocardiogram and echocardiography were not recorded in detail in the study owing to the limitations imposed in the isolation ward and the urgency of containing the COVID-19 epidemic.
The data in this study permit a short-term assessment of the clinical outcomes of the impact of antihypertensive treatments. Long-term prospective studies investigating the effects of these treatments are still needed.
Conclusion
While hypertension is independently associated with mortality from COVID-19, the discontinuation of the antihypertensive treatment is suspected to be associated with an increased risk of mortality. Patients with RAAS inhibitors were not exposed to a higher risk of mortality in our study and, after pooling previously published data in a study-level meta-analysis, the use of RAAS inhibitors was shown to be possibly associated with lower risk of mortality. Nevertheless, due to the observational nature of the study, the results should be interpreted cautiously and considered as no obvious additional risk to continue RAAS inhibitors in patients with COVID-19 infection.
Conflict of interest: none declared.
References
World Health Organization. Clinical Management of Severe Acute Respiratory Infection when Novel Coronavirus (nCoV) Infection is Suspected. https://www.who.int/publications-detail/clinical-managementof-severe-acute-respiratory-infection-when-novelcoronavirus-(ncov)-infection-is-suspected.
China National Health Commission. Diagnosis and Treatment Protocol for COVID-19. https://www.chinadaily.com.cn/pdf/2020/1.Clinical.Protocols.for.the.Diagnosis.and.Treatment.of.COVID-19.V7.pdf.
Novel Coronavirus Pneumonia Emergency Response Epidemiology Team. Vital Surveillances: The Epidemiological Characteristics of an Outbreak of 2019 Novel Coronavirus Diseases (COVID-19) -China,
Hypertension ECo. Position Statement of the ESC Council on Hypertension on ACE-Inhibitors and Angiotensin Receptor Blockers. https://www.escardio.org/Councils/Council-on-Hypertension-(CHT)/News/position-statement-of-the-esc-council-on-hypertension-on-ace-inhibitors-and-ang.
Author notes
Chao Gao, Yue Cai and Kan Zhang contributed equally to this work.

