


Abstract
Little is known about the impact of daily physical activity timing (here referred to as ‘chronoactivity’) on cardiovascular disease (CVD) risk. We aimed to examined the associations between chronoactivity and multiple CVD outcomes in the UK Biobank.
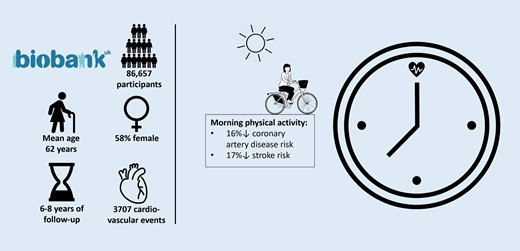
physical activity data were collected in the UK-Biobank through triaxial accelerometer over a 7-day measurement period. We used K-means clustering to create clusters of participants with similar chronoactivity irrespective of the mean daily intensity of the physical activity. Multivariable-adjusted Cox-proportional hazard models were used to estimate hazard ratios (HRs) comparing the different clusters adjusted for age and sex (model 1), and baseline cardiovascular risk factors (model 2). Additional stratified analyses were done by sex, mean activity level, and self-reported sleep chronotype. We included 86 657 individuals (58% female, mean age: 61.6 [SD: 7.8] years, mean BMI: 26.6 [4.5] kg/m2). Over a follow-up period of 6 years, 3707 incident CVD events were reported. Overall, participants with a tendency of late morning physical activity had a lower risk of incident coronary artery disease (HR: 0.84, 95%CI: 0.77, 0.92) and stroke (HR: 0.83, 95%CI: 0.70, 0.98) compared to participants with a midday pattern of physical activity. These effects were more pronounced in women (P-value for interaction = 0.001). We did not find evidence favouring effect modification by total activity level and sleep chronotype.
Irrespective of total physical activity, morning physical activity was associated with lower risks of incident cardiovascular diseases, highlighting the potential importance of chronoactivity in CVD prevention.
Introduction
Cardiovascular disease (CVD) is the most common cause of death worldwide.1,2 Prevalence of CVD is projected to rise even further as a result of, amongst others, physical inactivity, obesity, diabetes mellitus, hypertension, high cholesterol and lipid levels and numbers of individuals reaching old age.1,3,4 Physical activity is an important stepping stone to healthy ageing and—in theory—easily adjustable for most individuals.5,6 In contrast, according to the World Heart Federation, physical inactivity, which is becoming increasingly prevalent in our sedentary society, is the fourth leading risk factor for mortality.6 Moreover, sufficient physical activity can reduce cardiovascular mortality risk and improve quality of life.3,7 Large population-based studies have consistently shown an inverse association between increased physical activity and risk of CVD.5,8–12 For this reason, current guidelines and interventions aim to reduce sedentary behaviour and increase daily physical activity.
Current guidelines recommend 150–300 min of moderate intensity physical activity (defined as three to six times the intensity of rest or >1.5 metabolic equivalents) or 75–150 min of vigorous physical activity (defined as 6 or more times the intensity of rest or >1.5 metabolic equivalents) per week for adults and older adults to maintain and improve cardiorespiratory fitness and overall health.13 In addition to the intensity and duration of habitual physical activity, there is increasing evidence including from mouse studies suggesting that the timing of physical activity during the day or ‘chronoactivity’ is an independent determinant for CVD risk.14,15 Recent studies in humans underlined a possible influence of the timing of physical activity and other behavioural factors (e.g. food intake and light exposure) on weight control, cardiometabolic, and cardiovascular health.4,14,16–22 This new insight is the result of evolving analysis of accelerometry data enabling the identification of patterns of physical activity, and by the increasing interest and evidence on the interaction between the circadian clock and lifestyle behaviours.23,24 Although the amount of evidence is limited, a small number of studies showed that cardiometabolic health is not only influenced by duration, frequency, and intensity of physical activity, but is also independently affected by timing of the behaviour.4,14
Despite promising results, human studies on physical activity timing were either relatively small or based on homogeneous study populations, and yet no prospective studies have been conducted.25 Gaining novel insights on this topic, allows tailoring of current guidelines and interventions and help identify risk profiles of physical activity timing for CVD. Therefore, this study aims to examine the association between intraday patterns of physical activity and CVD incidence in a large study population which enables additional subgroup analyses.
Methods
Study design and population
The present study was conducted using data collected from the UK-Biobank population, a large, open-access, population-based, prospective cohort study including 502 490 participants aged 40–69 years when recruited in 2006–2010. Extensive phenotypic and genotypic details about its participants were and are continuously collected across the entire United Kingdom with ongoing longitudinal follow-up for many health-related outcomes. De-identified data are available for researchers that sign a material transfer agreement, undertaking to use data only for the purposes of the approved research and not to attempt to identify any participant in order to keep personal data secure.26,27 The UK-biobank study was approved by the North-West Multi-center Research Ethics Committee (MREC). Access for information to invite participants was approved by the Patient Information Advisory Group (PIAG) for England and Wales. All participants in the UK Biobank provided a written informed consent. The present study was accepted under project number 81 423.
In a substantial subset of 103 684 participants from UK Biobank, a second assessment round was performed after follow-up during which accelerometer data for the assessment of hourly objective physical activity levels was collected. For this sample, we excluded 3223 (3.1%) participants because of data quality issues; participants who either had less than three measurement days,27,28 more than eight hourly acceleration values that equalled zero, or had unrealistically high acceleration values (daily mean acceleration adjusted for non-wear time bias equal to or more than 100 mg). Finally, we excluded 13 804 (13.3%) participants with CVD history which was defined as incident CVD (according to diagnosis in the Hospital Episode Statistics (HES) before the accelerometer wear period date (ranging from 1 July 2013 to 23 December 2015), leaving a total of 86 657 (83.6%) participants for the analysis.
Exposure
Assessment of physical activity
Between February 2013 and December 2015, a group of participants who had provided a valid email address were invited to wear an accelerometer for seven consecutive days. Participant email addresses were chosen randomly and participants were sent the accelerometer after accepting the invitation.27 As mentioned earlier, a total of 103 684 participants were included in this accelerometer subsample. Objective physical activity was assessed using the Axivity AX3 wrist-worn triaxial accelerometer, a commercial version of the Open Movement AX3 open source sensor (https://github.com/digitalinteraction/openmovement) designed by Open Lab, Newcastle University.27,29 The device measured triaxial acceleration data over a 7 day period at 100 Hz with a dynamic range of + −8 g. Calibration of the acceleration signals was performed according to the procedure described before29 to ensure similar output across devices.27 Acceleration is presented in milligravity (mg) (1 mg = 0.00981 m/s2). Thresholds for activity intensities were: inactivity, < 30 mg; light, 30–99 mg; moderate, 100–399 mg; vigorous, ≥ 400 mg.30 Participants were informed to wear the accelerometer continuously on their dominant wrist and to carry out their normal daily activities.
In the present study, 24 h means of all measurement days were used. To group participants in clusters based on physical activity timing, we used K-means clustering analysis using the 24 h means. In order to assure that clusters would not be a representation of participants level of physical activity intensity, yet rather depict clusters of physical activity timing, we calculated relative acceleration by dividing each hourly mean by each individual total day acceleration mean (adjusted for non-wear time bias). Prior to the clustering analysis, a Within Sum of Squares (WSS) plot was made to determine the number of clusters that should be taken into account in the K-means analysis.
Assessment of cardiovascular disease
CVD was defined as coronary artery disease (CAD) or cerebrovascular disease according to the International Classification of Diseases (ICD) edition 10. CAD cases were defined as angina pectoris (I20), myocardial infarction (MI) (I21 and I22), and acute and chronic ischaemic heart disease (IHD) (I24 and I25). Stroke cases are defined as I64, ischaemic stroke as I63.9 and haemorrhagic stroke as I61.9. In the present analysis, ischaemic and haemorrhagic stroke were analysed jointly (as ‘stroke’) and ischaemic stroke was analysed as a separate disease outcome. Incidence of CVD was defined as the first hospital admission or CVD-related death identified from linkages to the national death index and HES.26 Incidence of CAD, stroke, and ischaemic stroke was monitored through linkage of the self-reported data, hospital admissions data, and data collected from the general practitioner. Participants were followed until the onset of one of these diseases, loss to follow-up, death, or the end of the study (1 January 2021), whichever came first.
Covariates
Body mass index (BMI) was constructed from height and weight measured during the initial assessment centre visit. Data on smoking status, alcohol intake frequency, cholesterol, and blood pressure lowering medication and chronotype were collected by questionnaire at the moment of the study inclusion in the UK Biobank. Chronotype was assessed through a single questions that asked, ‘Do you consider yourself to be’.26,31
Statistical analyses
Descriptive statistics were computed for the total population and for each chronoactivity cluster. Characteristics of the study population were presented as mean (with standard deviation, SD) for continuous data or No. (%) for categorical data.
As a first analysis, we examined the associations between hourly mean relative physical activity (in SD units) and CVD using Cox-proportional hazard model, adjusted for age and sex. For our second analysis, based on these hourly objective physical activity levels in a population free from CAD or stroke at baseline, a data-driven K-means clustering analysis was performed to identify clusters of individuals with a similar pattern of chronoactivity independent of the mean daily physical activity level (to prevent clusters purely reflect the intensity of the daily mean physical activity). The clusters representing participants with different timing patterns determined from the WSS plot and K-means analysis were used as independent variables in multivariable-adjusted Cox-proportional hazards regression models. The cluster representing an average relative acceleration pattern which best represented the average acceleration of the entire UK-Biobank population and was the largest group, was used as reference. We used two adjustment models; model 1, in which we adjusted for age and sex, and model 2, in which we additionally adjusted for baseline BMI, smoking status (never, former, or current), Townsend deprivation index,32 the baseline self-reported use of cholesterol lowering medication, and blood pressure lowering medication. We only added characteristics to the statistical model that can clearly confound the association between physical activity timing and incident CVD risk. Other characteristics, like blood pressure and cholesterol levels, are more likely to be mediators rather than confounding factors. We analysed these variables in a separate model as it was unclear at this moment whether these factors were confounders or possible mediators. Moreover, we conducted stratified analysis by sex, mean daily physical activity level, and by self-reported chronotype. Participants were divided into two activity groups; less active (mean acceleration ≤27.23 mg), or more active (mean acceleration >27.23 mg). For the chronotype stratified analysis, participants were divided into two groups; morning chronotype (participants who characterised themselves as ‘definitely a morning person’ or ‘more a morning person than an evening person’), and evening chronotype (participants who characterised themselves as ‘definitely an evening person’ or ‘more an evening person than a morning person’).
R v4.0.3 statistical software was used to perform all statistical analyses.33 Results are presented as the hazard ratio (HR) with accompanying 95% confidence interval (CI).
Results
Participant characteristics
Participant characteristics are shown in Table 1. A total of 86 657 participants were included. The mean age of the total population was 61.6 (SD: 7.8) years at the accelerometer measurement period. The majority of participants were women (57.6%). On average, participants were overweight with a mean BMI of 26.6 (SD: 4.5) kg/m2. Most participants reported themselves as morning person (56.8%). A total of 12 489 (14.4%) participants used blood pressure lowering medication.
Participant characteristics
| Total population | |
|---|---|
| No. | 86 657 |
| Age, mean (SD), years | 61.6 (7.8) |
| Age groups, No. (%) | |
| ȃ40–49 | 21 170 (24) |
| ȃ50–59 | 32 026 (37) |
| ȃ60–69 | 33 212 (38) |
| ȃ70+ | 253 (0.3) |
| Female Sex, No. (%) | 49 902 (58) |
| BMI, mean (SD), kg/m2 | 26.6 (4.5) |
| Average acceleration, mean (SD), mg | 28.2 (8.7) |
| Sleep chronotype, No. (%) | |
| ȃMorning person | 49 193 (57) |
| ȃEvening person | 28 381 (33) |
| ȃUnknown | 9083 (11) |
| TDI, median (IQR) | −2.5 (−3.8, −0.3) |
| Smoking status, No. (%) | |
| ȃNever | 50 450 (58) |
| ȃPrevious | 30 172 (35) |
| ȃCurrent | 5812 (7) |
| Alcohol intake frequency, No. (%) | |
| ȃNever | 4662 (5) |
| ȃ< 3 × per week | 39 249 (45) |
| ȃ≥ 3 × per week | 42 679 (49) |
| Familial CVD history, No. (%) | 23 186 (27) |
| Bloodpressure, mean (SD), mmHg | |
| ȃDiastolic | 81.7 (10.6) |
| ȃSystolic | 138.3 (19.2) |
| Cholesterol, mean (SD), mmoL/L | 5.8 (1.1) |
| ȃHDL | 1.5 (0.4) |
| ȃLDL | 3.6 (0.8) |
| ȃTryglycerides | 1.7 (1.0) |
| Bloodpressure medication, No. (%) | 12 489 (14) |
| Cholesterol medication, No. (%) | 9368 (11) |
BMI, body mass index; TDI, Townsend deprivation index; CVD, Cardio vascular disease; HDL, high-density lipoprotein; LDL, low-density lipoprotein. Participant characteristics of study population from the UK-Biobank. Data presented as number n proportion (%); mean (SD); median (25th–75th percentile).
Hourly relative physical activity in relation to incident cardiovascular disease
During follow-up, 2911 participants developed CAD, and 796 participants developed a stroke. Risk patterns for CAD, stroke and ischaemic stroke were identified by investigating their associations with the 24 standardized hourly means of relative physical activity. For the risk of CAD (Figure 1A), stroke (Figure 1B), and ischaemic stroke (Figure 1C), a clear pattern is visible in which high relative physical activity during the nightly hours (12:00 p.m.–6:00 a.m.) was associated with higher risks, and high relative physical activity during morning hours (8:00–11:00 a.m.) was associated with lower risks.
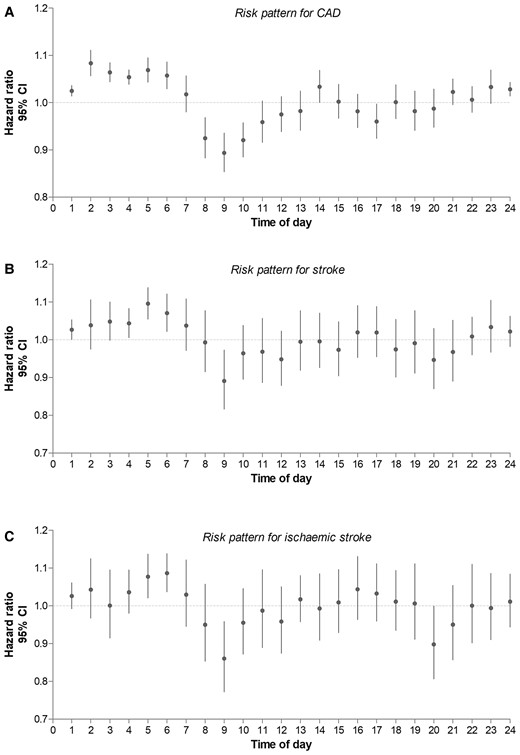
Hourly physical activity and cardiovascular disease risk pattern. Risk on incident CVD per mean physical activity per hour of the total study population. Adjustment model 1 was used for this analysis. (A) shows the risk on incident coronary artery disease (CAD), (B) shows the risk on incident stroke, and (C) shows the risk on incident ischaemic stroke.
Clusters of physical activity and their characteristics
Based on the WSS plot (see Supplementary material online, eFigure S1), we determined that optimal intra- and inter-cluster variance was reached with four clusters. Figure 2 shows the chronoactivity pattern per cluster. Cluster 1, being the largest in sample size, represents an ‘average pattern of physical activity’ closest to the average pattern of physical activity of the entire UK-Biobank acceleration subgroup (see Supplementary material online, eFigure S2). Cluster 2 represents a group of individuals with a pattern of ‘early morning physical activity peak’, cluster 3 represents a pattern of ‘late morning physical activity peak’, and cluster 4 represents a pattern of ‘evening physical activity peak’. Participant characteristics per cluster are shown in Table 2.Chronoactivity and cardiovascular disease
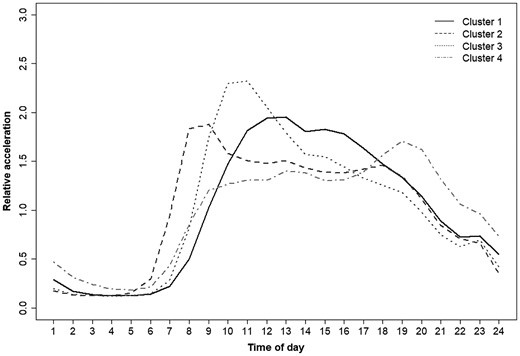
Pattern clusters of relative acceleration. Mean relative physical activity pattern per cluster. Relative acceleration shown in milligravity (mg). Definitions cluster: cluster 1; average pattern of acceleration close to the average pattern of absolute acceleration of the total UK-Biobank population, cluster 2; ‘early morning peak’, cluster 3; ‘late morning peak’, cluster 4; ‘evening peak’.
Participant characteristics per chronoactivity cluster
| Cluster 1 | Cluster 2 | Cluster 3 | Cluster 4 | |
|---|---|---|---|---|
| No. | 27 552 | 19 843 | 22 648 | 16 614 |
| Age, mean (SD), years | 63.0 (7.1) | 59.2 (7.9) | 64.7 (6.9) | 57.7 (7.6) |
| Age groups, No. (%) | ||||
| ȃ40–49 | 4565 (17) | 6909 (35) | 2623 (12) | 7071 (43) |
| ȃ50–59 | 10 799 (39) | 7623 (38) | 7439 (33) | 6163 (37) |
| ȃ60–69 | 12 097 (44) | 5272 (27) | 12 484 (55) | 3359 (20) |
| ȃ0+ | 91 (0.3) | 39 (0.2) | 102 (0.5) | 21 (0.1) |
| Female Sex, No. (%) | 15 941 (58) | 11 286 (57) | 13 480 (60) | 9195 (55) |
| BMI, mean (SD), kg/m2 | 26.7 (4.4) | 26.5 (4.6) | 26.4 (4.2) | 26.6 (4.8) |
| Average acceleration, mean (SD), mg | 27.6 (8.0) | 29.5 (8.7) | 27.8 (8.3) | 28.1 (10.0) |
| Sleep chronotype, No. (%) | ||||
| ȃMorning person | 13 095 (48) | 14 074 (71) | 14 926 (66) | 7098 (43) |
| ȃEvening person | 11 333 (41) | 4001 (20) | 5351 (24) | 7696 (46) |
| ȃunknown | 3124 (11) | 1756 (9) | 2371 (11) | 1819 (11) |
| TDI, median (IQR) | −2.6 (−3.9, −0.5) | −2.3 (−3.7, 0) | −2.8 (−4, −0.9) | −2.2 (−3.7, 0.4) |
| Smoking status, No. (%) | ||||
| ȃNever | 15 436 (56) | 12 018 (61) | 12 977 (57) | 10 019 (60) |
| ȃPrevious | 9969 (36) | 6553 (33) | 8491 (38) | 5159 (31) |
| ȃCurrent | 2077 (8) | 1223 (6) | 1109 (5) | 1403 (8) |
| Alcohol intake frequency, No. (%) | ||||
| ȃNever | 1310 (5) | 1215 (6) | 1161 (5) | 976 (6) |
| ȃ< 3 × per week | 14 216 (52) | 9046 (46) | 11 468 (51) | 7949 (48) |
| ȃ≥ 3 × per week | 12 008 (44) | 9567 (48) | 9998 (44) | 7676 (46) |
| Familial CVD history, No. (%) | 7661 (28) | 5086 (26) | 6360 (28) | 4079 (24) |
| Bloodpressure, mean (SD), mmHg | ||||
| ȃDiastolic | 81.9 (10.5) | 81.5 (10.7) | 82.0 (10.5) | 81.0 (10.7) |
| ȃSystolic | 139.4 (19.1) | 136.6 (18.8) | 141.2 (19.5) | 134.6 (18.4) |
| Cholesterol, mean (SD), mmoL/L | 5.8 (1.1) | 5.7 (1.1) | 5.9 (1.1) | 5.7 (1.1) |
| ȃHDL | 1.5 (0.4) | 1.5 (0.4) | 1.5 (0.4) | 1.5 (0.4) |
| ȃLDL | 3.6 (0.8) | 3.5 (0.8) | 3.7 (0.8) | 3.5 (0.8) |
| ȃTryglycerides | 1.4 (1, 2.1) | 1.4 (1, 2) | 1.4 (1, 2) | 1.4 (1, 2) |
| Bloodpressure medication, No. (%) | 4296 (16) | 2440 (12) | 3985 (18) | 1768 (11) |
| Cholesterol medication, No. (%) | 3349 (12) | 1723 (9) | 3016 (13) | 1280 (8) |
BMI, body mass index; TDI, Townsend deprivation index; CVD, Cardio vascular disease; HDL, high-density lipoprotein; LDL, low-density lipoprotein. Participant characteristics of study population from the UK-Biobank. Characteristics show Chronoactivity cluster. Data presented as number n proportion (%); mean (SD); median (25th-–75th percentile).
Definitions cluster: cluster 1; average pattern of acceleration close to the average pattern of absolute acceleration of the total UK-Biobank population, cluster 2; ‘early morning peak’, cluster 3; ‘late morning peak’, cluster 4; ‘evening peak’
Figure 3 illustrates the associations between the clusters of physical activity timing and risk of the CVD outcome variables in the total population and provides a visual representation of the associations. After adjusting for age and sex, participants who were most active in the early morning or late morning, had a lower risk of incident CAD (HR 0.89; [95% CI 0.80, 0.99]; HR 0.84; [95% CI 0.77, 0.92], respectively) compared to the reference group (cluster 1). In addition, participants with a tendency of late morning physical activity had an 17% [HR 0.83; (95%CI 0.70, 0.98)] decreased risk of any incident stroke and a 21% decreased risk of incident ischaemic stroke [HR 0.79; (95% CI 0.64, 0.97)] compared with the reference group. The results derived from the additionally adjusted model 2 were directionally consistent, yet some of the effect sizes attenuated to some extent (see Supplementary material online, eTable S1).
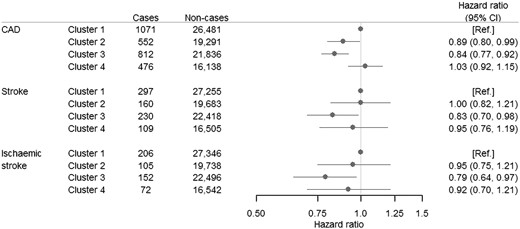
Associations between physical activity timing and cardiovascular disease. HR, Hazard Ratio; CAD, coronary artery disease; CI confidence interval. Hazard ratios for CAD, stroke, and ischaemic stroke incidence for every chronoactivity cluster in the total study population. Cox-proportional hazard models were adjusted for age and sex. Definitions cluster: cluster 1; average pattern of acceleration close to the average pattern of absolute acceleration of the total UK-Biobank population, cluster 2; ‘early morning peak’, cluster 3; ‘late morning peak’, cluster 4; ‘evening peak’.
Stratified analyses
Sex
Both adjustment models showed a considerable decreased risk of CAD for women (see Supplementary material online, eFigure S3 and eTable S2) in both the early (model 1: HR 0.73; [95% CI 0.61, 0.87], model 2: HR 0.78; [95% CI 0.62, 0.97]) and late morning (model 1: HR 0.77; [95% CI 0.66, 0.89], model 2: HR 0.76; [95% CI 0.63, 0.92]) physical activity peak clusters compared to participants in the reference group. In men, we observed no difference in risk between early morning physical activity and the reference group (model 1: HR 0.99 [95% CI 0.87, 1.13], model 2: HR 1.08 [95% CI 0.92, 1.27]) for the early morning group (P-value for interaction between men and women = 0.001). We observed no evidence favouring differences in between men and women in the late morning and evening group in CAD (P-value for interaction = 0.18, 0.16, respectively).
Total physical activity
In the stratified analysis for total physical activity within each cluster (see Supplementary material online, eFigure S4 and eTable S3), the number of incident CVD cases in the less active group is considerably higher than in the more active group (2311 cases vs. 1396 cases). Less active participants who were most active in the late morning had a significantly decreased risk of CAD incident [HR 0.83; (95% CI 0.74, 0.93)] with similar results in the fully adjusted model. In the more physically active group, we observed a lower risk of CAD incident in participants with a tendency to early morning activity compared with the reference group [HR 0.82; (95% CI 0.69, 0.96)]. We did not observe differences between the less- and more-active groups in the association between the clusters and incident CVD (P-values for interaction > 0.05; Supplementary material online, eFigure S4).
Chronotype
Individuals with a self-reported morning chronotype who were most active in the early morning had a 14% [HR 0.86; (95% CI 0.76, 0.99)] decreased risk of CAD compared to the reference group. (see Supplementary material online, eFigure S5 and eTable S4). Additionally, individuals with a self-reported morning chronotype who were most active in the late morning, had a 16% [HR 0.84; (95% CI 0.74, 0.95)] lower risk of CAD incident compared with the reference group. Similar directions and effect sizes were noticeable for participants who were more active in the early morning. Furthermore, high physical activity in the late morning was also associated with lower stroke incident risk [HR 0.73; (95% CI 0.58, 0.92)] in morning chronotypes. We observed a difference in risk for stroke between morning and evening chronotypes in the late morning and evening group (P-value for interaction = 0.04, 0.02, respectively).
Discussion
This prospective observational study identified several distinct physical activity timing subgroups in the general UK population, resembling participants with distinct types of chronoactivity. We found that participants who were most active in the morning, independent of their total mean daily physical activity level, had a lower risk of incident CAD and stroke.
Physical activity remains one of the most distinct cornerstones in CVD prevention.1,4 The present study adds to the previous evidence4 that timing of physical activity is an additional independent contributing factor to CVD risk, and therefore adds a novel dimension to CVD risk prevention. Most notably, we observed that participants with the highest daily physical activity performed during the late morning, had a 16% decreased risk of CAD and a 17% decreased risk of stroke compared with participants who best represented the average (midday) pattern of acceleration of the UK-Biobank population.
Various studies in mice and in humans were done that support the findings from our study. For example, Sato et al.15 found that in mice, time of exercise is a critical factor to amplify the beneficial impact of exercise on metabolic pathways in skeletal muscle and systemic energy homeostasis which in turn are associated with CVD incidence.34 Specifically, they found decreased muscle and blood glucose levels only after early active phase (i.e. in the morning) exercise.15 In addition to this finding, Sato and colleagues also found enhanced transcription of genes involved in glycolysis in mice that exercised in the early active phase as well as a robust activation of the hypoxia-inducible factor 1α (HIF1α) pathway in skeletal muscles. This pathway contributes to activation of glycolysis rather than oxidative phosphorylation under hypoxic conditions during exercise. Next to the metabolic influence, HIF1α also coordinates circadian clock activity which makes it plausible that this pathway could be one of the underlying mechanisms of the seemingly positive effect of morning activity in humans as well.15 In human studies, there are several studies that have shown associations between morning physical activity and better (cardio)metabolic health.14,22,25,35 For instance, an improved postprandial metabolic response, which is associated with lower CVD risk, was observed in overweight and obese men (n = 10) that performed physical exercise in the morning.36,37 Additionally, middle aged to older men with diabetes mellitus type 2 (n = 2153) who performed most moderate to vigorous physical activity in the morning were found to have the highest cardiorespiratory fitness compared with other timing groups.4
However, there are also a number of studies showing opposite findings. Brito et al. showed that evening exercise was associated with better heart rate recovery and decreased blood pressure than morning exercise.38 Moreover, Savikj et al. showed that in diabetic (type II) men, afternoon exercise was more efficacious for improving blood glucose levels than morning exercise. Savikj and colleagues additionally stated that morning exercise had an acute deleterious effect on blood glucose levels.20 This contrariety could be partly explained by (1) different study outcomes, (2) different measurement methods and definitions of physical activity, and (3) small sample sizes in which the studies have been conducted. Nevertheless, it is important to extend this new concept of chronoactivity with further research.
In the stratified analyses, we saw that the results of the total population were mostly driven by the women in the population since most associations disappeared in the stratified analyses for men. These differences might be partially explained by the sex-specific differences in disease etiology and pathophysiology of CVD.39 However, we were not able to specify a biological mechanism explaining these differences in the current study, as we considered this beyond the scope of the research. Furthermore, when we tested for effect modification by total mean physical activity level, we found no differences between the two groups indicating that the association between specific timing of physical activity with CVD is independent of total physical activity levels. Moreover, we did not find differences in effect between morning and evening chronotypes. In this study, evening chronotypes seem to have as much benefits from morning physical activity as morning chronotypes. Yet, studies have shown that chronotype impacts the optimal timing of physical activity.34 We did however see higher numbers of CVD cases in the evening group which is in line with previous literature.40 Since chronotype as well as CVD are closely linked to and strongly affected by circadian rhythm and an association would be probable, more research on this topic is recommended.
This study has several strengths including its large sample size and well-characterised cohort from UK Biobank. Moreover, physical activity was objectively collected in the UK Biobank, and we used a data-driven clustering method to identify chronoactivity subgroups which is more likely to represent the natural behavioural rhythms of our participant than predefined timing periods that have been used previously. Finally, we were able to examine the influence of chronotype on the association between chronoactivity and CVD incidence. The study also has some limitations. First, data on nutritional intake and chrononutrition (i.e. timing of nutritional intake was not available). Since the known impact of chrononutrition on the circadian clock and the presumed interplay between timing of lifestyle behaviours,16 it would be valuable to collect these data in future research. Second, due to the design of the UK Biobank, we were not able to retrieve the nature of the observed acceleration (e.g. leisure or work-related activity). Although having this information may lead to a better understanding of the observed association, according to the latest WHO report on physical activity, there is no effect difference between leisure of work-related activity on health.6 Third, participants characteristics and health covariables were collected at baseline which took place some years before the accelerometer measurement period. This could likely have introduced some measurement error and misclassification of the exposure at the moment of the accelerometer assessment. Fourth, accelerometer was only collected for seven days at baseline, and therefore does not take into account possible changes of physical activity timing during follow-up. Yet, Keadle and colleagues showed high intraclass correlation for physical activity and sedentary behaviour between two 7-day accelerometer measurement periods of 2–3 years apart highlighting the reproducibility and representativeness of a 7-day measurement period.41 Finally, some of the variables that we have corrected for in model 2, could either be mediators or confounders. Unfortunately, since these variables were collected several years before the accelerometer measurement period, we were not able to perform mediation analyses to sort this out. Therefore, they could lie in the causal pathway of the associations. Besides, given the observational nature of the study, we cannot rule out that residual confounding plays a role in our observations and we were not able to examine the causal relationship of this association. It is important to keep this in mind when interpreting the results from this study, especially those from the second adjustment model. Despite these limitations, this study adds to the rather unexplored field of research by its strengths and encourages future research on the causal relation between chronoactivity and CVD risk. When future studies are able to replicate our results as well as to demonstrate the direct health benefits of morning physical activity, societal challenges might influence the implementation of morning physical activity to benefit overall public health as previous research already demonstrated timing of physical activity influences already the participation rate in studies.42
In conclusion, our study showed that a greater proportion of physical activity in the morning was associated with lower CVD risk irrespective of the average total physical activity. This study provides the first evidence from a large population-based database and presents the novel term chronoactivity as well as insights on the seemingly positive effects of morning physical activity on the risk of CVD. When being validated and extensively metabolically characterized, these present results might suggest that time-dependent physical activity interventions might be an added beneficial behavioural factor to reach maximum health benefits and to lower the risk of CVD.
Authors’ contribution
G.A., D.v.H., D.v.B., and R.N. conceptualised the study. G.A. performed the data analysis. G.A., M.S., D.v.H., D.v.B., J.W.J., D.E.A., and R.N. contributed to the interpretation of the data. D.v.H., D.v.B., and R.N. contributed to the funding acquisition. The drafting of the initial version of the paper was done by G.A. and R.N. All authors critically revised the paper for important intellectual content. All authors read and approved the final paper.
Supplementary material
Supplementary material is available at European Journal of Preventive Cardiology online.
Acknowledgements
The present study has been conducted using the UK-Biobank Resource (Application Number 81423) that is available to researchers.
Funding
The present work was supported by a grant from the Dutch Research Council (NWO, Dutch National Research Agenda, Research along routes by consortia, 2021–2026, BioClock: the circadian clock in modern society; to D.v.H. and D.v.B.). In addition, this study was supported by an innovation grant from the Dutch Heart Foundation (2019T103, to R.N.).
Availability of data and materials
Data from the UK Biobank are available to researchers by application via the UK-Biobank online Access Management System.
References
Author notes
Conflict of interest: None declared.

Comments
I can I have difficulties to imagine that a person that has a biology clock of evening people, will benefit by forcing themselves to be very active in the morning, which causes more stress in its own point
. I think there’s also a very large bias by the fact that people who start to move in the morning , simply generally move more overall. Even if you try to go, this virus is very difficult to exclude out of your figures, especially while the difference between your groups is a very very small.
Yours sincerely,
Dr.Myriam Struyven