


Abstract
Arts for health interventions are an accepted option for medical management of mental wellbeing in health care. Updated findings are presented from a prospective longitudinal follow-up (observational) design study of an arts on referral programme in UK general practice, over a 7-year period (2009–2016).
Primary care process and mental wellbeing outcomes were investigated, including progress through the intervention, changes in mental wellbeing, and factors associated with those outcomes. A total of n =1297 patients were referred to an eight or 10-week intervention over a period from 2009 to 2016. Patient sociodemographic information was recorded at baseline, and patient progress (e.g. attendance) assessed throughout the intervention.
Of all referrals, 51.7% completed their course of prescribed art (the intervention). Of those that attended, 74.7% engaged with the intervention as rated by the artists leading the courses. A significant increase in wellbeing was observed from pre- to post-intervention (t = −19.29, df =523, P < 0.001, two-tailed) for those that completed and/or engaged. A sub sample (N =103) of these referrals self-reported multi-morbidities. These multiple health care service users were majority completers (79.6%), and were rated as having engaged (81.0%). This group also had a significant increase in well-being, although this was smaller than for the group as a whole (t = −7.38, df =68, P < 0.001).
Findings confirm that art interventions can be effective in the promotion of well-being for those that complete, including those referred with multi-morbidity, with significant changes in wellbeing evident across the intervention periods.
Introduction
Arts-for-health interventions have become a popular, and accepted treatment option in health care1–3 and also more recently, in social prescribing.4–6 Their value has been recognised by all stakeholders in these programmes including: recipients of the intervention (i.e. patients, service users), health professionals and art providers.7,8 A developing evidence for their value comes from a range of health care settings and population groups including mental health services,9,10 primary care,11–13 older peoples’ residential care14,15 and specific clinical groups such as cancer16 and stroke.17,18 With the development of social prescribing their prevalence is likely to increase.19–22
The evidence is, however, based on studies with low participant numbers and from evaluations of short-term interventions. Bungay and Clift’s (2010) review of practice in the UK concluded that arts on referral has potential for supporting recovery, and also in addressing some of the factors known to contribute to serious illness with their related social and economic costs.6 However since that publication, to date, only two studies have been published with evidence relating to arts on referral interventions in primary care, despite the rise of art and its use in primary health care.2 The two studies published include one with a participant number of 20212 (on which this study builds), and a mixed-methods study23 with 44 participants included in the quantitative arm. The dearth of quantitative peer-reviewed articles in this area hinders the further development of arts for health improvement within primary care.
The present study draws on an arts-on-referral scheme (the intervention) from the south west of England over a 7-year period. This study builds on the 2012 study,12 which included 202 participants, data collected between 2009 and 2011. The present study, with greater participant numbers (N =1297), has enabled us to undertake a wider analysis of the wellbeing outcomes from the intervention, the process outcomes, and the associations with those outcomes, and the findings allow for the development of evidence based recommendations for providers and commissioners of arts-on-referral schemes in primary care.
Methods
Participants and procedure
Patients were recruited to the intervention by their GP or other health professional, using a specifically designed referral form. Forms were completed, and patients were then contacted to initiate the intervention. Data were anonymised by a unique identification number on each form completed by patients or referring practitioners, these were collated into participant packs to ensure accurate data linkage at inputting. The dataset comprised all patients referred (N = 1297) between 2009 and 2016. The intervention was either an eight or 10-week art programme delivered by an artist within a GP surgery. A range of visual and creative arts were offered (e.g. poetry, ceramics, drawing, mosaic and painting). Most programmes took place within surgeries; however, some were based in community facilities. Patients attended a programme with the same artist (the duration was 10 weeks from 2009 until August 2013 when it changed to 8 weeks to enable more patients to access the programme). Group size was between three and 10 patients, depending on space, number of referrals and art type.
Design
A prospective longitudinal follow-up (observational) design was employed, where patient data were collected by the artists at baseline, including: age, sex, place of residence/home (postcode), type of referral (i.e. first or re-referral), referral reason, referring health professional, artist, art form (e.g. poetry) and surgery attended. These variables have known associations with process and wellbeing outcomes. The wellbeing outcome, the Warwick–Edinburgh Mental Well-being Scale (WEMWBS),24 was completed by all patients pre-intervention (week 1) and by the sample of completing patients post-intervention (week 8 or 10). Uptake, attendance, and completion data were also collected, forming the process outcomes, where attendance reflected the actual number of attendances out of a total of eight or 10 (e.g. one per week over the eight or 10 weeks). ‘Completion’ for this study was objectively defined as attending the first and last session (e.g. week 1, and week 8 or 10). Patients were categorised as either not attending (i.e. referred but did not attend), non-completion (i.e. referred and attended one or more sessions) and completion (i.e. referred and attending at least week 1, and week 8 or 10). In addition, subjectively, the artists rated the degree of patient engagement (non-completion, partial completion or completion) dependent on their perception of patient engagement in the programme rather than the actual objective attendances.
Measurements
These data were collected through the anonymised patient referral form, WEMWBS, a patient satisfaction survey form, and an artist’s checklist. WEMWBS was adopted because it is recommended for use at population level,24 and in previous art interventions of this nature12,23 including within social prescribing.22,25 The patient referral form provided information concerning the patients’ demographic information, and their reasons for referral. Patients could be referred for any of up to seven reasons, these are detailed in table 1. Postcode data were used to assign an Index of Multiple Deprivation (IMD) score for patients, a method used in similar referral for health interventions.12,26 IMD data is based on the income, employment, health and disability, education, barriers to housing and services, crime and living environment domains of the relevant postcodes (Department for Communities and Local Government 2011). The IMD provides a well-established indication of participant’s socioeconomic status, based on the area in which they live (Office for National Statistics 2011). The IMD for each patient was determined (based on their postcode) from 2015 master data held by The Department for Communities and Local Government.
Demographic profile of patients referred for Artlift, including attendance, engagement and wellbeing variables
| Variable | N (%) | |
|---|---|---|
| Sex (female) | 980 (77.0) | |
| Occupation | Retired | 289 (25.1) |
| In Education | 18 (1.6) | |
| Working | 200 (17.4) | |
| Not Working | 507 (44.0) | |
| Not Stated | 137 (11.9) | |
| IMD Quintiles | 0–20% most deprived | 155 (13.0) |
| 20–40% | 217 (18.3) | |
| 40–60% | 278 (23.4) | |
| 20–40% least deprived | 237 (19.9) | |
| 0–20% least deprived | 302 (25.4) | |
| Reason for referral (Yes) | Reduce stress/anxiety/depression | 1018 (80.6) |
| Improve self-esteem/confidence | 854 (67.6) | |
| Improve social networks | 751 (59.5) | |
| Help alleviate symptoms of chronic pain or illness | 473 (37.5) | |
| Distraction from behaviour related health issues | 305 (24.2) | |
| Improve overall wellbeing | 938 (74.3) | |
| Support following loss or major life change | 299 (23.7) | |
| Referring professional | General Practitioner (GP) | 425 (38.4) |
| Other | 681 (61.6) | |
| Year of attendance | 2009 | 64 (7.9) |
| 2010 | 104 (12.8) | |
| 2011 | 98 (12.0) | |
| 2012 | 89 (10.9) | |
| 2013 | 88 (10.8) | |
| 2014 | 104 (12.8) | |
| 2015 | 168 (20.6) | |
| 2016 | 815 (12.3) | |
| Course engagement | Non-Completer | 188 (20.0) |
| Partial Completer | 50 (5.3) | |
| Completer | 701 (74.7) | |
| Type of art | Visual arts (painting, drawing, print making) | 770 (70.4) |
| Other (writing, textiles, mosaics, singing) | 323 (29.6) | |
| Multiple category self-reported medical conditions | 103 (47.2) | |
| Attendance | Completer | 651 (51.7) |
| Partial Completer | 10 (0.8) | |
| Non-Completer | 157 (12.5) | |
| Non-Attendee | 440 (35.0) | |
Analysis
Group differences were explored using Pearson chi-square tests and one-way ANOVA. Wellbeing outcomes (pre- and post-WEMWBS data) were explored using paired-sample t-test. Effect size analyses of t-tests were carried out using Cohen’s d, with a final range of d =0.63–0.68, constituting a medium effect size for all wellbeing change comparisons.27 All analyses were carried out using SPSS version 23 (IBM).
Results
Sample characteristics
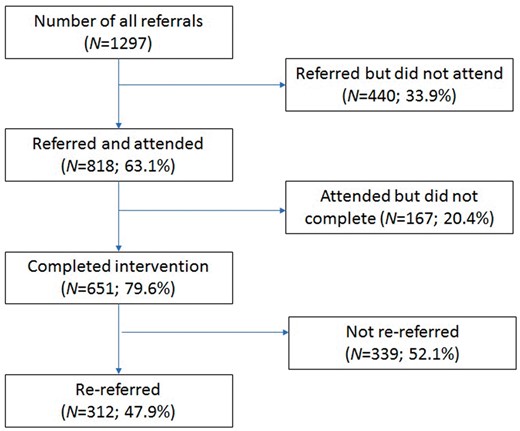
A total of 1297 patient referrals to the intervention were recorded between 2009 and 2016, and a summary of participant characteristics can be found in table 1. The majority of participants were female (77.0%), had a mean age of 51.1 (SD ±15.87) years at year of referral and were not working (44.0%). The IMD quintiles exhibited a reasonably balanced distribution, with slightly greater proportions in the median and upper quintiles. Of the 1297 referred individuals, 818 (63.1%) attended, and of these 651 (97.6% of the attenders, 51.7% of the whole sample) completed (see figure 1). Analysing the sample by attendance, 651 participants (51.7%) completed, 157 (12.5%) attended but did not complete, and 440 (35.0%) did not attend.
Patient progress through the intervention
Group differences for attendance and engagement categories
Comparing those that attended with all others (partial completers, non-completers, non-attendees), there were group differences in occupation (χ2(8) = 24.87, P = 0.002), mean number of referral reasons (F(2, 1215) = 9.14, P < 0.001), and the length of the referral course (χ2 (1) = 25.09, P < 0.001). There are significant differences between those that attend, and do not attend by referral reason., Those that did not attend were referred more frequently for the reasons of: reducing stress/anxiety or depression (χ2 (1)=25.09, P < 0.001); improving self-esteem or confidence (χ2 (1) = 17.22, P < 0.001); improving social networks (χ2 (1) = 12.34, P < 0.001); and for distraction from health behaviour related issues (χ2 (1) = 10.95, P < 0.001). A summary of the attendance groups can be found in table 2.
Group differences between those that completed and all others (partial- and non-completers and non-attendees)
| Variable | Attenders N (%) | Non-Attenders N (%) | Test of Group Differences | |
|---|---|---|---|---|
| 651 (50.2) | 607 (46.8) | |||
| Sex (female) | 509 (79.2) | 448 (73.8) | χ2 (2) = 3.94, P = 0.139 | |
| Mean age (SD) | 51.9 (15.88) | 49.3 (15.35) | F(1, 752) = 3.83, P = 0.051 | |
| Occupation | Retired | 191 (30.5) | 92 (18.8) | χ2 (4) = 21.40, P < 0.001 |
| In Education | 7 (1.1) | 11 (2.2) | ||
| Working | 107 (17.1) | 91 (18.6) | ||
| Not Working | 252 (40.3) | 232 (47.4) | ||
| Not Stated | 69 (11.0) | 63 (12.9) | ||
| IMD Quintiles | 0-20% most deprived | 64 (10.7) | 90 (16.0) | χ2 (4) = 9.4, P = 0.052 |
| 20–40% | 102 (17.0) | 107 (19.1) | ||
| 40–60% | 144 (24.0) | 123 (21.9) | ||
| 20–40% least deprived | 128 (21.3) | 105 (18.7) | ||
| 0–20% least deprived | 162 (27.0) | 136 (24.2) | ||
| Reason for referral (Yes) | Reduce stress/anxiety/depression | 494 (77.6) | 500 (84.6) | χ2 (1) = 9.88, P = 0.002 |
| Improve self-esteem/confidence | 396 (62.2) | 433 (73.3) | χ2 (1) = 17.22, P < 0.001 | |
| Improve social networks | 349 (54.8) | 382 (64.6) | χ2 (1) = 12.34, P < 0.001 | |
| Help alleviate symptoms of chronic pain or illness | 227 (35.6) | 232 (39.3) | χ2 (1) = 1.72, P = 0.195 | |
| Distraction from behaviour related health issues | 130 (20.4) | 168 (28.5) | χ2 (1) = 10.95, P < 0.001 | |
| Improve overall wellbeing | 468 (73.5) | 447 (73.6) | χ2 (1) = 0.85, P = 0.359 | |
| Support following loss or major life change | 155 (24.4) | 137 (23.2) | χ2 (1) = 0.22, P = 0.639 | |
| Mean number of referral reasons (SD) | 3.5 (1.59) | 3.9 (1.62) | F(1, 1225) = 19.87, P < 0.001 | |
| Referring professional | GP | 223 (41.4) | 195 (36.5) | χ2 (1) = 2.66, P = 0.104 |
| Other | 316 (58.6) | 339 (63.5) | ||
| Length of course | 8 weeks | 284 (63.4) | 62 (40.3) | χ2 (1) = 25.09, P < 0.001 |
| 10 weeks | 164 (36.6) | 92 (59.7) | ||
| Referral type | None | 12 (1.9) | 6 (1.0) | χ2 (7) = 28.80, P < 0.001 |
| Psychosocial | 8 (1.3) | 6 (1.0) | ||
| Mental health | 92 (14.5) | 51 (8.6) | ||
| Physical health | 17 (2.7) | 14 (2.4) | ||
| Psychosocial & Mental health | 244 (34.4) | 204 (34.6) | ||
| Psychosocial & Physical health | 7 (1.1) | 1 (0.2) | ||
| Mental health & Physical health | 54 (8.5) | 33 (5.6) | ||
| All categories | 222 (34.9) | 275 (46.6) | ||
| Course engagement | Non-Completer | 8 (1.3) | 177 (64.1) | χ2 (2) = 614.17, P < 0.001 |
| Partial Completer | 5 (0.8) | 43 (15.6) | ||
| Completer | 627 (98.0) | 56 (20.3) | ||
| Mean WEMWBS Score | Pre | 38.1 (9.79) | 35.1 (8.69) | F(1, 785) = 12.89, P < 0.001 |
| Post | 44.6 (9.85) | 42.8 (12.93) | F(1, 559) = 0.39, P = 0.535 | |
| Change | 6.5 (7.74) | 12.0 (16.18) | F(1, 531) = 3.79, P = 0.052 | |
Notes: Significant differences highlighted in bold. Differences in degrees of freedom reflective of missing data.
Referral reasons may be multiple for each patient, so we re-categorised the referral reasons to three broad categories: psychosocial (improving self-esteem or confidence; improving social networks); mental health (reducing stress/anxiety or depression; increasing overall wellbeing; support following loss or major life change); and physical health (help alleviate symptoms of chronic pain or illness; distraction from health behaviour related issues). Most participants were referred for reasons that feel within all categories (N =508, 40.3%), followed by referrals for both psychosocial and mental health reasons (N =442, 35.1%). There were group differences between the attendance groups, with more non-attenders being referred for all categories (χ2(7) = 28.80, P < 0.001).
Of those that attended at least one session, the artist rated these according to their perception of their engagement with the activity, with 701 (74.7%) rated as ‘engaged’, and 188 (20.0%) rated as ‘non-engaged’. The findings agree with those for attendance, with group differences for occupation (χ2(4) = 14.51, P = 0.006), and mean number of referral reasons (F(1, 858) = 6.33, P = 0.012). The majority of those classed objectively as completers in attendance were also subjectively rated as attenders by the artists (N =627, 98.3%).
Wellbeing
At baseline, there were significant differences in the WEMWBS scores across attendance groups (F(1, 785) = 12.89, P < 0.001), with those that completed reporting higher baseline scores, in and across engagement groups (F(1, 754) = 4.82, P = 0.028), with those that were classed as engaged reporting higher scores. Change scores (follow-up—baseline) indicate that participants that attended showed a significant increase in WEMWBS scores (38.1 ± 9.59 vs. 44.6 ± 9.84, t = −19.29, df =523, P < 0.001). Similarly, those that were assessed to be engaged also showed a significant increase in WEMWBS scores (38.0 ± 9.61 vs. 44.6 ± 9.79, t = −19.58, df =526, P < 0.001). Across all participants, including all attendance and engagement categories, there is an overall significant increase in wellbeing scores (37.8 ± 9.63 vs. 44.4 ± 9.98, t = −19.45, df =546, P < 0.001).
Multi-morbidity
As part of the self-report questionnaire, participants were given the opportunity to complete a free-text field that asked respondents if they had any medical conditions. Not all participants complete this field, but of those that have (N =222) we sought to understand the efficacy of Artlift in those that report multiple medical complaints across a variety of categories (e.g. metabolic, neoplastic, cardiovascular). Of these participants, a sub-sample (N =103, 46.4%) can be classed as being multi-morbid (i.e. more than two categories). The majority of these were female (82.5%), were not working (51.0%), and had a mean age of 53.2 (±14.08 years). This sub-sample tended to be from the least deprived quintile of the IMD (28.4%), however representation from each quintile was reasonably balanced. Referrals for Artlift were mostly made by health service professionals other than GPs (72.2%), and the typical activity was with visual arts (68.8%). The majority of this subsample were classed as completers (79.6%), and engaged (81.0%). Total WEMWBS score changes from pre- to post in those participants with multi-morbidity showed a significant increase (36.7 ± 9.94 vs. 42.8 ± 9.32, t = −7.38, df =68, P < 0.001). This score is more modest than in the cohort as a whole, however a clear difference is seen, evidencing improvement in this clinically important group.
Process changes
During the course of this longitudinal observational study, the Artlift intervention was adjusted in two ways at two defined points in time; intervention duration (10 to 8 weeks), and referral mechanism. The adjustments to the intervention were implemented in a way that allowed investigation of the potential effect of the adjustment.
We sought to understand whether the reduction from a 10 to 8-week duration had an impact on outcomes, comparing these groups on each of the available variables. Of these comparisons, the only significant findings were that those participants referred for an 8-week intervention were more likely to be completers than those that were referred for 10 weeks (χ2(1) = 25.09, P < 0.001), were more likely to engage (χ2(2) = 12.67, P = 0.002), and had greater changes in their wellbeing scores (8 week course: 37.8 ± 9.18 vs. 43.9 ± 9.65, t =−12.44, df =222, P < 0.001; 10-week course: 38.6 ± 10.19 vs. 45.7 ± 10.62 t =−9.62, df =141, P < 0.001). This indicates that the reduction in duration may be beneficial for patients, encouraging higher participation and engagement, resulting in greater wellbeing change.
The second adjustment that was made to the intervention concerned the mechanism by which patients were referred. This process became centralised, and allowed patients more freedom to choose a course to attend based on locality, art type and timing. To explore potential effects of these changes we split the sample to examine differences before and after this intervention adjustment. Of those referred patients starting the intervention, 397 patients (49.2%) started before the adjustment and 410 (50.8%) started after. Comparing these groups, there was a significant difference in engagement (χ2(2) = 12.29, P = 0.002), with higher engagement being observed in those referred after the mechanism change (57.1%) compared with before (42.9%). Comparing wellbeing scores, we saw similar rates of wellbeing change in groups both before (37.5 ± 10.34 vs. 44.4 ± 10.56, t =−13.03, df =222, P < 0.001) and after (38.3 ± 8.95 vs. 44.6 ± 9.65, t =−13.33, df =261, P < 0.001) the adjustment. Therefore, following the adjustment, participants engaged more but wellbeing outcomes were not affected.
Discussion
The present longitudinal observational study explores the process and wellbeing outcomes, and factors associated with those outcomes, for one of the largest arts-on-referral interventions to date. Participation and attendance showed a similar pattern to those reported for the earlier stages of the study,12 and a comparable referral rate (63%) and attendance rate (51.7%) with other health referral interventions, for example physical activity.26,28–32 Importantly, of those that attend, the majority are rated as engaged, and complete the intervention.
In respect to wellbeing, the identification of significant differences in the WEMWBS scores for those that completed corresponded with other findings, but analysis of those that completed and were also classed as engaging, reporting higher baseline scores, is a new finding. This could indicate that those with initially poorer wellbeing may not benefit as greatly from the intervention, or may need more support to facilitate their attendance. This finding could ensure future interventions target those most likely to benefit, improving overall pathway effectiveness, however research is required to understand why those that have lower wellbeing are failing to attend, and what can be done to help.
Furthermore, findings outline an overall increase in wellbeing in patients being referred to Artlift, with larger metrics of change being observed here than have been reported in previous analyses of these data.12 Since this last update of the programme, a further 1095 patients have been referred to participate in this intervention, presenting an over 5-fold increase in sample size. Given this much larger sample size, the findings of increased wellbeing across all participants is highly supportive of the efficacy of such interventions in primary care, and is both consistent with, and, adds valuable weight to given the sample size, reports from similar studies of arts-on-prescription interventions.1 Similarly, the present findings are in keeping with other social prescribing interventions, such as exercise referral programmes, and books on prescription (amongst others) that are suggested to increase wellbeing.5
Findings confirm that for patients reporting multiple medical conditions this intervention is also successful for the improvement of wellbeing. Moreover, this group are more likely to attend, and complete the intervention when compared to the overall cohort. Again, such a finding will be important in overall pathway effectiveness. This is the first time that those with multi-morbidity have been analysed as a discrete population in the literature concerning arts on referral. This growing patient demographic33 is important because they are frequently those who have complex and often costly care requirements,34 and so constitute a key target population for adjunct support for wellbeing. It should be noted, however, that this group was identified through voluntary information being provided by the patient, and it is therefore possible there are others in the cohort that have been missed from this analysis. Identifying and understanding the impact of primary care referral schemes for such patients is an important and timely line of investigation.
Since the earlier findings were reported, the intervention has undergone two adjustments, as detailed above. The findings demonstrate that the 8-week intervention has better engagement and attendance outcomes than the 10-week intervention. Possibly, the centralised referral approach, offering more choice and an opportunity for dialogue regarding the intervention, had a positive influence on engagement, but made no difference to overall wellbeing outcome.
Despite the important findings of this research, limitations exist that should be identified. Whilst the sample is large in number, it is however limited in its diversity, and by the amount of data available per participant. Furthermore, there is a relatively short follow-up period, where a longitudinal approach would be more beneficial to understanding any enduring effects on wellbeing. Future studies concerning arts-on-referral schemes should seek, where possible, to address these limitations, to add further to the developing evidence base. It is also important for studies to consider what variables may be associated with successful outcomes in these interventions, so that they may be developed and/or refined to ensure accessibility. Finally, it would be beneficial to understand more about the multimorbid representation within arts-on-referral schemes, and what unique benefit these interventions may offer a group with complex needs. Whilst these future directions are recommended, it must be recognised that research in this area is often limited to active interventions, with accompanying short-term evaluations.
In conclusion, the efficacy of an art referral intervention in primary care is supported by the present findings, specifically resulting in an outcome of increased wellbeing for those that engage and complete the intervention. Further, in terms of process outcomes, it is apparent that those who do not attend following referral are more frequently those that have lower wellbeing initially and are referred for multiple reasons. In addition, there are similar wellbeing improvements for an 8-week and 10-week intervention duration. These process and wellbeing outcomes will be of interest to those commissioning such interventions, ensuring that referral policies and pathway design are optimised for effectiveness, including additional support for those with lower levels of wellbeing at referral. Further research should seek to better understand how specific patient groups may benefit from this type of intervention, and evaluate the enduring, longer-term, benefits of these short interventions drawing on follow-up type designs.
Acknowledgements
The authors would like to thank those who contributed to the data collection throughout the lifetime of the study including the patients, referring health professionals, delivering artists, Kim Hill, Brenda Read-Brown and the registered charity, Artlift.
Funding
Funding was originally provided through a commissioned evaluation (2009–2011). For the completion of this analysis update there has been no external funding sought or received. The original evaluation was funded by NHS Gloucestershire Public Health.
Ethical approval: The study was approved by the National Health Service Local Research Ethics Committee and the Gloucestershire Clinical Commissioning Group, R&D Reference: 08/GPCT01/SE.
Conflicts of interest: None declared.
Key points
Arts on referral in primary care have a developing evidence base from quantitative and qualitative research, supporting its use for patient improvements in wellbeing. However, evidence is based on small sample sizes and short-term interventions.
The study describes the largest cohort to date of patients referred to an arts-for-health intervention in primary care. Because of this study, we know that an 8-week duration for these interventions is acceptable and accessible to patients, as evidenced by high rates of attendance and engagement, and that significant wellbeing changes are observed for those that complete.
For multi-morbid patients, attendance and completion is higher than the overall cohort; suggesting these interventions may be a useful option for supporting such patients.
Policy implications are that a non-health focussed intervention can significantly increase patient wellbeing, even in those whose care is often complex and demanding on resources.

Comments