


Abstract
Both research and popular media reports suggest that adolescent mental health has been deteriorating across societies with advanced economies. This study sought to describe the trends in self-reported symptoms of depressed mood and anxiety among Icelandic adolescents.
Data for this study come from repeated, cross-sectional, population-based school surveys of 43 482 Icelandic adolescents in 9th and 10th grade, with six waves of pooled data from 2006 to 2016. We used analysis of variance, linear regression and binomial logistic regression to examine trends in symptom scores of anxiety and depressed mood over time. Gender differences in trends of high symptoms were also tested for interactions.
Linear regression analysis showed a significant linear increase over the course of the study period in mean symptoms of anxiety and depressed mood for girls only; however, symptoms of anxiety among boys decreased. The proportion of adolescents reporting high depressive symptoms increased by 1.6% for boys and 6.8% for girls; the proportion of those reporting high anxiety symptoms increased by 1.3% for boys and 8.6% for girls. Over the study period, the odds for reporting high depressive symptoms and high anxiety symptoms were significantly higher for both genders. Girls were more likely to report high symptoms of anxiety and depressed mood than boys.
Self-reported symptoms of anxiety and depressed mood have increased over time among Icelandic adolescents. Our findings suggest that future research needs to look beyond mean changes and examine the trends among those adolescents who report high symptoms of emotional distress.
Introduction
The health of youth has rapidly emerged as an issue requiring urgent attention in global development. Because mental health problems often begin in childhood or during adolescence,1,2 improving adolescent mental health remains a challenge for most societies.3 Approximately one-fourth of youth have experienced a mental disorder in the past year and one-third will across their lifetime.4 The average lifetime prevalence of any mood disorder for adolescents 13–18 years of age is 14.3% (18.3 and 10.5% for girls and boys, respectively) and any anxiety disorder is 31.9% (38 and 26.1% for girls and boys, respectively).5 The 2013 Global Burden of Disease (GBD) study showed the significant burden of mental disorders among adolescents for both genders, with anxiety and depressive disorders among the top 10 causes of years lost to disability.6
Several large-scale, time-trend studies from Scandinavia,7–10 the United States11 and Great Britain12–15 show that adolescent mental health is worsening, while other studies suggest that mental health has remained relatively stable16–18 or even improved.19 Findings from a recent systematic review on adolescent mental health and changes over time suggested that the burden of internalizing problems (e.g. anxiety, depression and withdrawal) have remained stable for boys but increased for girls.20 All of these studies are based on data from 2011 or before, leaving a 5-year gap that needs to be examined further. However, one recent study using cross-sectional data collected among English students, ages 11–13, in 2009 and 2014, concluded that there were similar levels of mental health difficulties experienced by adolescents in the two time points, with the exception of a notable increase in emotional problems in girls.21
In Iceland, concern for the mental health of adolescents has been rising steadily.22 Cross-sectional data from 1997 to 2006 in Iceland revealed that symptoms of anxiety had increased among Icelandic adolescent boys and girls during that period, and that depressive symptoms had increased significantly for girls.7 However, from 2000 to 2010, adolescent happiness increased by 5% overall,23 suggesting that while adolescents were generally happier they were also experiencing anxiety and depressed mood more frequently. Because there are no data on trends from 2006, we do not know if adolescent mental health has improved or if emotional distress and happiness go together.
The objective of this study was to investigate trends in symptoms of depressed mood and anxiety among 14–15-year-old adolescents using population data that have been collected in the Youth in Iceland Survey during a 10-year time period. In order to provide a comprehensive view of trends in symptoms over time, we assessed changes in mean scores of reported symptoms over time as well as changes in symptoms determined by a cut-off score. These cut-off scores were used to detect changes in proportion of adolescents who reported high symptoms of depressed mood or anxiety at each time point and to make comparison across different years of investigation. We hypothesized that mean symptoms of depressed mood and anxiety and the proportion reporting high symptoms will have increased for both genders from 2006, and that the increase would be greater among girls than boys.
Methods
Data sources and participants
Data from the ongoing cross-sectional, population-based study Youth in Iceland in 2006, 2009, 2010, 2012, 2014 and 2016 were analysed. Participants were 14–15-year-old students attending the compulsory 9th and 10th grades of the Icelandic secondary school system. For this study, the number of participants in each year was as follows: 2006, n = 7232 (81.4% response rate); 2009, n = 7377 (83.5% response rate); 2010, n = 7125 (85.6% response rate); 2012, n = 7202 (86% response rate); 2014, n = 6966 (86.3% response rate); and 2016, n = 7041 (86% response rate). Gender distribution was roughly equivalent at all time points, with females representing 50.1% of the sample in 2006; 50.8% in 2009; 50.3% in 2010; 50.1% in 2012; 50.8% in 2014; and 49.6% in 2016. The total number of participants was 43 482.
Measures
As part of the Symptom Check List 90 (SCL-90),24,25 respondents were asked whether they had experienced the following symptoms of depressed mood and anxiety during the previous week. Prior studies indicate good reliability and construct validity of this measure.7,24,26
Symptoms of depressed mood
To measure respondents’ symptoms of depressed mood, nine items from the depression dimension scale of the SCL-90 were used.25 Participants were asked how often during the previous week the following statements applied to them: “I was sad or had little interest in doing things”, “I had poor appetite”, “I felt lonely”, “I had difficulty falling to sleep and staying sleeping”, “I cried easily or wanted to cry”, “I felt sad or blue”, “I was dispirited”, “I had little energy and was slow” and “The future seemed hopeless”. Each statement ranged from 0 to 3, with higher scores indicating more severity. The items were combined in a scale ranging from 0 to 27. The scale has good internal consistency with the average Cronbach’s alpha = .91 across all years of the study.
Symptoms of anxiety
Three items from the anxiety dimension scale of the SCL-90 were used to measure symptoms of anxiety.25 The participants were asked how often during the previous week they had experienced the following: “Nervousness”, “Feeling suddenly scared for no reason”, “Feeling tense or overstrung”. Each statement ranged from 0 to 3, with higher score indicating more anxiety. The items were combined in a scale ranging from 0 to 9. The scale has good internal consistency with the average Cronbach’s alpha = .78 across all years of the study.
Procedures
Anonymous questionnaires containing the measures were administered to all students present in class on the day of the survey, either in February or in March for each year of data collection. The overall questionnaire included items relating to emotional well-being, lifestyle, family and social background and parental and peer relationships. Participants took ∼1 h to complete the questionnaire. The Icelandic Centre for Social Research and Analysis conducted all aspects of data collection in accordance with the principles of research ethics stipulated by the National Bioethics Committee and the Icelandic Data Protection Agency.
Analyses
Differences in mean scores of symptoms of depressed mood and anxiety between years was tested for boys and girls separately using analyses of variance (ANOVAs) and Bonferroni post hoc tests. Year was the independent variable and the continuous measures of symptoms of depressed mood and anxiety were the dependent variables. Simple linear regression analyses were then used to test for a linear trend in mean levels of symptoms over time for girls and boys separately, using year of study as the predictor variable and symptoms of anxiety and depressed mood as the dependent variables.
In order to test whether the percentage of children with high symptom levels followed a similar pattern over time we used a cut-off score. For symptoms of depressed mood and anxiety, a cut-off score was identified based on the top 5% at the first time point.8,27 Binomial logistic regression was then used to examine changes over time between time points in proportion of girls and boys who showed high symptoms of anxiety and depressed mood as determined by the cut-off scores. In this analysis, year of study was used as the predictor variable to predict the dichotomous dependent variable contrasting those who met the cut-off score for high levels of symptoms of depressed mood or anxiety and those who did not. Finally, to test if the trends in high levels of symptoms were significantly different for the genders two binomial logistic regression models were run using year of study and gender as the predictor variables, the two dichotomous variables and the dependent variables, testing the interaction between year and gender on high symptoms of depressed mood and anxiety.
Multiple-group SEM tests of invariance were used to test the generalizability of the results for males and females, as well as across the six data collection waves. The measurement invariance across gender refers to the degree to which a test measures the same construct across varied groups, whereas measurement invariance for different time points refers to whether a test reflects the same constructs on different occasions for the same group. To test the measurement invariance for symptoms of depressed mood and anxiety we used the criteria by Cheung and Rensvold28 who suggest invariance between models if ΔCFI is ≤0.01 and the criteria described by Chen29 who suggest invariance between nested models if ΔRMSEA is ≤0.015. Strict invariance with factor variances was established for symptoms of depressed mood over time. Scalar invariance was established for symptoms of depressed mood by gender and for symptoms of anxiety over time and by gender (results available upon request).
All aspects of this reporting are consistent with the STROBE statement reporting requirements for cross-sectional studies.
Results
The results from the ANOVA showed that there was a difference between years in mean levels of anxiety symptoms for girls (F (5, 20943)=31.82, P < 0.001) and boys (F (5, 20541) = 38.42, P < 0.001). There was also a significant difference in mean levels of symptoms of depressed mood for both genders, F (5, 20173) = 6.31, P < 0.001 and F (5, 21110) = 45.62, P < 0.001, for boys and girls respectively. Table 1 shows mean scores on anxiety and depressive symptoms and results from Bonferroni post-hoc tests. For girls there was a significant (P < 0.001) increase in mean levels of depressive symptoms between each time point from 2012 to 2016, as well as between 2009 and 2010. Anxiety symptoms increased significantly (P < 0.001) between 2012 and 2016 among girls. Mean levels of symptoms of depressed mood remained quite stable among boys; while mean levels of anxiety symptoms decreased significantly between three time points (see table 1).
Descriptive statistics for symptoms of depressed mood and anxiety with results from Bonferroni post-hoc test for boys and girls, 2006–2016
| Variables | Year | N | Mean | SD | Years | Mean difference | Std. error |
|---|---|---|---|---|---|---|---|
| Boys depressed mood | 2006 | 3446 | 4.85 | 5.11 | X06–X09 | 0.07 | 0.125 |
| 2009 | 3411 | 4.78 | 5.26 | X09–X10 | −0.18 | 0.131 | |
| 2010 | 3280 | 4.96 | 5.31 | X10–X12 | 0.53*** | 0.131 | |
| 2012 | 3376 | 4.44 | 5.36 | X12–X14 | −0.06 | 0.132 | |
| 2014 | 3228 | 4.50 | 5.54 | X14–X16 | −0.48** | 0.132 | |
| 2016 | 3408 | 4.98 | 5.63 | X06–X16 | −0.13 | 0.129 | |
| Girls depressed mood | 2006 | 3517 | 8.27 | 6.82 | X06–X09 | 0.43 | 0.168 |
| 2009 | 3624 | 7.84 | 6.32 | X09–X10 | −0.59** | 0.169 | |
| 2010 | 3448 | 8.43 | 6.53 | X10–X12 | 0.51* | 0.170 | |
| 2012 | 3498 | 7.92 | 7.17 | X12–X14 | −0.71*** | 0.170 | |
| 2014 | 3459 | 8.62 | 7.81 | X14–X16 | −1.09*** | 0.171 | |
| 2016 | 3403 | 9.71 | 7.82 | X06–X16 | −1.44*** | 0.171 | |
| Boys anxiety | 2006 | 3490 | 1.85 | 1.90 | X06–X09 | 0.07 | 0.046 |
| 2009 | 3504 | 1.77 | 1.95 | X09–X10 | −0.01 | 0.047 | |
| 2010 | 3365 | 1.78 | 1.96 | X10–X12 | 0.41*** | 0.047 | |
| 2012 | 3444 | 1.37 | 1.84 | X12–X14 | 0.04 | 0.047 | |
| 2014 | 3299 | 1.41 | 1.94 | X14–X16 | 0.15* | 0.047 | |
| 2016 | 3445 | 1.56 | 2.02 | X06–X16 | 0.28*** | 0.047 | |
| Girls anxiety | 2006 | 3559 | 2.89 | 2.36 | X06–X09 | 0.03 | 0.058 |
| 2009 | 3658 | 2.87 | 2.27 | X09–X10 | 0.14 | 0.059 | |
| 2010 | 3473 | 3.01 | 2.41 | X10–X12 | 0.49*** | 0.059 | |
| 2012 | 3537 | 2.51 | 2.42 | X12–X14 | −0.37*** | 0.059 | |
| 2014 | 3476 | 2.88 | 2.72 | X14–X16 | −0.52*** | 0.060 | |
| 2016 | 3413 | 3.40 | 2.80 | X06–X16 | −0.51*** | 0.060 |
Significant P <0.05
Significant P < 0.01
Significant P < 0.001
Linear regression analysis showed a significant linear trend for girls, with an increase in both mean symptoms of anxiety (β = 0.039, P < 0.001) and symptoms of depressed mood (β = 0.06, P < 0.001) over time. A linear decrease was found in anxiety symptoms over time among boys (β = −0.07, P < 0.001); however, linear changes in symptoms of depressed mood were not significant for boys (P = 0.38).
Figure 1 shows the trends in high symptoms of depressed mood from 2006 to 2016, for boys and girls separately. Comparing the first and last years of investigation, the figures show that the proportion reporting high symptoms of depressed mood increased by 1.6% for boys and 6.8% for girls.
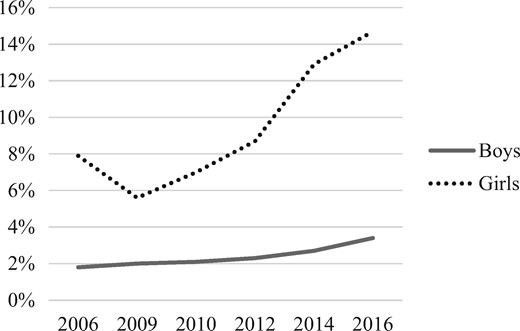
Trends in high symptoms of depressed mood among girls and boys, 2006–2016
Figure 2 shows the trends in high scores according to definition on anxiety symptoms between 2006 and 2016, for boys and girls separately. Comparing the first and last years of investigation the figures show that the proportion of those reporting high anxiety symptoms increased by 1.3% for boys and 8.6% for girls.
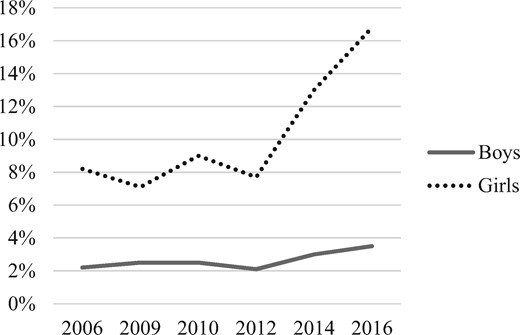
Trends in high symptoms of anxiety among girls and boys, 2006–2016
Table 2 shows the results of the binomial logistic regression models. The results indicate that the odds for having high depressive symptoms and high anxiety symptoms, as defined by cut-off values, were significantly higher for both genders in the year 2016 than in 2006. Between other time points under study, the odds of having high symptoms of depressed mood did not change significantly for boys. For girls the odds of having high depressive symptoms increased significantly between all of the time points, except between 2006 and 2009 when they decreased significantly. Odds for reporting high anxiety symptoms increased significantly between 2012 and 2014 for boys, while a significant increase was detected between three time points for girls.
Logistic regression for changes in proportion of adolescent boys and girls reporting high symptoms of depressed mood and anxiety, 2006–2016
| Variables | Years | OR | Sig. | CI 95% | β |
|---|---|---|---|---|---|
| Boys depressed mood | X06–X09 | 1.12 | 0.53 | 0.79–1.58 | 0.11 |
| X09–X10 | 1.04 | 0.84 | 0.74–1.45 | 0.03 | |
| X10–X12 | 1.10 | 0.56 | 0.79–1.53 | 0.10 | |
| X12–X14 | 1.19 | 0.28 | 0.87–1.62 | 0.17 | |
| X14–X16 | 1.14 | 0.39 | 0.85–1.52 | 0.13 | |
| X06–X16 | 1.11 | 0.00 | 1.06–1.18 | 0.11 | |
| Girls depressed mood | X06–X09 | 0.69 | 0.00 | 0.57–0.83 | −0.37 |
| X09–X10 | 1.27 | 0.01 | 1.05–1.54 | 0.24 | |
| X10–X12 | 1.27 | 0.01 | 1.07–1.51 | 0.24 | |
| X12–X14 | 1.55 | 0.00 | 1.33–1.81 | 0.44 | |
| X14–X16 | 1.16 | 0.03 | 1.01–1.33 | 0.15 | |
| X06–X16 | 1.22 | 0.00 | 1.18–1.25 | 0.20 | |
| Boys anxiety | X06–X09 | 1.11 | 0.49 | 0.82–1.52 | 0.11 |
| X09–X10 | 1.01 | 0.97 | 0.74–1.36 | 0.01 | |
| X10–X12 | 0.85 | 0.30 | 0.62–1.16 | −0.17 | |
| X12–X14 | 1.44 | 0.02 | 1.06–1.96 | 0.37 | |
| X14–X16 | 1.17 | 0.24 | 0.90–1.54 | 0.16 | |
| X06–X16 | 1.09 | 0.00 | 1.04–1.15 | 0.09 | |
| Girls anxiety | X06–X09 | 0.86 | 0.08 | 0.72–1.02 | −0.16 |
| X09–X10 | 1.29 | 0.00 | 1.09–1.53 | 0.26 | |
| X10–X12 | 0.84 | 0.05 | 0.71–1.00 | −0.17 | |
| X12–X14 | 1.81 | 0.00 | 1.54–2.12 | 0.59 | |
| X14–X16 | 1.35 | 0.00 | 1.178–1.539 | 0.30 | |
| X06–X16 | 1.20 | 0.00 | 1.20–1.17 | 0.19 |
Finally, there was a statistically significant difference in the trends for gender as indicated by a significant interaction between year and gender on high symptoms of depressed mood (OR 1.09, 95% CI 1.03–1.16, P = 0.005) and anxiety (OR 1.11, 95% CI 1.05–1.17, P < 0.001). These results indicate that the trend in high reported symptoms of depressed mood and anxiety are significantly different for the genders.
Discussion
Mean symptoms of depressed mood and anxiety increased over the study period among Icelandic adolescent girls, but not for boys. The proportion of adolescents reporting high symptoms of anxiety and depressed mood increased from 2006 to 2016 for both genders. Even though mean levels did not increase for boys, those that reported high symptoms represented a greater proportion in 2016 than 2006. This highlights the need to examine high-symptom groups as well as mean-level changes. According to data from the GBD study, where data are collected from 188 countries around the world, girls and boys aged 10–14 and 15–19 experienced a similar increase from 1990 to 2013 in years lost to disability due to depressive disorders.6 Moreover, recent findings from New Zealand showed that symptoms of depressed mood increased between 2007 and 2012 for adolescent boys and girls, with higher rates of girls reporting emotional problems.30
A systematic review revealed that recent cohorts of girls are experiencing increases in internalizing symptoms.20 Even though not entirely comparable, this increase is consistent with our finding of the sharp rise of symptoms of depressed mood and anxiety among Icelandic girls between 2014 and 2016. McMartin et al.16 examined time trends among Canadian adolescents and concluded that mental health had remained stable from 1998 to 2008; however, the study examined the genders together. The findings from this study and others7–10,12,14,15,19,31,32 showed an increase in emotional problems, and that the increase had been greater for girls than boys. In our study, the prevalence and mean was lower for boys than girls at all time points for both symptoms of depressed mood and anxiety. According to findings from a systematic review of 19 studies, recent cohorts of girls are experiencing increases in internalizing symptoms (i.e. depressed mood and anxiety) when compared to previous cohorts.20 We cannot explain the observed difference between males and females in our study, nor do we attribute the difference to any given factor. However, one plausible explanation for the difference might be that females are more open to talking about their feelings than males.
This study has several methodological strengths. First, data for the analyses come from what comprises a large population-based dataset with most Icelandic adolescents, ages 14 and 15, participating in the survey. Second, the data we analysed span a 10-year period, with six surveys of a single geographically defined population. Third, boys and girls were equally represented and we attained a high response rate in each of the years of the study.
There are several limitations. First, our findings are based on self-reported cross-sectional data using selected items from the SCL-90 scale. In the Youth in Iceland surveys, only 3 items of the SCL-90 are included in the anxiety dimension instead of 10 items. Second, we focus on symptoms of depressed mood and anxiety, which are measured on a continuous scale, rather than using clinical diagnoses or a measure of impairment in everyday functioning. Consequently, we cannot know if the observed increase is related to impairment in everyday functioning or due to some other reason. Third, by dichotomizing our measure of high symptoms of depressed mood and anxiety and using an arbitrary single cut-off score to designate high symptoms, we may have used an overly simplistic measure for our analytic purposes. However, in order to examine changes with logistic regression over time in those that report high symptoms it was necessary to create a cut-off score. Previous studies using non-clinical scales have used the top 10% as a cut-off value.8,9,16,27 The conservative value of top 5% in the first year, for both genders together, was used in this study. Because the objective of this study was to examine trends in subjective mental health and used self-report among the entire cohort at each time point, we were able to include youth who report symptoms of depressed mood or feeling anxious without meeting the clinical cut-offs.
Studies repeatedly have found that adolescent girls report higher levels of internalizing symptoms than boys.20 However, that does not explain the increase in reports of internalizing symptoms. The findings may reflect genuine changes in mental health symptom burden which is supported by other time-trend surveys of mental health among adolescents.7–10,12,14,15,30–32 On the other hand, secular trends, for example greater willingness to report symptoms due to decreased social stigma, may be influencing these trends. In 2008, the Icelandic population experienced a very sudden economic crisis. Studies have shown that reduction in disposable family impact can affect the mental health of children and adolescents through various pathways, such as increased economic pressure that in turn influences parental mental health,33 and increased social exclusion of vulnerable groups.34 Furthermore, income inequality has been associated with increased mental health problems among adolescents.35–37 In Sweden, the recession during the 1990s marked the appearance of child and adolescent mental health as a public health issue.38 Even if the findings from this study do not demonstrate a sudden increase directly following the crisis, it could be that the effects take longer to unravel. Other changes that have occurred rapidly in the past few years is time spent on electronic screen activities and social media, which has been related to poorer mental health among adolescents.39,40 Thus, without including other variables, we can only speculate as to what may be driving this change.
In conclusion, whether or not the rise in mental health problems shown in this and other studies is due to increased willingness to report and discuss mental health, the fact that many adolescents are reporting emotional distress is of concern. Widespread discussion of mental health in the Icelandic society has also raised awareness among professionals, teachers and parents. Our findings suggest that monitoring trends in adolescent mental health needs to be a societal priority. Future studies should focus on both genders separately as well as examine further risk and protective factors for adolescent mental health and possible causal factors of worsening mental health over time.
Key points
The study contributes to the literature by providing recent self-reported data on adolescent mental health.
Findings support previously observed trends of worsening mental health, especially among girls.
The results highlight the need to focus specifically on changes in those that report high symptoms of emotional distress, as well as changes in means.
Acknowledgements
The data on which this study is based were collected by the Icelandic Centre for Social Research and Analysis, which is supported by grants from the Ministry of Education, Science and Culture. The study is part of a PhD project funded by the Icelandic Research Fund (nr. 174030-051).
Conflicts of interest: None declared.

Comments