


Abstract
Background. Very little effort has been directed to enable GPs to better informed decisions about PSA screening among their male patients.
Objectives. To evaluate an innovative programme designed to enhance GPs' capacity to promote informed decision making by male patients about PSA screening.
Methods. The study design was a cluster randomised controlled trial set in New South Wales, Australia's most populous state. 277 GPs were recruited through a major pathology laboratory. The interventions were three telephone-administered 'peer coaching' sessions integrated with educational resources for GPs and patients and the main outcome measures were: GP knowledge; perceptions of patient involvement in informed decision making; GPs' own decisional conflict; and perceptions of medicolegal risk.
Results. Compared with GPs allocated to the control group, GPs allocated to our intervention gained significantly greater knowledge about PSA screening and related information [Mean 6.1 out of 7; 95% confidence interval (CI) = 5.9–6.3 versus 4.8; 95% CI = 4.6–5.0; P < 0.001]. They were less likely to agree that patients should remain passive when making decisions about PSA screening [Odds ratio (OR) = 0.11; 95% CI = 0.04–0.31; P < 0.001]. They perceived less medicolegal risk when not acceding to an ‘uninformed’ patient request for a PSA test (OR = 0.31; 95% CI 0.19–0.51). They also demonstrated lower levels of personal decisional conflict about the PSA screening (Mean 25.4; 95% CI 24.5–26.3 versus 27.8; 95% CI 26.6–29.0; P = 0.0002).
Conclusion. A ‘peer coaching’ programme, supplemented by education materials, holds promise as a strategy to equip GPs to facilitate informed decision making amongst their patients.
Gattellari M, Donnelly N, Taylor N, Meerkin M, Hirst G and Ward JE. Does ‘peer coaching’ increase GP capacity to promote informed decision making about PSA screening? A cluster randomised trial. Family Practice 2005; 22: 253–265.
Introduction
Authorities in most developed countries recommend neither for nor against PSA screening for prostate cancer, advocating instead ‘informed’ decision making.1–3 Men's participation in screening is typically not informed,4,5 with a majority of GPs6,7 and patients6,8 unaware of either risks or benefits. Uptake of PSA screening correlates with GPs' propensity to initiate screening, GP age, patient age and, despite a lack of evidence of a link between urinary symptoms and prostate cancer, the presence of such symptoms.9,10 Even after exposure to national guidelines, not all GPs change their propensity to initiate ‘uninformed’ screening because of unassuaged concerns about medicolegal risk.11
Very little effort has been directed to equip GPs to better promote informed decision making by patients about PSA screening. We conducted an efficacy trial to assess the impact of an innovative programme utilising motivational interviewing on four contributory behavioural and psychological dimensions namely: GP knowledge; their facilitation of informed decision making; their own decisional conflict; and perceptions of medicolegal risk.
Methods
Protocol
A large pathology service agreed to recruit volunteer GPs from their referral network in New South Wales, Australia's most populous state. All GPs who had ordered at least one PSA test during the 12 months prior to our study were sent a letter inviting their participation. Those who consented were mailed a 40 page self-administered ‘baseline’ questionnaire. We also unobtrusively monitored the number of PSA tests ordered by consenting GPs over a six week ‘baseline’ period. GPs were randomly allocated to either the intervention or to a ‘waiting list’ control group after completing baseline assessment. GPs were advised of group allocation after randomisation. Our programme was delivered over three months to all GPs in the intervention group, concluding in October 2002. ‘Post-test’ questionnaires were mailed to all GPs. We again monitored unobtrusively the number of PSA tests for a six-week ‘post-test’ period after our receipt of questionnaires.
Intervention
As shown in Box 1, information packages including individualised profiles of ‘baseline data’ and resources for patients were scheduled to enhance three telephone-administered ‘peer coaching’ sessions delivered by one of six medical peer educators. ‘Peer-coaching’ sessions were guided by the principles of motivational interviewing.12 While not formally trained in motivational interviewing techniques, educators were able to encourage GPs to develop their own capacity to promote informed decision making by patients, tailoring these ‘peer coaching’ sessions by referring to a standardised curriculum that responded to GPs' stage-of-change.13 GPs themselves were not required to use motivational interviewing techniques with patients. Copies of all GP educational materials including peer ‘coaching’ schedules and training modules are available on request.
MONTH 1
Information package 1 mailed:
‘Testing for prostate cancer, controversies and challenges’ audiotape/CD resource comprising a ‘mock consultation’ between two actors to illustrate informed decision making and a critical expert forum between a urologist, GP and academic lawyer (40-minutes duration).
‘The Great Debate: Should men be tested for prostate cancer’. Video resource with two expert urologists outlining the case for and against PSA screening (60 minutes duruation).
GP profile providing individualised feedback of GP baseline questionnaire responses that was anchored to national guidelines and evidence-based summaries (62 pages).
MONTH 2
Peer coaching session 1:
Medical peers discussed materials previously sent to GPs and worked through the GP profile to provide individualised feedback on current behaviour. Motivational interviewing underpinned the educational sessions.
Information package 2 mailed:
Patient education materials comprising an A4 sized laminated flow-chart for use by GPs during consultations with patients and 20 copies of a 32-page evidence-based patient booklet ‘Should I have a PSA test?’ This booklet has been proven to be effective in promoting informed choice.16,17
MONTH 3
Peer coaching session 2:
Medical peers discussed GPs' current and intended use of the evidence-based patient booklet focusing on barriers to providing evidence-based information to men.
Information package 3 mailed:
75-page educational module. Published clinical practice guidelines about LUTS for GPs and patients.
Peer education session 3:
Medical peers reviewed use of evidence-based patient booklet and discussed evidence-based management of LUTS.
MONTH 4
Information package 4 mailed:
Individualised feedback of GPs' PSA test ordering.
Before implementation, our program itself was pilot-tested with the six peer educator GPs. A urologist involved in the study (GH), a lawyer and a GP external to the study also were consulted about resources and contributed expertise. Content was informed by systematic reviews of the literature and empirical studies (details available from authors). In addition, results of our previous research were used to identify barriers and deficits in GPs' current practice and understanding.7,9,11,14,15 Further, two randomised evaluations of our patient evidence-based booklet, had been conducted in preparation for this study.16,17 Cochrane reviews produced by the Effective Practice and Organisation Care Group also were used to inform our selection of interventional components.18–21
GPs allocated to the control group were mailed only summaries of guidelines about PSA screening.
Assignment
To avoid contamination, we classified clusters of GPs according to practice addresses. A permanent random number ranging from 0 to 1 for each cluster was generated via Microsoft Excel (Microsoft 2000) random number generator. Clusters were ordered by this random number and assigned a unique identification code. Randomisation was then performed22 in which clusters were randomly assigned to one of two groups labelled 1 or 2. Determination of group 1 and 2 as intervention or control was then randomly determined using SPSS.23 Randomisation was stratified such that any GPs sharing any practice address with any other GPs were randomised to the same group.
Allocation concealment
Allocation concealment was assured as all GPs were randomised at the same time after baseline assessment had been completed. Further, the researcher (MG) responsible for randomisation was not involved in procuring baseline or follow-up data.
Masking
GPs were made aware of group allocation only after baseline data collection had been completed. NT provided data about the number of PSA tests, remaining always unaware of GPs' group allocation throughout the study. Staff blind to group allocation independently entered data. GPs were aware we would monitor PSA test ordering but were not informed of its timing or duration.
Measures
Four behavioural dimensions contributing to GP capacity to promote informed decision making were measured as follows.
Dimension 1: GP knowledge. GPs were asked to indicate whether there was ‘enough evidence to support use’, ‘enough evidence against use’, or ‘insufficient’ evidence regarding effectiveness of PSA screening to reduce the risk of premature mortality from prostate cancer. These measures had been used in previous research.9,15 GPs were asked to first consider PSA screening and nominated one of the above responses for: ‘asymptomatic men’, ‘asymptomatic men with a family history of prostate cancer’ and ‘men with lower urinary tract symptoms (LUTS)’. Next, GPs were asked to consider PSA screening in combination with Digital Rectal Exams (DREs) for the same three types of patients.
In addition, a seven-item knowledge measure was developed comprising first, six TRUE/FALSE questions and one multiple choice question assessing knowledge about the lack of a relationship between prostate cancer and LUTS (n = 1 item), the natural history and characteristics of prostate cancer (n = 3), the ability of PSA testing to detect indolent cancer (n = 1) and to detect cancer before it becomes symptomatic (n = 1). Another item assessed GPs' knowledge of the unproven efficacy of treatment for early-stage prostate cancer. Correct responses for the seven items were summed to produce a score ranging from 0–7. These items were derived from previous research.16,17
Dimension 2: Facilitation of informed decision making. A. Content. This measure assessed the scope of information provided by GPs to men before making a decision about PSA screening. GPs were required to indicate how often they provided information about eleven facts to enable men to make an ‘informed decision’, using a five-point Likert scale (‘rarely’, ‘sometimes’, ‘half the time’, ‘often’, ‘always’). These items were derived from a study of experts to determine those that should be communicated to men at the time a decision about PSA screening is made.14 These items were as follows: We then summed item scores such that a higher score reflected a greater propensity to disclose. Scores on this measure ranged from 11 to 55 with scores of 33 or more indicated that, on average, these items were discussed at least ‘half the time’.
Age-specific risk of developing and dying from prostate cancer
Scientific controversies about PSA testing
Chances of having a positive PSA test result
Chances of having prostate cancer if the PSA test is positive
Chances of having prostate cancer if the PSA test is negative
National recommendations about PSA testing
Follow-up tests that may be required
Risks associated with follow-up tests
Treatment options for prostate cancer
Scientific controversies about treatments for prostate cancer
Possible side-effects of treatments for prostate cancer
B. Processes. Using the same 5-point Likert Scale described above, GPs were asked to indicate how often they: With the exception of the last item, these items represent key behaviours in facilitating informed decision making.24 As the programme did not advocate the use of consent forms, this last item was included only to determine the extent to which demand characteristics influenced GPs' responses to these survey items.
Gave men written information explaining the potential benefits and risks of PSA testing
Advised men to take time to think about the benefits and risks of PSA testing
Told men that it should be their decision whether or not to have the test
Asked men for their opinion about the importance of PSA testing for them
Questioned men about whether they understood the pros and cons of PSA testing
Asked men to sign a consent form
C. Skills to promote informed decision making by men. GPs' confidence in each of five skills to promote informed decision making also was assessed, namely: ‘communicating the benefits of PSA testing’, ‘communicating the risk of harm from PSA testing’; ‘ensuring men understand the risks and potential benefits of PSA testing’; ‘ensuring that men understand the equivocal state of the scientific evidence about PSA testing‘; and ’eliciting men's opinions about how important both the harms and benefits of PSA testing are to them‘. For each skill, GPs used a seven-point visual analogue scale to indicate their confidence (1 representing ‘not at all confident’ to 7 representing ‘very confident’). A summed confidence score ranging from 5 to 35 (midpoint 15) was computed. A higher score reflected greater confidence. This measure of skill was based on previous research in assessing GPs' skill in delivering smoking cessation advice to patients.25
D. Decisional control. We adapted the Decisional Control Scale in order to assess GPs' own decisional preferences for sharing decisions with patients.26,27 Specifically, GPs were asked ‘who should make the decision about whether or not a man has a PSA test for prostate cancer for preventive health care purposes?’ One of five responses could be selected, enabling classification of GPs as preferring to ‘share’ decision making with patients or preferring that patients remain either ‘passive’ or ‘active’ in the decision-making process. GPs who indicated preferring that patients be ‘passive’ were compared with other GPs.
E. GPs' propensity to initiate PSA screening. As elsewhere,9,15 three clinical scenarios describing a male patient aged 58 years attending for a consultation then were presented. The first scenario described the patient as ‘a regular patient otherwise in good health and has not been to your practice for two years’, attending to have his ears syringed. GPs were asked to indicate the likelihood they would ‘take this opportunity’ to introduce a discussion about Prostate Specific Antigen (PSA) blood testing (‘highly likely’, ‘somewhat likely’, ‘would not discuss’). A second scenario described an asymptomatic patient, as attending specifically for a ‘health check-up’. The third scenario described the patient attending about ‘bothersome’ LUTS. We repeated the three response options for each of these. GPs who responded ‘highly’ or ‘somewhat’ likely were compared with those who responded ‘would not discuss/include’. These items have been previously shown to produce variability in GPs' responses, differentiate between GPs according to their characteristics and predict GP screening behaviour.9,15
Dimension 3: Decisional conflict. The Provider Decision Process Assessment Instrument28 assesses the extent to which GPs experience uncertainty for a given medical decision. We adapted it to address PSA screening decisions. Decisional conflict amongst clinicians is hypothesised to occur when choices involve risks and trade-offs for each alternative. Nine items (e.g. ’Whether or not to recommend PSA testing is a hard decision to make’) were adapted from the scale referring to ‘PSA testing for prostate cancer as a preventive health care activity’. GPs were required to indicate their level of agreement to each item on a five point scale (‘strongly agree’, ‘agree’, ‘neither’, ‘disagree’, ‘strongly disagree’). Items scores are summed to produce an overall score ranging from 9 to 45. Higher scores indicated higher levels of decisional conflict. A mid-point score of 27 indicates that, on average, GPs ‘neither’ agreed nor disagreed with items, and hence reflect a ‘neutral’ response to decisions about PSA screening.
Dimension 4: Perception of medico-legal risk. Two scenarios were adapted to assess GPs' perceptions of medico-legal risk arising from PSA screening decisions.11 In the first scenario, GPs were asked to consider the situation of a ‘58 year old man attending for a consultation after prompting by his wife to have a test for prostate cancer. He is a regular patient. He requests a PSA test. He reports no symptoms and has no family history of prostate cancer’. In the second scenario, the patient was a ‘58 year old man who reports lower urinary tract symptoms’ which are “bothersome”.’ In response to each scenario, GPs were asked to answer (Yes/No/ Unsure), first, whether they were at ‘risk medico-legally’ if they ‘did not perform a PSA test?’ and, second, if they 'did (‘yes’, ‘no’, ‘unsure’). GPs who responded yes were compared with others for analysis. Similar scenarios had been used in a representative survey of GPs in NSW.11 GP answers to these scenarios have been shown to shift in response to their awareness of national guidelines about PSA screening.11
Behavioural outcomes and the dimensions of knowledge, facilitation of informed decision making and decisional conflict previously have been identified as relevant outcomes for interventions aimed at promoting informed decision making.24 Hence, we considered these primary outcomes. GPs' perceptions of medico-legal risk were also measured as secondary outcomes as we have previously reported medico-legal concerns about PSA screening as predictors of GP screening behaviour.11
Statistical analysis
All analyses were conducted according to the ‘intention-to-treat’ principle in that GP responses were analysed according the group to which they were allocated. Between-group analyses were conducted, comparing groups on outcomes at post-test. A P-value of 0.05 was set to determine statistical significance for all analyses. We did not adjust the significance level value for multiple comparisons as many of the self-reported outcomes were expected to be correlated. Hence, an adjustment for multiple comparisons would have been unnecessarily conservative.29
In order to control the type 1 error rate associated with cluster randomisation, we accounted for clustered randomised design in analysis via STATA 5.030 commands SVYREG and SVYLOGIT to analyse data continuous and dichotomous variables, respectively. We also adjusted for cluster size as randomisation was stratified by this variable (n = 1 or n = 2+). For all analyses, cluster and cluster size variables were identified as the primary sampling unit and stratification variables, respectively. As the software only permitted adjustment for clustered randomisation with continuous or dichotomous outcomes, ordinal variables were necessarily dichotomised.
We defined counts of total number of PSA tests ordered and the number of PSA tests ordered within specific age-groups as outcomes. Hence, we conducted Poisson regression to analyse these data using a Generalised Estimation Equations (GEE) approach via PROC GENMOD in SAS,31 specifying an exchangeable correlation structure underlying intra-class correlations to control for dependencies arising from clustered randomisation. We also analysed these data by controlling for pre-test ordering by subtracting the total number of tests ordered at post-test from the total number ordered at pre-test. In addition, we examined tests ordered for men aged up to 75 years, excluding men aged older than 75 who are not targeted by screening and who would be more likely to undergo PSA testing for prostate cancer surveillance. We also classified GPs according to whether they ordered fewer, more or the same number of tests at post-test compared with pre-test in order to minimise the influence high volume PSA ‘testers’ had on our results and to examine individual change in test ordering.
Intra-class correlation coefficients (ICCs) for outcomes based on pre-test measures were also calculated in order to inform estimates of design-effects for future research.
Sample size calculations
Sample size estimations were inflated to accommodate the design effect due to randomisation and analysis by cluster.32 As no estimates of the ICCs for outcomes were available, we assumed an ICC of 0.1 and an average cluster size of 4. We estimated that 134 GPs per group would be sufficient to detect a 20% difference between groups on categorical outcomes, given α = 0.05 and power of 80%.33
Results
Participant flow and follow-up
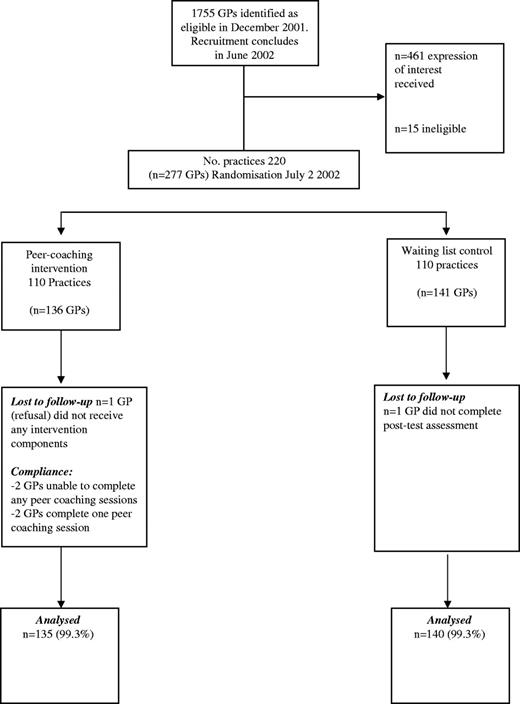
Figure 1 displays study recruitment and participant flow. Of 1755 potentially eligible GPs identified from the pathology database, 461 (26.3%) registered their interest in being involved in the programme and 277 GPs (15.8%) consented to participate. Of the 277 consenting GPs, 95 were grouped into clusters while 181 were in ‘solo’ practice. Of 136 GPs from 110 practices enrolled into the intervention group, 135 completed post-test assessment (99.3%). Similarly, 140 of the 141 GPs from 110 practices enrolled in waiting list control practices completed post-test assessment. Demographic and practice characteristics were balanced between groups at baseline (Table 1) as were baseline measures (Tables 2 and 3). ICCs for the outcomes are displayed in Tables 2 and 3.
Participant recruitment and follow-up
GP demographic and practice characteristics (n = 277)
| Variable | Total sample | Intervention n = 136 | Control n = 141 | P-value | ||||
|---|---|---|---|---|---|---|---|---|
| Age | ||||||||
| <35 | 9 (3.2) | 3 (2.2) | 6 (4.3) | 0.13 | ||||
| 35–44 | 63 (22.7) | 28 (20.6) | 35 (24.8) | |||||
| 45–54 | 113 (40.8) | 55 (40.4) | 58 (41.1) | |||||
| 55–64 | 55 (19.9) | 29 (21.3) | 26 (18.4) | |||||
| 65+ | 33 (11.9) | 19 (14.0) | 14 (9.9) | |||||
| Missinga | 4 (1.4) | 2 (1.5) | 2 (1.4) | |||||
| GP sex | ||||||||
| Male | 208 (75.1) | 101 (74.3) | 107 (75.9) | 0.76 | ||||
| Female | 69 (24.9) | 35 (25.7) | 34 (24.1) | |||||
| Years in general practice | ||||||||
| <10 | 44 (15.9) | 18 (13.2) | 26 (18.4) | 0.40 | ||||
| 11–20 | 104 (37.5) | 51 (37.5) | 53 (37.6) | |||||
| 21–30 | 76 (27.4) | 39 (28.7) | 37 (26.2) | |||||
| >31 | 49 (17.7) | 26 (19.1) | 23 (16.3) | |||||
| Missinga | 4 (1.4) | 2 (1.5) | 2 (1.4) | |||||
| Post-graduate training in family practice | ||||||||
| Yes | 95 (34.3) | 46 (33.8) | 49 (34.8) | 0.89 | ||||
| No | 180 (65.0) | 89 (65.4) | 91 (64.5) | |||||
| Missinga | 2 (0.7) | 1 (0.7) | 1 (0.7) | |||||
| Work hours | ||||||||
| Full-time | 236 (85.2) | 118 (86.8) | 118 (83.7) | 0.40 | ||||
| Part-time | 40 (14.4) | 17 (12.5) | 23 (16.3) | |||||
| Missinga | 1 (0.4) | 1 (0.7) | – | |||||
| Type of practice | ||||||||
| Solo | 98 (35.4) | 50 (36.8) | 48 (34.0) | 0.64 | ||||
| Group practice | 178 (64.3) | 85 (62.5) | 93 (66.0) | |||||
| Missinga | 1 (0.4) | 1 (0.7) | – | |||||
| Location of practice in Sydney | ||||||||
| Yes | 139 (50.2) | 68 (50.0) | 71 (50.4) | 0.96 | ||||
| No | 138 (49.8) | 68 (50.0) | 70 (49.6) | |||||
P-values based on model adjusted for clustering within practice and stratification by cluster size.
Missing cases excluded from statistical analyses.
Pre-test measures by group
| Total sample Point estimate (% correct; 95% CI) | Intervention Point estimate (% correct; 95% CI) | Control Point estimate (% correct; 95% CI) | P-value | ICCa | ||||||
|---|---|---|---|---|---|---|---|---|---|---|
| Dimension 1: Knowledge PSA tests for: | ||||||||||
| Asymptomatic men | 152/276 (55.1; 49.0–61.1) | 75/136 (55.1; 46.8–63.4) | 61/140 (43.6; 35.1–52.4) | 0.98 | 0.16 | |||||
| Asymptomatic men with a family history | 67/276 (24.3; 19.1–29.4) | 38/136 (27.9; 13.6–27.8) | 29/140 (20.7; 14.5–28.6) | 0.16 | 0.06 | |||||
| Men with LUTS | 51/276 (18.5; 14.0–22.9) | 26/136 (19.1; 12.4–25.9) | 25/140 (17.9; 12.0–23.7) | 0.78 | −0.21 | |||||
| PSA in combination with DRE for: | ||||||||||
| Asymptomatic men | 127/276 (46.0; 40.3–51.7) | 60/136 (44.1; 36.2–52.0) | 67/140 (47.9; 39.8–56.0) | 0.51 | −0.25 | |||||
| Asymptomatic men with a family history | 36/275 (13.1; 8.7–17.5) | 18/135 (13.3; 7.5–19.2) | 18/140 (12.9; 6.3–19.4) | 0.91 | 0.72 | |||||
| Men with LUTS | 24/276 (8.7; 5.4–12.0) | 13/136 (9.6; 4.7–14.4) | 11/140 (7.9; 3.5–12.2) | 0.61 | −0.18 | |||||
| Knowledge score (0–7, midpoint 3.5) | 4.7 (4.5–4.8) | 4.8 (4.6–4.9) | 4.6 (4.4–4.8) | 0.13 | −0.15 | |||||
| Coefficient α = 0.81 | ||||||||||
| Mean (95% CI) | ||||||||||
| Dimension 2: Capacity and propensity to facilitate informed decision making | ||||||||||
| Informed decision making score (5–55; midpoint 33) | 35.5 (34.3–36.6) | 35.8 (34.1–37.4) | 35.2 (33.6–36.7) | 0.59 | 0.003 | |||||
| Coefficient α = 0.88 | ||||||||||
| Mean (95% CI) | ||||||||||
| Summed confidence score (5–35, midpoint 15) | 23.6 (23.0–24.2) | 23.7 (23.0–24.5) | 23.5 (22.4–24.5) | 0.71 | 0.30 | |||||
| Coefficient α = 0.89 | ||||||||||
| Mean (95% CI) | ||||||||||
| Decisional control scale | ||||||||||
| Patient passive | 59/276 (21.4) | 24/135 (17.8) | 35/140 (25.0) | 0.17 | 0.19 | |||||
| Shared | 111/276 (40.2) | 56/135 (41.5) | 55/140 (39.3) | |||||||
| Patient active | 106/276 (38.4) | 55/135 (40.7) | 51/140 (36.4) | |||||||
| Scenario 1: propensity to opportunistically discuss PSA testing | ||||||||||
| Highly | 20 (7.2) | 11 (8.1) | 9 (6.4) | 0.60 | −0.02 | |||||
| Somewhat likely | 80 (28.9) | 36 (26.5) | 44 (31.2) | |||||||
| Would not discuss | 177 (63.9) | 89 (65.4) | 88 (62.4) | |||||||
| Scenario 2: Propensity to opportunistically screen for prostate cancer | ||||||||||
| Highly likely | 102 (36.8) | 47 (34.6) | 55 (39.0) | 0.33 | 0.28 | |||||
| Somewhat likely | 111 (40.1) | 54 (39.7) | 57 (40.4) | |||||||
| Would not include | 64 (23.1) | 35 (25.7) | 29 (20.6) | |||||||
| Scenario 3: Propensity to screen men with LUTS | ||||||||||
| Highly likely | 218 (78.7) | 107 (78.7) | 111 (78.7) | 0.51 | 0.03 | |||||
| Somewhat likely | 51 (18.4) | 26 (19.1) | 25 (17.7) | |||||||
| Would not order | 8 (2.9) | 3 (2.2) | 5 (3.5) | |||||||
| Dimension 3: Decisional conflict | ||||||||||
| Decisional conflict scores (9–45; midpoint = 27) | 28.1(27.3–28.8) | 28.0(27.0–29.0) | 28.2(27.1–29.3) | 0.80 | 0.52 | |||||
| Coefficient α = 0.81 | ||||||||||
| Mean (95% CI) | ||||||||||
| Dimension 4: Perception of medicolegal threats | ||||||||||
| Scenario 1: screening asymptomatic men | ||||||||||
| At risk if do not screen | 180/275 (65.5; 59.6–71.3) | 86/135 (63.7; 57.2–74.7) | 91/140 (65.0; 57.3–72.7) | 0.88 | 0.17 | |||||
| At risk if do screen | 41/275 (14.9; 10.6–19.2) | 18/135 (13.3; 7.4–19.3) | 23/140 (16.4; 10.1–22.7) | 0.49 | 0.15 | |||||
| Scenario 2: screening men with LUTS | ||||||||||
| At risk if do not screen | 198/275 (72.0; 67.0–77.0) | 95/135 (70.4; 62.9–77.8) | 103/140 (73.6; 66.8–80.4) | 0.53 | −0.37 | |||||
| At risk if do screen | 32/277 (11.6; 8.0–15.3) | 17/135 (12.6; 7.0–18.2) | 15/140 (10.7; 6.0–15.4) | 0.61 | −0.27 | |||||
ICC for outcome.
GP PSA test ordering at pre-test by group (n = 277)
| Total n = 277 | Intervention n = 136 | Control n = 141 | Risk ratio 95% CI | P-value | ICCa | |||||||
|---|---|---|---|---|---|---|---|---|---|---|---|---|
| Total | ||||||||||||
| Median (IQR) | 3 (1–6) | 2 (0.25–6) | 3 (1–7) | 0.83 (0.66–1.04) | 0.10 | 0.04 | ||||||
| Age-specific data | ||||||||||||
| <49 years of age | ||||||||||||
| Median (IQR) | 0 (0–0) | 0 (0–0) | 0 (0–0) | 1.15 (0.67–1.98) | 0.52 | −0.01 | ||||||
| 50–59 years of age | ||||||||||||
| Median (IQR) | 0 (0–1) | 0 (0–1) | 0 (0–1) | 0.93 (0.68–1.16) | 0.67 | −0.02 | ||||||
| 60–69 years of age | ||||||||||||
| Median (IQR) | 1 (0–2) | 0.5 (0–2) | 1 (0–2) | 0.86 (0.64–1.16) | 0.32 | 0.06 | ||||||
| 70–74 years | ||||||||||||
| Median (IQR) | 0 (0–1) | 0 (0–1) | 0 (0–1) | 0.80 (0.54–1.17) | 0.24 | 0.02 | ||||||
| 75+ years | ||||||||||||
| Median (IQR) | 0 (0–1) | 0 (0–1) | 1 (0–2) | 0.77 (0.56–1.07) | 0.12 | 0.17 | ||||||
Age-specific data were not available for two GPs allocated to the control group. To deal with skewed data, we set an upper limit of 10+ tests ordered.
ICC for outcome.
Post-test outcomes
Dimension 1: GP knowledge. Five of the six items assessing GPs knowledge of the status of the current evidence underpinning PSA screening yielded significant differences between groups (Table 4). Compared with control group GPs, GPs allocated to the intervention group were significantly more likely to correctly report that there was ‘insufficient’ evidence to support PSA screening for men with a family history of prostate cancer [odds ratio (OR) = 3.07; 95% confidence interval (CI) 1.81–5.20; P < 0.001] or LUTS (5.02; 95% CI 2.98–8.45; P < 0.001). Similarly, a significantly higher proportion of GPs allocated to the intervention groups correctly identified the evidence-base as ‘insufficient’ for PSA screening, in combination with DREs for asymptomatic men (OR = 1.91; 95% CI 1.15–3.18; P = 0.01), men with a family history (OR = 4.89; 95% CI 2.77–8.61; P < 0.001) and for men with LUTS (OR 7.11; 95% CI 4.09–12.37; P < 0.001) (Table 4).
Post-test measures by group
| Intervention n/N (%; 95% CI)* | Control Point estimate (%; 95% CI)* | OR (95% CI) | P-value | ICCa | ||||||
|---|---|---|---|---|---|---|---|---|---|---|
| Dimension 1: Knowledge | ||||||||||
| Correctly identified evidence as insufficient PSA tests for: | ||||||||||
| Asymptomatic men | 92/134 (68.7; 60.7–76.6) | 86/139 (61.9; 52.9–69.4) | 1.39 (0.36–1.02) | 0.21 | 0.07 | |||||
| Asymptomatic men with a family history | 77/133 (57.9; 50.0–65.7) | 43/139 (30.9; 22.2–39.7) | 3.07 (1.81–5.20) | <0.001 | 0.33 | |||||
| Men with LUTS | 81/135 (60.0; 51.4–68.6) | 32/139 (23.0; 16.3–29.8) | 5.02 (2.98–8.45) | <0.0001 | −0.07 | |||||
| PSA in combination with DRE for: | ||||||||||
| Asymptomatic men | 95/134 (70.9; 62.8–78.0) | 77/139 (55.4; 46.7–64.1) | 1.91 (1.15–3.18) | 0.01 | 0.1 | |||||
| Asymptomatic men with a family history | 76/135 (56.3; 48.6–64.0) | 29/139 (20.9; 13.2–28.6) | 4.89 (2.77–8.61) | <0.001 | 0.4 | |||||
| Men with LUTS | 79/135 (58.5; 50.1–67.0) | 23/139 (16.5; 10.6–22.5) | 7.11 (4.09–12.37) | <0.001 | −0.17 | |||||
| Knowledge score (0–7, midpoint 3.5) | 6.1 (5.9–6.3) | 4.8 (4.6–5.0) | – | <0.001 | 0.40 | |||||
| Coefficient α = 0.22 | ||||||||||
| Mean (95% CI) | ||||||||||
| Dimension 2: Capacity and propensity to facilitate informed decision making | ||||||||||
| Informed decision making score midpoint (5–55; 33) | 45.7 (44.2–47.2) | 37.2 (35.5–38.8) | – | <0.0001 | 0 | |||||
| Coefficient α = 0.88 | ||||||||||
| Mean (95% CI) | ||||||||||
| Behaviours facilitating informed decision making (‘always’) | ||||||||||
| Give men written information | 60/135 44.4 (36.3–52.5) | 1/139 0.7 (0–2.1) | 110.4 (14.70–929.30) | <0.001 | 0.03 | |||||
| Advise men to take time to think about it | 71/135 52.6 (44.4–60.8) | 7/139 5.0 (1.3–8.7) | 20.9 (9.00–48.50) | <0.001 | 0.03 | |||||
| Ask men to sign a consent form | 1/135 0.7 (0.0–2.1) | 0/139 0 | – | – | – | |||||
| Tell men its their decision whether or not to have the test | 80/135 59.3 (50.4–68.1) | 30/139 21.6 (14.8–28.3) | 5.28 (3.07–3.05) | <0.001 | 0.1 | |||||
| Ask men for their opinion about the importance of PSA testing for them | 37/135 27.4 (19.9–34.9) | 7/139 5.0 (1.4–8.7) | 7.12 (3.07–3.05) | <0.001 | −0.07 | |||||
| Question men about whether they understood the pros and cons of PSA testing | 58/135 43.0 (33.5–52.4) | 18/139 12.9 (7.2–18.7) | 5.06 (2.68–9.57) | <0.001 | 0.33 | |||||
| Summed confidence score (5–35; midpoint = 15) | ||||||||||
| Coefficient α = 0.89 | ||||||||||
| Mean (95% CI) | 28.4 (27.8–29.0) | 23.9 (23.1–24.7) | – | <0.001 | 0 | |||||
| Decisional control scale | 5/135 | 35/139 | 0.11 (0.04–0.31) | <0.001 | 0.03 | |||||
| Patient passive | 3.7 (0.4–6.9) | 25.2 (17.8–32.5) | ||||||||
| Scenario 1: propensity to opportunistically discuss PSA testing | ||||||||||
| Would not discuss | 112/135 83.0 (77.0–89.0) | 93/140 66.4 (57.8–75.1) | 2.46 (1.38–4.38) | 0.002 | 0.03 | |||||
| Scenario 2: Propensity to opportunistically screen for prostate cancer | ||||||||||
| Would not include | 102/135 75.6 (67.9–83.2) | 41/140 29.3 (22.0–36.5) | 7.46 (4.36–12.78) | <0.0001 | −0.03 | |||||
| Scenario 3: Propensity to screen men with LUTS | ||||||||||
| Would not order | 90/135 66.7(58.7–74.6) | 4/140 2.9 (0.0–5.6 | 68 (23.60–195–93) | <0.0001 | −0.03 | |||||
| Dimension 3: Decisional conflict | ||||||||||
| Decisional conflict scores midpoint (9–45; = 27) | 25.4 (24.5–26.3) | 27.8 (26.6–29.0) | – | 0.0002 | 0.47 | |||||
| Coefficient α = 0.80 | ||||||||||
| Mean (95% CI) | ||||||||||
| Dimension 4: Perception of medico-legal risk | ||||||||||
| Scenario 1: screening asymptomatic men | ||||||||||
| At risk if do not screen | 44/135 (32.6; 24.8–40.4) | 85/140 (60.7; 52.7–68.7) | 0.31 (0.19–0.51) | <0.001 | 0.13 | |||||
| At risk if do not screen | 44/135 (32.6; 25.0–40.0) | 21/140 (15.0; 9.0–21.4) | 2.74 (1.49–5.03) | <0.001 | 0.17 | |||||
| How often was your decision to test a man influenced by medico-legal concerns (‘often/always’) | 18/134 (13.4; 7.8–19.2) | 21/140 (15.0; 8.6–21.3) | 0.88 (0.44–1.76) | 0.88 | 0.10 | |||||
| Scenario 2: screening men with LUTS | ||||||||||
| At risk if do not screen | 34/135 (25.2; 18.0–32.4) | 103/140 73.6 (66.0–81.1) | 0.12 (0.07–0.21) | <0.001 | −0.03 | |||||
| At risk if do screen | 38/135 (28.1; 20.4–35.9) | 18/140 (12.9; 7.4–18.4) | 2.66 (1.42–4.96) | 0.0002 | 0 | |||||
| How often was your decision to test a man influenced by medico-legal concerns (‘often/always’) | 15/135 11.1 (5.9–16.3) | 22/140 15.7 (9.2–33.2) | 1.20 (0.59–2.42) | 0.61 | −0.37 | |||||
Composite knowledge scores were also significantly higher amongst GPs allocated to the intervention group (Mean 6.1; 95% CI 5.9–6.3 versus 4.8; 95% CI 4.6–5.0) (t210 = 9.66) (P < 0.001) (Table 4). Mean differences between groups indicate that GPs allocated to the intervention group answered, on average, 1.3 more questions correct out of seven compared with control group GPs.
Dimension 2: Information disclosure. A. Content. GPs allocated to the intervention demonstrated significantly higher scores on the scale assessing information disclosure of eleven facts (Mean = 45.7; 95% CI 44.2–47.2%) compared with those allocated to the control group (Mean = 37.2; 95%CI 35.5–38.8) (t216 = 7.65) (P < 0.001) (Table 4). A value of greater than 44 indicates that these eleven facts were disclosed at least ‘often’, while the midpoint value of 33 indicates the facts were disclosed ‘half the time’. Hence, GPs allocated to the intervention group reported discussing these facts ‘often’, on average, while those allocate to the control group discussed facts less than ‘often’.
B. Process. GPs assigned to the intervention group were also significantly more likely to report that they gave men written information, advised men to think about the decision before undergoing testing, asked men for their opinion about the importance of PSA testing and questioned them about whether they understood the pros and cons of PSA testing (P < 0.001) (Table 4). There were no differences between groups in their self-reported use of consent forms suggesting minimal reactivity to demand characteristics when responding to these items.
C. Skills to promote informed decision making by men. GPs allocated to the intervention reported higher confidence levels in promoting informed decision making in men (compared with those allocated to the control group; mean = 28.4; 95% CI 27.8–29.0 versus mean = 23.9, 95% CI 23.1–24.7) (t217 = 8.86) (P < 0.001) (Table 4). As the midpoint value of 15 represents neither a lack nor gain of confidence, GPs in both groups indicated a high level of confidence in promoting informed decision making. However, the average score for GPs allocated to the intervention suggests a higher level of confidence, scoring, on average, between 5 and 6 on a Likert scale of 1–7 for each of the five items. GPs allocated to the control group scored an average of between 4 and 5 for each of the five items.
D. Decisional control. GPs allocated to the intervention group were significantly less likely to indicate that patients should remain passive when decisions about PSA screening are made (OR = 0.11; 95% CI = 0.04– 0.31) (P < 0.001) (Table 4). Only 3.7% of GPs allocated to the intervention group reported that patients should remain passive, compared with 25.2% of those allocated to the control group.
E. GPs propensity to initiate PSA screening opportunistically. A significantly higher proportion of GPs assigned to the intervention indicated that they 'would not' opportunistically discuss PSA testing (OR = 2.46; 95% CI 1.38–4.38) (P = 0.002) or opportunistically screen either asymptomatic men or men with LUTS for prostate cancer (OR = 7.46; 95% CI 4.36–12.78 and OR = 68.0; 95% CI 23.60–195.93) (P < 0.0001) (Table 4).
Dimension 3: Decisional conflict. Compared with GPs allocated to the control group, intervention group GPs had significantly lower decisional conflict scores (mean = 25.4; 95% CI 24.5–26.3 versus mean = 27.8; 95% CI 26.6–29.0) (t217 = −3.07) (P = 0.0002) (Table 4). Compared with the midpoint score of 27, indicating neutral responses to items assessing decisional conflict, GPs allocated to the intervention group indicated on average, ‘low’ levels of decisional conflict, while GPs allocated to the control group had ‘high’ levels.
Dimension 4: Perception of medico-legal risk. While 32.6% (95% CI 24.8–40.4%) of GPs allocated to the intervention reported that they would be at risk if they did not screen an asymptomatic man requesting a PSA test, 60.7% (95% CI 52.7–68.7%) of GPs in the control group reported that they would be at risk (OR = 0.31; 95% CI 0.19-0.51) (P < 0.001). Significantly more GPs allocated to the intervention reported that they would be at risk if they did screen, however (OR = 2.74; 95% CI 1.49–5.03) (P < 0.001).
Similarly, GPs allocated to the intervention were less likely to indicate that they would be at risk if they did not screen a man with LUTS who requested a test compared with those in the control group (OR = 0.12; 95% CI 0.07–0.21) (P < 0.001) but were significantly more likely to indicate they were at risk if they did perform a test (OR = 2.66, 95% CI 1.42–4.96) (P = 0.002).
The extent to which GPs decisions to test men were influenced by medico-legal concerns did not differ between groups for either scenario, however (Table 4).
PSA test-ordering. A total of 1201 PSA tests were requested by GPs in this sample at pre-test. GPs allocated to the control group ordered 683 tests, while those allocated to the intervention ordered 518 tests (P = 0.10). At post-test, a total of 739 PSA tests were ordered, with 489 ordered by control group GPs and 250 ordered by intervention group GPs (P < 0.0001). GPs assigned to the intervention ordered a median of one (IQR = 0–2) PSA test during the six-week post-test period compared with the control group ordering a median of two (IQR = 0–5) [Risk ratio (RR) = 0.52] (95% CI 0.38–0.75) (P = 0.0004) (Table 5). Differences between groups for the number of tests ordered for men in total were not significant when controlling for pre-test ordering, however (P = 0.18) (results available from authors).
GP PSA test ordering at post-test by group
| Intervention n = 135 | Control n = 140 | Risk ratio 95% CI | P-value | ICCa | ||||||
|---|---|---|---|---|---|---|---|---|---|---|
| Total | ||||||||||
| Median (IQR) | 1 (0–2) | 2 (0–5) | 0.52 (0.38–0.75) | 0.0004 | −0.04 | |||||
| Age-Specific data | ||||||||||
| <49 years of age | ||||||||||
| Median (IQR) | 0 (0–0) | 0 (0–0) | 0.36 (0.18–0.74) | 0.006 | −0.08 | |||||
| 50–59 years of age | ||||||||||
| Median (IQR) | 0 (0–1) | 0 (0–1) | 0.57 (0.37–0.87) | 0.010 | −0.04 | |||||
| 60–69 years of age | ||||||||||
| Median (IQR) | 0 (0–1) | 0 (0–2) | 0.48 (0.32–0.73) | 0.0004 | 0.05 | |||||
| 70–74 years | ||||||||||
| Median (IQR) | 0 (0–0) | 0 (0–1) | 0.70 (0.44–1.10) | 0.13 | −0.05 | |||||
| 751 years | ||||||||||
| Median (IQR) | 0 (0–1) | 0 (0–1) | 0.88 (0.59–1.33) | 0.55 | 0.03 | |||||
Age-specific data were not available for two GPs allocated to the control group.
ICC for fitted model.
GPs allocated to the intervention group also ordered significantly fewer tests than those in the control group for men younger than 49 years (RR = 0.36; 95% CI 0.18–0.74) (P = 0.006), men aged 50–59 years (RR = 0.57; 95% CI = 0.37–0.87) (P = 0.01) and those aged 60–69 years (RR = 0.48; 95% CI = 0.32–0.73) (P = 0.0004) (Table 5). Differences between groups remained significant when controlling for pre-test ordering for these men aged up to 75 years (P = 0.02) (details available from authors). Fewer tests were ordered by 52.9% (n = 72) and 36.9% (n = 52) of intervention and control group GPs, respectively (P = 0.02). However, 19.1% (n = 26) of GPs allocated to the intervention and 31.9% (n = 45) allocated to the control group ordered more tests at post-test compared with pre-test. Forty-eight (27.9%) and 28 (17.0%) GPs allocated to the intervention and control groups, respectively, ordered one or two fewer tests at post-test compared with pre-test, while 25% (n = 34) and 19.9% (n = 28) respectively reduced testing by three or more tests.
Discussion
Consistent with other government policies, the NHS states that a PSA test “should only be offered after full counselling”.1 Our trial demonstrates that an innovative educational intervention equips GPs better to counsel men and ensure informed decision making. When compared with control group GPs, those receiving our intervention were more likely to disclose to men relevant facts previously identified by experts as essential for men to know before making a decision.14 GPs themselves expressed greater confidence in their capacity to promote informed decision making and were more willing to relinquish decisional control. They themselves demonstrated lower levels of decisional conflict about screening their male patients for prostate cancer. Hence, our intervention engenders a higher ‘threshold’ of professional comfort with the fundamental concept of informed decision making.
GPs' anxieties about medico-legal aspects of PSA screening were assuaged by our programme. By way of explanation, GPs perhaps internalised an acceptable alternative to their previous practice that was evidence-based and for which they were positively rewarded by GP peer educators.
By improving GP knowledge and enhancing their skills to promote informed decision making, our programme resulted in fewer tests being ordered by GPs in the intervention group. Previous research has demonstrated that patient participation in PSA screening is usually uninformed.8 As behavioural change in our GPs occurred in tandem with improvements in their capacity to promote informed decision making, we conclude that GPs facilitated informed decision making in their male patients with an impact on test ordering. However, the effect on individual GPs may have been modest, as only 16% more GPs in the intervention group compared with those allocated to the control group ordered fewer PSA tests at post-test compared with pre-test for men younger than 75 years. If more stringent criteria had been applied to define change in testing behaviour (a reduction in testing by three tests or more), this difference would have been smaller (5.1%). While not statistically significant, fewer tests were ordered by GPs allocated to the intervention group compared with those allocated to the control group at pre-test, a chance imbalance which may have made a post-test difference more likely. As a result of the programme, GPs may have been reluctant to opportunistically conduct PSA screening resulting in fewer tests being ordered. On the other hand, adopting a policy of informing men about PSA may result in more testing or no changes in testing behaviour as men may always place greater emphasis on possibly prolonging life than on iatrogenic consequences of screening. All these explanations are compatible with our results.
Our intervention had a well-defined theoretical basis. Specifically, our intervention applied principles from motivational interviewing12 targeting GPs' stage of change, their perceived importance of patient informed decision making and confidence in performing behaviours required to achieve it. Motivational interviewing predicts that behavioural change ensues when knowledge, skills and attitudes are targeted.12 Few interventions have explicated methods for tailoring interventions to individual GPs' needs, however.34 Future research could further develop motivational interviewing techniques beyond our own application. Our use of peer coaching sessions delivered via telephone is another novel aspect of this research. One particular advantage of our approach was the flexibility for educational sessions to be delivered outside work hours.
Methodologically, the study's successful follow-up of all but two GPs ensures that selection bias did not compromise outcome measures. As a weakness, however, we were unable to examine whether our intervention had a long-term impact due to limited resources. Our low initial response rate may also limit the generalisability of our results. Our response rate is comparable with other interventional studies of this type, however.35 Outcomes as measured in our study must be considered against the usual caveats about the validity and reliability of self-reported data. No other alternatives such as direct observation of clinical consultations or surveys of patients were feasible. However, unobtrusive measures of GP behaviour facilitating patient involvement in PSA screening decisions need to be developed so that interventions similar to ours can be better evaluated before wider adoption can be promoted. Hence, our evaluation is best considered as an efficacy study, conducted with volunteers that demonstrates promise. An effectiveness study is now timely, incorporating longer-term follow-up and utilising measures invulnerable to the biases of self-report. Measures assessing GPs' perceptions of their medico-legal risk or protection as a result of engaging in an informed decision-making process have yet to be developed and were not included as outcomes here. Future research also could employ additional measures of GP behaviour such as patient surveys in which men are asked to report the length and scope of discussions with their GPs about the harms and benefits of PSA screening. Direct observation of consultations would be resource intensive and highly intrusive but invaluable. It may be difficult, however, to observe a sufficient number of consultations during baseline and post-test phases to obtain the required sample size for a research trial utilising direct observation as an outcome.9
Future research also should compare the delivery of academic detailing via telephone, as in our study, with a face-to-face approach. Other areas for future research include the evaluation of motivational interviewing as a model for promoting behavioural change, the number and intensity of the ‘peer coaching sessions’ and a head-to-head comparison of telephone peer coaching versus more direct personal delivery methods.
Identification of components that makes academic detailing more or less effective has thus far eluded researchers.18 Although our programme holds promise, the question of which specific components were responsible for behavioural change remains unanswered. Recent evidence suggests that all the major components of our intervention, including written information, patient educational materials, audit and feedback and peer education are effective in changing clinician behaviour.34 However, it remains unclear which components are most effective for enhancing GPs' communication skills. For PSA test ordering the use of decision-aids for patient involvement may be key and arguably more essential than other components. Future research may need to systematically vary the inclusion of components to identify effective strategies or focus evaluations on comparing a suite of interventions with one or two targeted interventions hypothesised to be integral. Qualitative interviews also may need to be incorporated into evaluations to provide insights into which strategies are perceived to be most effective and valued by participants of educational programmes to aid the selection and uptake of interventions.
Another outcome of interest is the cost of a programme relative to the benefits. We did not conduct a formal economic evaluation. Indeed, the benefits of the programme would be difficult to quantify in monetary terms, as it is difficult to estimate the value of informed decision making and the immediate educational benefits of the programme. We estimated the cost of each GPs' peer education as $A513. Production costs of the patient education booklet, audiotape resource and the purchase of the video ranged from approximately $A3000 to $8000, excluding costs associated with employing staff to write and prepare these. The three educational modules were produced in-house, consuming paper and staff time. Peer educator sessions could be reduced in duration and number, but evidence is lacking on the optimal way in which peer education can be delivered. It is also unclear how to best weigh up the economic costs and benefits of such programmes as ours. Such evidence would clearly guide implementation researchers and policy makers when considering funding for GP educational initiatives.
In conclusion, a ‘peer coaching’ intervention, supplemented by education materials, provided GPs with core competencies to facilitate informed decision making by their male patients about PSA screening. This intervention has been standardised to permit further evaluation by health authorities and researchers committed to the promotion of informed decision making.
Declaration
Funding: MG was supported by an Australian Postgraduate Award and Health Research Foundation Sydney South West Ingham Scholarship and was a student of the School of Public Health, University of Sydney at the time the study was conducted. We also acknowledge NHMRC project grant funding No 993764.
Ethical approval: the Research Ethics Committee of South Western Sydney Area Health Service (Project Number 01/096) approved the study.
Conflicts of interest: none.
We thank the GPs who participated in the study, Stephanie Irwin, Tracey Bruce and Simon Mathews for research assistance; Gladys Kavanagh and Angela Triggs for administrative support; Drs Alison Free, Wendy Hu, Gillian Sanzone, Lucie Stanford, Johnson Tong and Tanya Van Kesteren for their pivotal contribution as ‘peer coaches’. We also thank Associate Professor Colin Thomson and Dr Charles Ovadia for contributing to the CD/Audiotape resource and their feedback.
References
National Health Service. Prostate Cancer Risk Management Prostate Cancer Risk Management. http://www.cancerscreening.nhs.uk/prostate/index.html (last accessed May 6 2004).
Royal Australian College of General Practitioners (RACGP). Guidelines for preventive activities in general practice. Aust Fam Phys
Harris R, Lohr KN. Screening for prostate cancer: an update of the evidence for the U.S. Preventive Services Task Force.
Smith DP, Armstrong BK. Prostate-specific antigen testing in Australia and association with prostate cancer incidence in New South Wales.
Sirovich BE, Schwartz LM, Woloshin S. Screening men for prostate and colorectal cancer in the United States: does practice reflect the evidence?
Pinnock CB, Weller DP, Marshall VR. Self-reported prevalence of prostate-specific antigen testing in South Australia.
Ward J, Girgis S. GPs' estimates of men's risk of prostate cancer and screening expectations.
Diefenbach PN, Ganz PA, Pawlow AJ, Guthrie D. Screening by the prostate-specific antigen test: what do the patients know?
Gattellari M, Young JM, Ward J. GP and patient predictors of PSA screening in Australian general practice.
Austin OJ, Valente S, Hasse LA, Kues JR. Determinants of prostate-specific antigen test use in prostate cancer screening by primary care physicians.
Girgis S, Ward JE, Thomson CJH. General practitioners' perceptions of medicolegal risk.
Miller WR, Rollnick S. Motivational Interviewing. (2nd Edition) New York: The Guildford Press;
Prochaska JO, Di Clemente CC. Towards a comprehensive model of change. In Miller WR, Heather N (eds). Treating addictive behaviours: processes of change. New York: Plenum Press;
Ward JE, Girgis S. Making an ‘informed decision’ about prostate cancer screening: what information is required?
Ward J, Young J, Sladden M. Australian general practitioners' views and use of tests to detect early prostate cancer.
Gattellari M, Ward J. Does evidence-based information about prostate cancer screening enhance consumer decision making? A randomised controlled trial.
Gattellari M, Ward J. A community-based randomised controlled trial of three different educational resources for men about prostate cancer screening. Patient Education and Counseling. Published online 9 December 2004.
Bero LA, Grilli R, Grimshaw JM, Harvey E, Oxman AD, Thomson MA. Closing the gap between research and practice: an overview of systematic reviews of interventions to promote the implementation of research findings.
Thomson O'Brien MA, Oxman AD, Davis DA, Haynes RB, Freemantle N, Harvey EL. Educational outreach visits: effects on professional practice and health care outcomes. Cochrane Effective Practice and Organisation of Care Group. Cochrane Database of Systematic Reviews. Issue 4,
Thomson O'Brien MA, Oxman AD, Davis DA, Haynes RB, Freemantle N, Harvey EL. Audit and feedback: effects on professional practice and health care outcomes. Cochrane Effective Practice and Organisation of Care Group. Cochrane Database of Systematic Reviews. Issue 4,
Thomson O'Brien MA, Oxman AD, Davis DA, Haynes RB, Freemantle N, Harvey EL. Audit and feedback versus alternative strategies: effects on professional practice and health care outcomes. Cochrane Effective Practice and Organisation of Care Group. Cochrane Database of Systematic Reviews. Issue 4,
Bland, JM. Clinstat software, London: St. George's Hospital Medical School, 1998. Available from http://www.sghms.ac.uk/depts/phs/staff/jmb/jmbsoft.htm (last accessed May 6 2004).
Norusis JM/SPSS Inc. SPSS for Windows-based system user's guide release 9.0. Chicago; SPSS Inc;
Entwistle VA, Sowden AJ, Watt IS. Evaluating interventions to promote patient involvement in decision-making: by what criteria should effectiveness be judged?
Young JM, Ward J. Can distance learning improve smoking cessation advice in family practice?
Degner LF, Sloan HA. Decision making during serious illness: what role do patients really want to play?
Dolan JG. A Method for Evaluating Health Care Providers' Decision Making: The Provider Decision Process Assessment Instrument.
Murray DM. Design and analysis of group randomized trials. New York: Oxford University Press;
Grismshaw JM, Thomas RE, MacLennan G, Fraser C, Ramsay CR, Vale L, Whitty P, Eccles MP, Matowe L, Shirran L, Wensing M, Dijkstra R, Donaldson C. Effectiveness and efficiency of guidelines dissemination and implementation strategies. Health Technology Assessment 2004 8. http://www.hta.nhsweb.nhs.uk/fullmono/mon806.pdf (last accessed May 6 2004).
Author notes
aSchool of Public Health and Community Medicine, University of New South Wales and Centre for Research, Evidence Management & Surveillance, South Western Sydney Area Health Service, Locked Bag 7008, Liverpool NSW 1871, bDivision of Population Health, South Western Sydney Area Health Service, Locked Bag 7008, Liverpool NSW 1871, cMayne Health Laverty Pathology, 60 Waterloo Rd, North Ryde NSW 2113 and dMater Health Services, Woolloongabba QLD 4102, Australia.
