


Abstract
The impact of low pathogenic influenza viruses such as subtype H9N2, which infect the respiratory and the gastrointestinal tracts of chickens, on microbial composition are not known. Twenty-day-old specific pathogen-free chickens were assigned to two treatment groups, control (uninfected) and H9N2-infected (challenged via the oral-nasal route). Fecal genomic DNA was extracted, and the V3-V4 regions of the 16S rRNA gene were sequenced using the Illumina Miseq® platform. Sequences were curated using Mothur as described in the MiSeq SOP. Infection of chickens with H9N2 resulted in an increase in phylum Proteobacteria, and differential enrichment with the genera Vampirovibrio, Pseudoflavonifractor, Ruminococcus, Clostridium cluster XIVb and Isobaculum while control chickens were differentially enriched with genera Novosphingobium, Sphingomonas, Bradyrhizobium and Bifidobacterium. Analysis of pre- and post-H9N2 infection of the same chickens showed that, before infection, the fecal microbiota was characterized by Lachnospiracea and Ruminococcaceae family and the genera Clostridium sensu stricto, Roseburia and Lachnospiraceae incertae sedis. However, post-H9N2 infection, class Deltaproteobacteria, orders Clostridiales and Bacteroidiales and the genus Alistipes were differentially enriched. Findings from the current study show that influenza virus infection in chickens results in the shift of the gut microbiota, and the disruption of the host-microbial homeostasis in the gut might be one of the mechanisms by which influenza virus infection is established in chickens.
INTRODUCTION
Influenza A viruses, categorized into highly pathogenic (HP) and low pathogenic (LP) avian influenza (AI), infect chickens and other animals including swine, horses and marine mammals. HPAI viruses are often associated with significant losses to the poultry industry, and potential epidemics and pandemics in human populations. Globally, infections with some LPAI, such as subtype H9N2, have become more prevalent in poultry since the early 1990s accompanied by high morbidity and mortality and a marked reduction in egg production of laying hens (Bano, Naeem and Malik 2003; Alexander 2007; Umar, Guerin and Ducatez 2016). Furthermore, H9N2 poses a significant public health threat as it can replicate in permissive mammalian tissues without prior adaptation (Lin et al.2000; Wan et al.2008; Zhang et al.2013), and previous reassortant isolates of HPAI in humans were shown to carry internal genes from avian H9N2 viruses (Lin et al.2000; Shi et al.2013; Guan, Fu and Sharif 2015). Therefore, in addition to improving poultry health and productivity, control or reduction of H9N2-associated outbreaks in chickens can have important benefits in reducing exposure of humans and other mammals to the virus.
In chickens, LPAI viruses have tropism for several tissues, including the gastrointestinal tract (GIT) (Post et al.2012). The GIT of chickens and other mammals is inhabited by a complex and diverse microbiota, which includes bacteria, Archaea, fungi, viruses and eukaryotes (Hooper and Gordon 2001; Gong et al.2007; Yeoman et al.2012). While the host influences the composition of the microbiota, it also benefits in different ways including, but not limited to, host metabolism, nutrition, immune development and modulation, and resistance to infection (Bäckhed et al.2005; Hooper, Littman and Macpherson 2012). Transkingdom interactions where enteric viruses regulate or are themselves regulated by other members of the microbiota have recently been shown to be important conditions for enteric virus replication, transmission, and disease development and progression (Pfeiffer and Virgin 2016). The gut microbiota can promote viral infections as in the case of poliovirus, reovirus and retroviruses, such as mouse mammary tumor virus, while it can also have a protective role in other viral infections such as rotavirus, influenza virus, lymphocytic choriomeningitis virus and dengue virus (Kuss et al.2011; Robinson and Pfeiffer 2014; Robinson, Jesudhasan and Pfeiffer 2014).
A shift in the composition of the gut microbiota towards unhealthy imbalance, also known as dysbiosis, has been associated with various diseases (Spor, Koren and Ley 2011). Both germ-free and antibiotic-treated mice showed exaggerated influenza pathogenesis, and the administration of poly I:C, a dsRNA molecule with innate immune stimulating property by binding Toll-like receptor 3, resulted in reduced mortality suggesting a strong link between a balanced gut microbiota and resistance to influenza virus infection (Ichinohe et al.2011; Abt et al.2012; Wang et al.2014). Specific members of the gut microbiota, especially neomycin-susceptible bacteria, were able to confer protection against influenza virus infection, and in both mice and humans, influenza virus infection was shown to alter the composition of the gut microbiota (Ichinohe et al.2011; Qin et al.2015; Deriu et al.2016).
Recently, Marek's disease virus (MDV) infection of chickens, a typical lymphoproliferative disease, was shown to result in dysbiosis of the gut microbiota corresponding with the life cycle of MDV in early and late phases of infection, even though the mode of action and whether there is a direct or indirect effect of the virus on the microbiota are still unknown (Perumbakkam, Hunt and Cheng 2014, 2016). These studies highlighted the presence of a transkingdom interaction in the chicken gut between viruses and the microbiota. Little is known about the effect of viral infection on the composition of the gut microbiota of chickens, even though all existing evidence from other vertebrates suggests that viral pathogens may influence the composition of the gut microbiota to establish infections (Pfeiffer and Virgin 2016). Therefore, the current study was conducted to study the fecal microbiota of chickens after influenza A virus subtype H9N2 infection.
MATERIALS AND METHODS
Experimental design
All experimental procedures were approved by the University of Guelph Animal Care Committee and conducted according to specifications of the Canadian Council on Animal Care (CCAC). Chickens were handled according to the guidelines described by the CCAC (CCAC, 1993). Twenty-day-old specific pathogen-free (SPF) chickens (CFIA, Ottawa Laboratory, Nepean, ON, Canada) were randomly assigned to three treatment groups, which included a control (uninfected chickens), and a group pre-H9N2 infection (Day 0) and post-H9N2 infection. All chickens were kept in Horsfall units in a Biosafety level II isolation facility at the University of Guelph, Ontario, Canada. All chickens were kept under the same environmental condition, and antibiotic-free diet and water were provided ad libitum.
Virus propagation and infection of chickens
Embryonated SPF chicken eggs (CFIA, Ottawa Laboratory, Nepean, ON, Canada) were incubated at 37°C for 10 days before inoculating each egg with 4HA units of A/turkey/Wisconsin/1/1966 (H9N2), and further incubated for 72 h at 35°C. Embryos were monitored every 24 h, and dead embryos were discarded. At 72 h of incubation, eggs were kept at 4°C overnight, and then allantoic fluid was collected after centrifugation at 400× g for 5 min, pooled and stored at –80°C until further use. Virus titer of allantoic fluid was determined using Tissue Culture Infectious Dose50 (TCID50) on Madin–Darby canine kidney (MDCK) cells, and chickens in the H9N2 group were infected via the oral–nasal route with 400 μL of 107 TCID50/mL (200 μL/each route). Cloacal swabs were collected at Days 1, 3, 5, 7 and 9 post-infection, and TCID50 on MDCK cells was used to determine virus shedding.
DNA extraction and 16S rRNA gene sequencing
Fecal samples were collected using swabs at Days 1, 3, 5, 7 and 9 post-infection from the same five chickens per treatment and immediately frozen at –80 °C. Furthermore, for H9N2-challenged group, fecal samples were collected from the five chickens before infection to compare changes because of H9N2 infection within the same group. Microbial genomic DNA extraction was performed with ZR fecal DNA kit (D6010; ZymoResearch Corp., CA, USA) according to manufacturer's instruction. DNA concentrations were measured with a Qubit while DNA quality was assessed with a Nanodrop 1000. The V3-V4 hypervariable region of the 16S rRNA gene was PCR-amplified and sequenced on Illumina MiSeq (Illumina, San Diego, CA) using a dual-indexing strategy for multiplexed sequencing developed at the University of Guelph's Genomics Facility, Advanced Analysis Centre (Guelph, ON, Canada) as described previously (Fadrosh et al.2014).
Sequence processing and bioinformatics analysis
Sequences were curated using Mothur v.1.36.1 as described in the MiSeq SOP (Kozich, Westcott and Baxter 2013). Briefly, contigs were generated followed by screening to remove sequences with ambiguous base pairs and those with a length inconsistent with the target region using the screen.seqs command. Duplicate sequences were merged using the unique.seqs command followed by the alignment of the resulting non-redundant sequences to a trimmed references of SILVA 102 bacterial database (Quast et al.2013) using the align.seqs command.
Trimmed references of SILVA 102 bacterial database customized to our region of interest was created using the pcr.seqs command on an Escherichia coli sequence with the primers followed by the alignment of the product to silva.bacteria.fasta and running summary.seqs command on the aligned sequence to obtain the start and stop coordinates. Sequences that were aligned to the expected position were then kept for further processing and analysis. The unique.seqs command was then used to create non-redundant sequences of the aligned reads followed by the removal of chimeric sequences using the chimera.uchime (Edgar et al.2011) and remove.seqs commands. Lineages belonging to chloroplasts, mitochondria, Archaea or eukaryotes were removed using remove.lineage command. Sequences were binned into operational taxonomic units (OTUs) using the average neighbor algorithm with the cluster.split command (taxlevel = 5, cutoff = 0.07), and were then used before conversion to .shared format using the make.shared command followed by generation of consensus taxonomy for each OTU using the classify.otu command. The sub.sample command in mothur was then used to ensure the same number of sequences, 9117 sequences, for each sample. Taxonomy was also assigned to each sequence using the Ribosomal Database Project (RDP) bacterial taxonomy classifier. Significant differences (P values) for relative abundance were adjusted for false discovery rates using Benjamini–Hochberg procedure.
All OTU-based analyses were performed in Mothur. The phyloseq package in R (McMurdie and Holmes 2013) was used to analyze the data set among the two groups, both in individual days as well as on a compiled data set, using the permutation-based multivariate ANOVA (PERMANOVA) and Bray–Curtis dissimilarity. A permutation of 9999 of raw data units was used to calculate the P values. Non-metric multidimensional scaling (NMDS) was performed with Bray–Curtis dissimilarities. In order to identify and visualize taxa with differential abundance in the control and H9N2-infected chickens, the linear discriminant analysis (LDA) Effect Size (LEfSe) algorithm was used where treatment groups were assigned as comparison classes, and LEfse-identified features that were statistically different between the two treatments were then compared using the non-parametric factorial Kruskal–Wallis sum-rank test, and LDA > 2 and a significant alpha value of less than 0.05 (Segata et al.2011).
RESULTS
Viral load and shedding peaks at Day 5 post-infection
Virus shedding was detected by TCID50 by titrating the cloacal swab samples on monolayers of MDCK cells. Virus shedding in the cloacal swabs of chickens showed an incremental increase until Day 5 post-infection and declined thereafter with no cytopathic effects in the MDCK cells observed by Day 9 post-infection (Fig. 1). All control chickens were confirmed to be negative for the virus at all time points (data not shown).
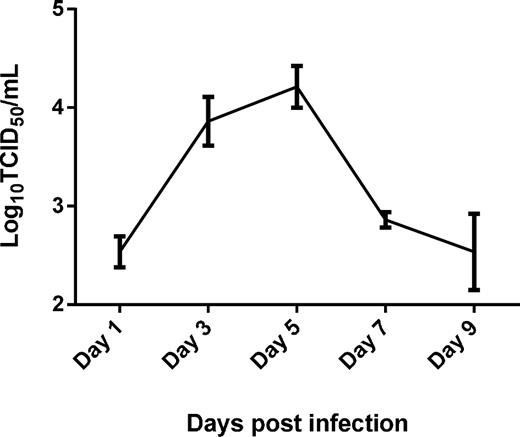
Cloacal H9N2 virus titer in chickens infected with 400 μL of 107 TCID50/mL LPAI H9N2. Virus titer was determined at Days 1, 3, 5, 7 and 9 post-infection using TCID50 in MDCK cells.
Alpha and beta diversity
Fecal samples were collected from each chicken at 1, 3, 5, 7 and 9 days post-infection. DNA was extracted from each sample and libraries prepared based on the V3-V4 hypervariable regions of the 16S rRNA gene. Sequences were multiplexed on a single run of an Illumina MiSeq run and 2.3 million sequence reads generated (mean and median reads of 26 925 and 1142 815 sequences per sample, respectively). Based on Good's coverage at 97% threshold, the sampling completeness was estimated at an average of 98% (with a range of 97% to 99%), while species richness and diversity were not significantly different at all time points between control and H9N2 groups (Fig. 2). Beta diversity analysis showed that there was a significant day effect (P = 0.028) as calculated by the overall PERMANOVA analysis, while no significant effect was observed between control and H9N2-infected groups (Table 1). Comparison of pre- and post-H9N2 infection of the same chickens showed significant (P < 0.012) changes in diversity between pre-infection (Day 0) and all time points after Day 3 post-infection, while no significant difference was observed between pre-infection and Day 1 post-infection (P = 0.097). No significant difference in beta diversity was observed among all days post-H9N2 infection when samples of the same chickens were analyzed (P > 0.378) (Table 2; Fig. 3). Principal coordinates analysis (PCoA) and NMDS ordination plots also supported this observation where a clustering of the control group was observed compared to the H9N2-infected chickens (Fig. 4A). Plots of PCoA and NMDS for pre- and post-infection showed a trend for clustering by category of pre-infection and post-infection (Fig. 4B).
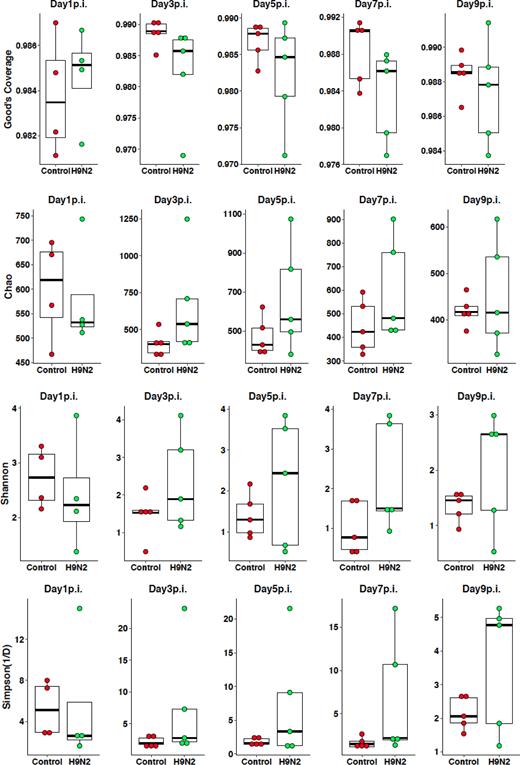
Alpha diversity comparisons of control and H9N2-infected chickens. Chickens were infected with 400 μL of 107 TCID50/mL of H9N2 influenza virus.
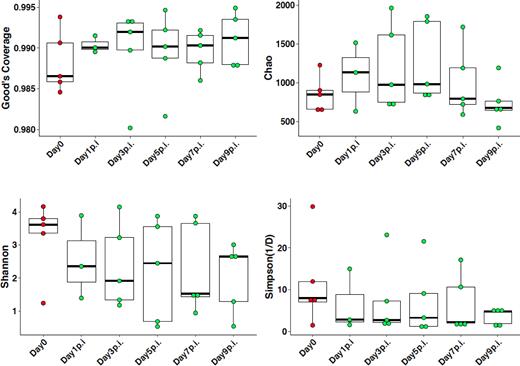
Alpha diversity comparisons of pre- and post-H9N2-infected chickens. Fecal samples were collected before challenge (Day 0) and Days 1, 3, 5, 7 and 9 post infection of chickens that were infected with 400 μL of 107 TCID50/mL of H9N2 influenza virus.
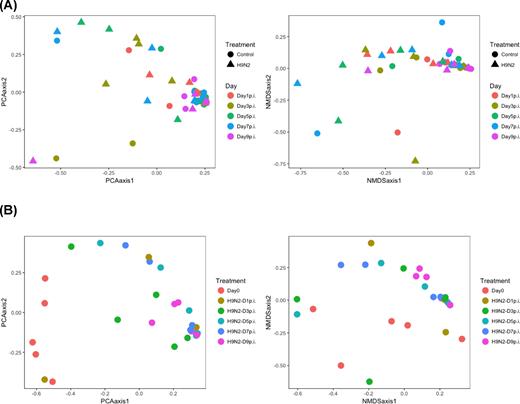
(A) PCoA and NMDS plots illustrating the chicken fecal microbiome beta diversity by comparing control and H9N2 groups at different time points. (B) PCoA and NMDS plots illustrating the chicken fecal microbiome beta diversity of both pre- and post-infection where samples were collected at Day 0 (pre-infection) and Days 1, 3, 5, 7 and 9 post infection from the same chickens.
Overall PERMANOVA test of control versus H9N2-infected chickens.
| Factor | AMOVA P-value (MC) |
|---|---|
| Treatment | 0.062 |
| Day | 0.028 |
| Day 1 p.i. | 0.505 |
| Day 3 p.i. | 0.424 |
| Day 5 p.i. | 0.327 |
| Day 7 p.i. | 0.066 |
| Day 9 p.i. | 0.106 |
| Factor | AMOVA P-value (MC) |
|---|---|
| Treatment | 0.062 |
| Day | 0.028 |
| Day 1 p.i. | 0.505 |
| Day 3 p.i. | 0.424 |
| Day 5 p.i. | 0.327 |
| Day 7 p.i. | 0.066 |
| Day 9 p.i. | 0.106 |
P values are based on 9999 Monte Carlo (MC) permutations.
No Day × treatment interaction effects were observed.
Overall PERMANOVA test of Pre- and post-H9N2 challenge of chickens.
| Factor | AMOVA P value (MC) |
|---|---|
| Day 0 vs Day 1 p.i. | 0.097 |
| Day 0 vs Day 3 p.i. | 0.011 |
| Day 0 vs Day 5 p.i. | 0.003 |
| Day 0 vs Day 7 p.i. | 0.012 |
| Day 0 vs Day 9 p.i. | 0.009 |
| Day 1 p.i. vs Day 3 p.i. | 1.000 |
| Day 1 p.i. vs Day 5 p.i. | 0.482 |
| Day 1 p.i. vs Day 7 p.i. | 0.525 |
| Day 1 p.i. vs Day 9 p.i. | 0.421 |
| Day 3 p.i. vs Day 5 p.i. | 0.859 |
| Day 3 p.i. vs Day 7 p.i. | 0.812 |
| Day 3 p.i. vs Day 9 p.i. | 0.422 |
| Day 5 p.i. vs Day 7 p.i. | 0.958 |
| Day 5 p.i. vs Day 9 p.i. | 0.378 |
| Day 7 p.i. vs Day 9 p.i. | 0.582 |
P values are based on 9999 Monte Carlo (MC) permutations.
Bacterial taxa associated with H9N2 infection in chickens
Supervised comparison of control and H9N2-infected chickens using the LEfSe algorithm and logarithmic LDA (P = 0.05, LDA score of at least 2) to identify differential abundance associated with control and H9N2 infection of chickens showed that the phyla Firmicutes and Proteobacteria were differentially enriched in H9N2-infected chickens. Class Negativicutes order Slenomonadales were only differentially enriched in H9N2-infected chickens. At the family level of classification, control groups were enriched with Bradyrhizobiaceae, Bifidobacteriaceae, Sphingomonadaceae, while H9N2-infected chickens were differentially enriched with Bdellovibrionaceae, and Cryomorphaceae. Furthermore, when chickens were infected with H9N2, their fecal microbiota was characterized by an abundance of the genera Vampirovibrio, Pseudoflavonifractor, Ruminococcus, Clostridium cluster XIVb and Isobaculum, while control chickens were differentially enriched with genera Novosphingobium, Sphingomonas, Bradyrhizobium and Bifidobacterium (Fig. 5A and B).
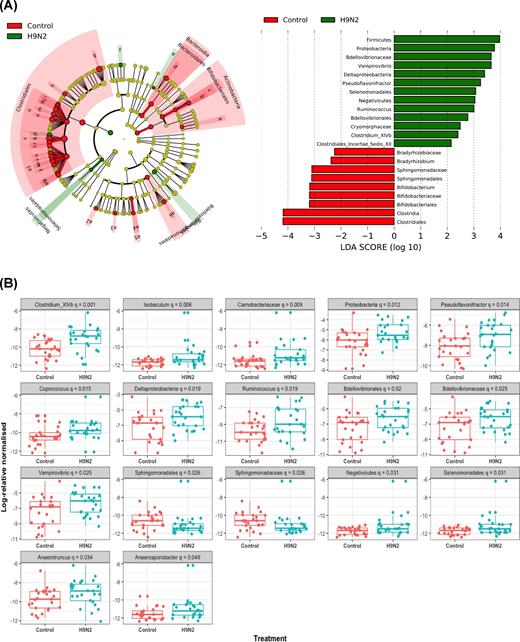
(A) Lefse analysis generated taxonomic cladogram of the 16S sequences of control (red) and H9N2 (green) infected chickens. Brightness of each dot in the cladogram is proportional to its effect size. Control chicken taxa are indicated with a negative LDA score (red), and H9N2-infected chicken's taxa have a positive score (green). Horizontal bars show only taxa with a significant LDA threshold value of >2. (B) Bacterial phyla with significantly different relative abundances between control and H9N2-infected chickens (Kruskal–Wallis test, P < 0.05).
Relative abundance at the phylum level of the same chickens pre- and post-infection was not significantly different among days, both pre- and post-infection and all comparisons among post-infection time points (P > 0.05). Supervised comparison using the LEfSe algorithm and logarithmic LDA (P = 0.05, LDA score of at least 2) to identify differential abundance of fecal microbiota, both pre- and post-infection showed that at Day 0 (pre-challenge), the fecal microbiota was characterized by Lachnospiracea and Ruminococcaceae family and the genera Clostridium sensu stricto, Roseburia and Lachnospiraceae incertae sedis. At Days 1 and 3, post-infection, differential enrichment with order Clostridiales and phylum Firmicutes, respectively, was observed. At Day 5 post-infection, the order Bacteroidiales of class Bacteroidia, the genus Alistipes of the family Rikenellaceae and class Deltaproteobacteria were differentially enriched. At Day 9 post-infection, Clostridaceae 1 family and the genus Vampirovibrio were differentially enriched (Fig. 6A and B).
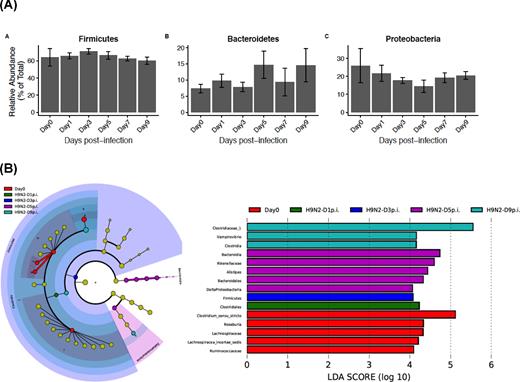
(A) Relative abundance of fecal microbiota of pre- (Day 0) and post-infection of chickens with H9N2. (B) Lefse analysis generated taxonomic cladogram of the 16S sequences of pre- (Day 0) and post-infection of chickens with H9N2. Brightness of each dot in the cladogram is proportional to its effect size. Control chicken taxa are indicated with a negative LDA score (red), and H9N2-infected chicken's taxa have a positive score (green). Horizontal bars show only taxa with a significant LDA threshold value of >2 and P < 0.05.
DISCUSSION
The interaction between two members of the gut microbiome, viruses and bacteria has recently been shown to play a role in enteric virus replication, transmission and disease (Pfeiffer and Virgin 2016). In most cases, the surfaces of the body that are colonized with microbiota are the main ports of entry for pathogens, highlighting the important evolutionary mutual relationship of commensal microbiota and mucosal surfaces in the protection against pathogens. Influenza virus infection in chickens occurs via the mucosal route, which includes the upper respiratory system and the GIT. As in all vertebrates, the chicken mucosal surfaces are inhabited by diverse populations of microbiota, which play a crucial role in health and disease (Gong et al.2007; Yeoman et al.2012). Therefore, the current study was conducted to assess the effect of influenza virus subtype H9N2 infection of chickens on the composition of fecal microbiota.
Infection of chickens with H9N2 was detected by testing for virus shedding using cloacal swabs, which showed the highest virus shedding at Day 5 post-infection and resolving after Day 7 post-infection. This is in agreement with previous studies where infection of chickens with H9N2 resulted in a peak of shedding at Day 5 to 7 post-infection and resolving by Day 10 post-infection (Iqbal et al.2013; Ruiz-Hernandez et al.2016; Singh et al.2016).
Microbial analysis that showed an estimated average, Good's coverage of 98% (with a range of 97%–99%), suggests that the majority of the microbial phylotypes in the fecal samples were identified. Compared to uninfected chickens, infection of chickens with H9N2 was shown to result in higher relative abundance of phylum Proteobacteria. In a human study with H7N9 infection, Proteobacteria were shown to be the dominant phyla regardless of antibiotic administration (Qin et al.2015). Proteobacteria, which includes several pathogens such as some members of E. coli, Shigella, Salmonella and Klebsiella, have previously been correlated with a pro-inflammatory response, mostly with a strong interleukin (IL)-6 expression (Oakley and Kogut 2016). Vampirovibrio genus was highly enriched in H9N2-infected chickens in the current study, and previously has been associated with increased IL-6 expression (Oakley and Kogut 2016). Furthermore, the genus Ruminococcus, which has previously been positively correlated with IL-1β and IL-6 expression (Oakley and Kogut 2016), was significantly enriched in the microbiota of H9N2-infected chickens in the current study. Here, we have demonstrated that the genus Clostridium cluster XIVb was significantly enriched in H9N2-infected chickens compared to control animals. Previously, this genus was shown to be significantly reduced in fecal samples of human patients with viral (HIV) infection, while it was correlated significantly with systemic inflammatory cytokines (Ling et al.2016). Clostridium cluster XIVb contains butyrate-producing bacteria, which when present in abundance in the gut can result in stronger epithelial-barrier integrity and proliferation and reduced inflammatory reactions by stimulating regulatory T cells (Lopetuso et al.2013; Onrust et al.2015). This might be important in the restoration of intestinal homeostasis and virus resolution, thereby avoiding excessive inflammation after H9N2 infection. Furthermore, this finding further highlights the possibility of using either butyrate-producing bacteria as probiotics or butyrate supplementation to restore gut microbiota after influenza virus infection. However, this needs to be further investigated with higher sample numbers in chickens.
In the current study, comparison of differential abundance of microbiota of the same chickens pre- and post-H9N2 infection showed that pre-infection period was characterized by Lachnospiracea and Ruminocacaceae family and the genera Clostridium sensu stricto, Roseburia and Lachnospiraceae incertae sedis. Lachnospiraceae, which also includes genus Roseburia, have been associated with degradation of complex polysaccharides in the gut and production of short-chain fatty acids such as acetate, butyrate and propionate that are a major energy source for the host and are important for epithelial tissue integrity and health (Biddle et al.2013). In HIV-infected individuals, a significant decrease in Lachnospiraceae families in HIV versus healthy controls was previously reported (Zilberman-Schapira et al.2016). At Day 5 post-infection, which also corresponds with high virus shedding, the genus Alistipes of the family Rikenellaceae and class Deltaproteobacteria were differentially enriched. In human patients, the genus Alistipes has been over-represented with depression (Jiang et al.2015), and in patients with irritable bowel syndrome, higher levels of Alistipes were associated with abdominal pain and possibly gut inflammation (Saulnier et al.2011).
The findings of the current study are also in agreement with previous studies in which infection of mice with influenza virus resulted in disruption of the gut microbiota, and phylum Proteobacteria was shown to be significantly higher in those infected compared to non-infected animals (Deriu et al.2016). This disruption was reported to be type I interferon dependent. Type I interferon responses, which include interferon (IFN)-α and IFN-β, are normally upregulated immediately after infection of chickens and other animals with LPAI viruses (Cornelissen et al.2012; Barjesteh et al.2015). Previously, type I interferon responses of intestinal epithelial cells, mainly Paneth cells, were shown to regulate host–microbiota relationship (Tschurtschenthaler et al.2014). In non-infected animals, microbial colonization was shown to downregulate type I interferon responses to avoid excessive inflammation in the intestine (Munakata et al.2008). After viral infection, gut microbiota condition mononuclear phagocytic cells throughout the body for rapid type I interferon production by providing a tonic signal through IFN-I receptor (Abt et al.2012; Cho and Kelsall 2014). Other previously reported mechanisms that might be involved in the dysbiosis of the gut microbiota after influenza infection are the inflammasome pathways where deficiency in this pathway has been associated with dysbiosis of the gut microbiota and reduced enteric pathogens’ clearance (Elinav et al.2011; Ignacio et al.2016). Influenza viruses also use the structural protein NS1 to inhibit the activation of NLRP3 (Cheong et al.2015). Therefore, the inhibition of the inflammasome pathway by influenza viruses might be one of the mechanisms by which H9N2 infection resulted in changes in the composition of the gut microbiota of chickens in the current study. Whether influenza virus infection in chickens has a direct effect on the gut microbiota, or whether it affects the composition of the gut microbiota by changing the transcriptional profile of innate response associated genes, especially type I interferons and the inflammasome pathways, needs further investigation.
CONCLUSIONS
Infection of chickens with LPAI H9N2 virus was associated with a shift in the composition of fecal microbiota of chickens. Higher Proteobacteria were associated with H9N2 infection compared to uninfected control chickens. Furthermore, H9N2-infected chickens were associated with differential enrichment of the genera Vampirovibrio, Pseudoflavonifractor, Ruminococcus, Clostridium cluster XIVb and Isobaculum, while control chickens were differentially enriched with genera Novosphingobium, Sphingomonas, Bradyrhizobium and Bifidobacterium. The current study highlights that there may be an interaction of influenza virus and intestinal gut microbiota in chickens.
Acknowledgements
The authors wish to acknowledge the staff at the Animal Isolation Unit and the Genomics Facility, University of Guelph. We are especially thankful for the support from Leah Read for all laboratory work.
FUNDING
This work was supported by the Ontario Ministry of Agriculture, Food and Rural Affairs (OMAFRA), the Canadian Poultry Research Council (CPRC) and Agriculture and Agri-Food Canada. This research is supported in part by the University of Guelph's Food from Thought initiative, thanks to funding from the Canada First Research Excellence Fund. Alexander Yitbarek is the recipient of the Ontario Veterinary College Scholarship, Queen Elizabeth II Graduate Scholarship in Science & Technology and the Canadian Poultry Research Council Scholarship.
Conflict of interest. None declared.
