


Bacteria can evolve rapidly under positive selection owing to their vast numbers, allowing their genes to diversify by adapting to different environments. We asked whether the same genes that evolve rapidly in the long-term evolution experiment (LTEE) with Escherichia coli have also diversified extensively in nature. To make this comparison, we identified ∼2000 core genes shared among 60 E. coli strains. During the LTEE, core genes accumulated significantly more nonsynonymous mutations than flexible (i.e., noncore) genes. Furthermore, core genes under positive selection in the LTEE are more conserved in nature than the average core gene. In some cases, adaptive mutations appear to modify protein functions, rather than merely knocking them out. The LTEE conditions are novel for E. coli, at least in relation to its evolutionary history in nature. The constancy and simplicity of the environment likely favor the complete loss of some unused functions and the fine-tuning of others.
Introduction
By combining experimental evolution and genomic technologies, researchers can study in fine detail the genetic underpinnings of adaptation in the laboratory (Barrick and Lenski 2013). However, questions remain about how the genetic basis of adaptation might differ between experimental and natural populations (Bailey and Bataillon 2016).
To address that issue, we examined whether the genes that evolve most rapidly in the long-term evolution experiment (LTEE) with Escherichia coli also evolve and diversify faster than typical genes in nature. If so, the genes involved in adaptation in the LTEE might also be involved in local adaptation to diverse environments in nature. On the other hand, it might be the case that the genes involved in adaptation during the LTEE diversify more slowly in nature than typical genes. Perhaps these genes are highly constrained in nature by purifying selection. For example, they may play important roles in balancing competing metabolic demands or fluctuating selective pressures in the complex and variable natural world, but they can be optimized to fit the simplified and stable conditions of the LTEE.
To test these alternative hypotheses, we compare the signal of positive selection across genes in the LTEE to the sequence diversity in a set of 60 clinical, environmental, and laboratory strains of E. coli—henceforth, the “E. coli collection”—and to the divergence between E. coli and Salmonella enterica genomes, respectively. We find that the genes that have evolved the fastest in the LTEE, based on parallel nonsynonymous mutations that are indicative of positive selection, tend to be conserved core genes in the E. coli collection. We can exclude recurrent selective sweeps at these loci in nature as an explanation for their limited diversity because the genes and the particular amino-acid residues under positive selection in the LTEE have diverged slowly since the Escherichia–Salmonella split. We also present structural evidence that some of the nonsynonymous mutations—especially those where identical amino-acid changes evolved in parallel—are beneficial because they fine-tune protein functions, rather than knocking them out.
Material and Methods
Panortholog Identification in the E. coli Collection
We downloaded the nucleotide and amino-acid sequences from GenBank for 60 fully sequenced E. coli genome accessions (supplementary table S1, Supplementary Material online). We refer to this diverse set of clinical, environmental, and laboratory strains as the E. coli collection. We identified 1968 single-copy orthologous genes, or panorthologs, that are shared by all 60 strains in the E. coli collection using the pipeline described in Cooper et al. (2010). To guard against recent gene duplication or horizontal transfer events, we confirmed that none of these panorthologs had better local BLAST hits in any given genome. We refer to these panorthologs as core genes, and to other genes that are present in only some of the E. coli collection as flexible genes. We realize that several strains in this collection are, to varying degrees, redundant; nonetheless, our findings are robust. We reran our analyses on a non-redundant subset of 15 genomes in the E. coli collection (NC_000913, NC_002695, NC_011415, NC_011601, NC_011745, NC_011750, NC_011751, NC_012967, NC_013353, NC_013654, NC_017634, NC_017641, NC_017644, NC_017663 and NC_018658). Sequence diversity estimates from the complete E. coli collection are lower than estimates from the nonredundant subset of 15 genomes, as expected. The core genome of the full E. coli collection is also smaller at 1,968 genes, in contrast to 2,656 for the non-redundant subset of 15 genomes, which justifies the use of the complete collection in identifying a more tightly constrained set of core genes.
The NCBI Refseq accession for the ancestor of the LTEE, E. coli B strain REL606, is NC_012967. The accession for the S. enterica strain used as an outgroup is NC_003197. We downloaded E. coli and S. enterica orthology information from the OMA orthology database (Altenhoff et al. 2015), examining only the one-to-one matches. For internal consistency, we also used the panortholog pipeline to generate one-to-one panorthologs between E. coli B strain REL606 and S. enterica. We analyzed the 2,853 panortholog pairs that the pipeline and the OMA database called identically.
Analysis of the Keio Collection
We downloaded data on essentiality and growth yield in rich and minimal media for the Keio collection of single-gene knockouts in E. coli K-12 from the supplementary tables in the paper describing that collection (Baba et al. 2006). We classified the knocked-out genes as panorthologs (i.e., core) or not (i.e., flexible), and we compared differences in essentiality and growth yield between the two sets of genes.
Nonsynonymous and Synonymous Mutations in the LTEE at 50,000 Generations
We identified all mutations in protein-coding genes in the whole-genome sequences of single clones isolated from each of the 12 LTEE populations at 50,000 generations. These 12 genomes are among the 264 genomes from various generations described by Tenaillon et al. (2016). Six of the 12 populations descend from REL606, and six from REL607 (Lenski et al. 1991). These ancestral strains differ by point mutations in the araA and recD genes (Tenaillon et al. 2016), and those mutations were thus excluded from our analysis. These 12 independently evolved genomes were used specifically in the initial categorical analyses reported in the section on “Core Genes Evolve Faster than Flexible Genes in the LTEE.”
G Scores and Positive Selection on Genes in the LTEE
We use the G-score statistics reported in supplementary table 2, Supplementary Material online of Tenaillon et al. (2016) as a measure of positive selection at the gene level in the LTEE. The G score for each gene reflects, in a likelihood framework, the number of independent nonsynonymous mutations in nonmutator lineages relative to the number expected given the length of that gene’s coding sequence (relative to all coding sequences) and the total number of such mutations. In this analysis, the nonmutator lineages included the six LTEE populations that never evolved point-mutation hypermutability as well as lineages in the other populations before they became hypermutators. This analysis used the whole-genome sequences from all 264 clones isolated at 11 time points through 50,000 generations of the LTEE; only independent mutations were counted, but they were not necessarily present in the 50,000-generation samples.
Sequence Diversity and Divergence
We adapted Nei’s nucleotide diversity metric (Nei and Li 1979) for use with amino-acid sequences to reflect nonsynonymous differences. Specifically, we calculated the mean number of differences per site between all 1770 (i.e., 60 × 59/2) pairs of sequences in the protein alignments from the 60 genomes in the E. coli collection. We counted each site in an indel between two sequences separately, so an indel that affected 10 amino-acid residues would count as 10 differences, even though it was probably caused by a single mutational event. In the site-specific analysis, we calculated this diversity metric separately for the sites that evolved in the LTEE and those that did not, and we compared the values to see if the former also tended to vary in nature. For the sequence divergence between E. coli and S. enterica, we used the ancestral strain of the LTEE, REL606, as the representative E. coli genome in order to maximize the number of orthologous genes available in our analysis. The divergence for each gene was calculated as the proportion of amino-acid residues that differ between the two aligned proteins, where an amino-acid difference implies at least one nonsynonymous change in the corresponding codon since the most recent common ancestor of the two alleles.
Mapping Mutations onto Protein Structures
The full-length amino-acid sequence of 10 proteins (spoT, nadR, atoC, infC, rpsD, hflB, yijC, pykF, rplF, and infB) were aligned using Jackhmmer (HMMER version 3.1b2, February 2015; http://hmmer.org/) against the PDB sequence database at www.rcsb.org (Berman et al. 2000, downloaded August 29, 2016). Mutated residues were visualized on the structure that had the best hit to the amino-acid sequence. We also did a manual search for more recent PDB structures. In those cases where the best available structure was not from E. coli, we extracted the correct residue numbering from the Jackhmmer alignment. In all cases, we checked the residue numbering between the LTEE protein and the PDB structure by hand.
Computational and Statistical Analyses
All data tables and analysis scripts have been deposited in the Dryad Digital Repository (doi:10.5061/dryad.2875k.2). We used MAFFT sequence alignment software (Katoh and Standley 2013) and the Biopython library (Cock et al. 2009) in our analysis scripts.
Results
Core Genes Are Functionally Important
To make consistent comparisons between the LTEE lines and the E. coli collection, we analyzed single-copy genes with homologs in all 60 sequenced genomes in the E. coli collection. For the purpose of our study, we define this set of panorthologous genes as the E. coli core genome and the set of all other genes as the flexible genome (Materials and Methods). We used published data from the Keio collection of single-gene knockouts in E. coli K-12 (Baba et al. 2006) to test whether the core genes tend to be functionally more important than the flexible genes based on essentiality and growth yield. As expected, core genes are indeed more essential than flexible genes (Welch’s t = 6.60, d.f. = 3387.8, one-tailed P < 10−10), and knockouts of core genes cause larger growth-yield defects than do knockouts of flexible genes in both rich (Welch’s t = 3.79, d.f. = 3379, one-tailed P < 0.0001) and minimal media (Welch’s t = 4.95, d.f. = 3457.3, one-tailed P < 10−6).
Core Genes Evolve Faster than Flexible Genes in the LTEE
We first examined the mutations in single genomes sampled from each of the 12 LTEE populations after 50,000 generations. Six of these populations evolved greatly elevated point-mutation rates at various times during the LTEE (Sniegowski et al. 1997; Blount et al. 2012; Wielgoss et al. 2013; Tenaillon et al. 2016). As a consequence of their much higher mutation rates, a much larger fraction of the mutations seen in hypermutable populations are expected to be neutral or even deleterious passengers (hitchhikers), as opposed to beneficial drivers, in comparison to those populations that retained the low ancestral point-mutation rate (Tenaillon et al. 2016). In genomes from the nonmutator populations, we observe a highly significant excess of nonsynonymous mutations in the core genes. Specifically, the core genes constitute ∼48.5% of the total coding sequence in the genome of the ancestral strain, but ∼71% (123/174) of the nonsynonymous mutations in the 50,000-generation clones are found in the core genes (table 1, row 1, P < 10−8). However, there is no significant difference in essentiality between the core genes with zero versus one or more nonsynonymous mutations (Welch’s t = 1.56, d.f. = 180.6, two-tailed P = 0.1204), so there is no evidence that core genes evolving in the LTEE are either enriched or depleted for essential genes.
Nonsynonymous Mutations are Over-represented in the Core Genome of Nonmutator LTEE Populations
| Category and Population | Core | Flexible | Odds Ratio | Significance |
|---|---|---|---|---|
| Nonsynonymous mutations in nonmutator populations | 123 | 51 | 2.41 | P < 10−8 |
| Synonymous mutations in nonmutator populations | 10 | 10 | 1.00 | P = 1.0000 |
| Nonsynonymous mutations in mutator populations | 2265 | 2510 | 0.90 | P = 0.1477 |
| Synonymous mutations in mutator populations | 838 | 860 | 0.97 | P = 0.4814 |
Note.—The length of the core and flexible (i.e., noncore) portions of the coding sequences in the genome of the LTEE ancestor (E. coli strain REL606) are 1,944,921 and 2,066,263 bp, respectively. Data show the numbers of mutations found in the core and flexible portions in genomes sampled and sequenced at 50,000 generations from six nonmutator populations that retained the ancestral point-mutation rate and six mutator populations that evolved hypermutability. The odds ratio expresses the extent to which the category of mutation is overrepresented (>1) or underrepresented (<1) in the core genome relative to the flexible genome in the indicated populations. The P-value is based on a two-tailed binomial test comparing the observed numbers of mutations to the expectations based on the relative lengths of the core and flexible genomes.
In contrast, the frequency of synonymous mutations does not differ significantly between the core and flexible genes (table 1, row 2), demonstrating that the excess of nonsynonymous mutations in core genes is driven by selection, not by their propensity to mutate (Maddamsetti et al. 2015). Also, the frequencies of both nonsynonymous and synonymous mutations in core versus flexible genes are close to the null expectations in the populations that evolved hypermutability (table 1, rows 3 and 4). We can also express these results in terms of the ratio of nonsynonymous mutations to synonymous mutations, after adjusting for the numbers of sites at risk for each type of mutation (i.e., dN/dS). With ∼3.22 more sites at risk for nonsynonymous than synonymous mutations across the ancestral genome as a whole (Tenaillon et al. 2016), the dN/dS ratio is much higher in core genes than in flexible genes in nonmutator populations (∼3.81 vs. ∼1.58). However, there is little difference in this ratio between core and flexible genes in the hypermutable populations (∼0.84 vs. ∼0.91).
These results show that core genes are evolving faster, on average, than the flexible noncore genome in the LTEE populations that retained the ancestral point-mutation rate. This faster evolution is consistent with some subset of the core genes being under positive selection to change from their ancestral state during the LTEE. We then wanted to know how the rates of evolution of core genes observed in the LTEE compare to the rates of evolution of the same genes over the longer timescale of E. coli evolution. We used the G scores from Tenaillon et al. (2016) as a measure of the rate of evolution of each core gene in the LTEE. The G-score statistic expresses the excess number of independent nonsynonymous mutations in the nonhypermutable lineages relative to the number expected, given the length of that gene’s coding sequence (relative to all coding sequences) and the total number of such mutations. To measure the rate of evolution of each core gene in nature, we used Nei’s diversity metric (Nei and Li 1979); in brief, we calculate the average number of differences per site among all pairs of sequences in the core gene alignments.
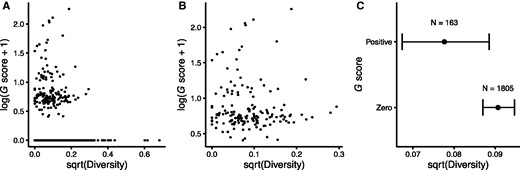
Relationship between positive selection in the LTEE and nonsynonymous sequence diversity of core genes in the E. coli collection of 60 clinical, environmental, and laboratory strains. The G score provides a measure of positive selection based on the excess of nonsynonymous mutations in the LTEE lineages that retained the ancestral point-mutation rate. The log10 and square-root transformations of the G score and sequence diversity, respectively, improve visual dispersion of the data for individual genes, but they do not affect the nonparametric tests performed, which depend only on rank order. (A) G scores and sequence diversity are very weakly negatively correlated across all 1968 core genes (Spearman-rank correlation r = –0.0701, P = 0.0019). (B) The correlation is not significant using only the 163 genes with positive G scores (Spearman-rank correlation r = –0.0476, P = 0.5463). (C) The 163 core genes with positive G scores in the LTEE have significantly lower nonsynonymous sequence diversity in natural isolates than the 1805 genes with zero G scores (Mann–Whitney U = 125,660, P = 0.0020). Error bars show 95% confidence intervals around the median.
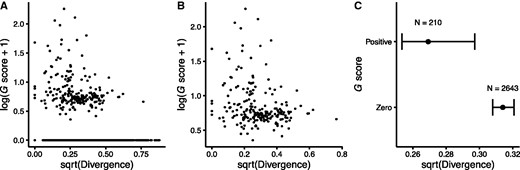
Relationship between positive selection in the LTEE and nonsynonymous sequence divergence of panorthologs between E. coli (strain REL606) and S. enterica. REL606 is the common ancestor of the LTEE populations. See figure 1 for additional details. (A) G scores and divergence are negatively correlated across all 2853 panorthologs (Spearman-rank correlation r = –0.0911, P < 10−5). (B) The correlation remains significant even when using only the 210 panorthologs with positive G scores (Spearman-rank correlation r = –0.2564, P = 0.0002). (C) The 210 panorthologs with positive G scores in the LTEE are significantly less diverged between E. coli and S. enterica in natural isolates than the 2643 panorthologs with zero G scores (Mann–Whitney U = 223,330, P = < 10−5). Error bars show 95% confidence intervals around the median.
In sum, these analyses contradict the hypothesis that those genes that have evolved fastest in the LTEE also evolve and diversify faster than typical genes in nature. Instead, they support the hypothesis that the genes involved in adaptation during the LTEE tend to be more conserved than typical genes in nature, presumably because they are constrained in nature by purifying selection. When the bacteria evolve under the simple and stable ecological conditions of the LTEE, these previously conserved genes evolve in and adapt to their new environment.
Protein Residues that Changed in the LTEE Are Also Conserved in Nature
It is possible that the mutations in the LTEE occurred at highly variable sites in otherwise conserved proteins. To examine this issue, we asked whether the nonsynonymous changes found in the nonmutator LTEE lineages at 50,000 generations tended to occur in fast-evolving codons. For the 96 proteins with such mutations in the LTEE, we calculated the diversity at the mutated sites and in the rest of the protein for the 60 genomes in the E. coli collection. The sites that had changed in the LTEE were significantly less variable than the rest of the protein in that collection (Wilcoxon signed-rank test, P < 10−7). In fact, only 7 of these 96 proteins had any variability at those sites in the E. coli collection, and these seven proteins account for only 9 of the 141 amino-acid mutations in the 96 proteins. We obtained similar results based on the divergence between E. coli and Salmonella. In the 50,000-generation LTEE clones, 144 nonsynonymous mutations occurred in 102 panorthologous genes, and only six of the mutations were at diverged sites. These results show that the particular residues under positive selection in the LTEE are, in fact, ones that tend to be conserved in nature, even over the ∼100 million years since Escherichia and Salmonella diverged (Ochman et al. 1999).
Knockout vs. Fine-Tuning Beneficial Mutations in the LTEE
How did the mutations that fixed in the LTEE drive adaptation to the bacteria’s new environment? In some cases, these beneficial mutations might fine-tune protein function, whereas in other cases (e.g., deletions) they might be beneficial by knocking out the protein function. We examined two lines of evidence for fine-tuning mutations: gene essentiality, because essential genes cannot be knocked out; and parallel evolution at the amino-acid level, because we do not expect strong molecular constraints given that many different mutations can knock out a gene’s function. To address the second issue, we necessarily restricted the analysis to the 57 genes with two or more nonsynonymous changes in nonmutator lineages. We used the same 57 genes to address the first issue for consistency, and because genes with multiple nonsynonymous changes are evidently under positive selection in the LTEE.
Evidence for Fine-Tuning Based on Essentiality
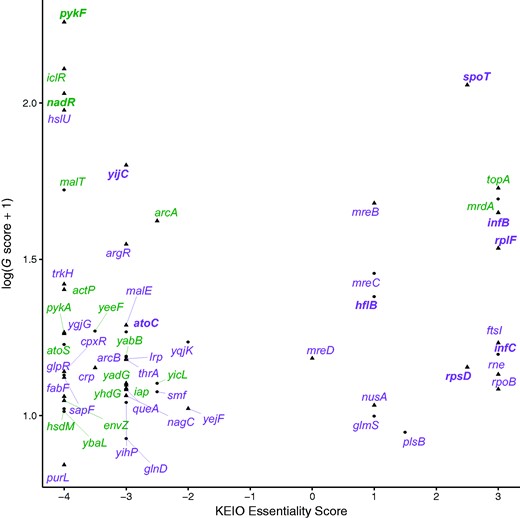
KEIO essentiality score and G score for the 57 genes with 2 or more nonsynonymous changes in nonmutator LTEE genomes. The transformation of the G score improves visual dispersion of the data for clarity. Triangles are core genes (panorthologs) and circles are noncore flexible genes. Genes affected by at least one potential knockout mutation (small indel, IS-element insertion, or large deletion) are labeled in green, and genes without any of these potential knockout mutations in purple. Also, 10 genes that had parallel mutations at the amino-acid level are additionally indicated in bold.
Evidence for Fine-Tuning Based on Parallelism at the Amino-Acid Level
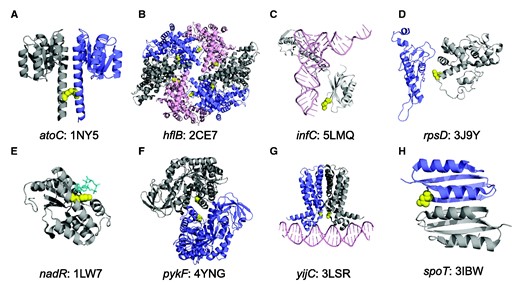
Parallel amino-acid mutations in the LTEE occur at protein interfaces. For clarity, only relevant protein domains are shown. (A) The I129S mutation is on the dimerization interface of the response regulator AtoC, based on the Aquifex aeolicus structure 1NY5. (B) Q506L occurs on a multimerization interface of the metalloprotease FtsH, encoded by hflB, in the Thermotoga maritima structure 2CE7. (C) R132C in ribosomal initiation factor IF3 interacts with the anticodon of the fMet-tRNA in the Thermus thermophilus structure 5LMQ. (D) Mutations at residue 50 in 30S ribosomal protein S4 lie on the interface with protein S5 in the E. coli ribosome structure 3J9Y. (E) Mutations at residue 294 directly contact the coenzyme NAD in the Haemophilus influenzae NadR protein structure 1LW7, while mutations at residues 290 and 298 are adjacent to 294 on the same face of the alpha helix. (F) A301S occurs at the A/A’ multimerization interface of pyruvate kinase, encoded by pykF, in the E. coli structure 4YNG. (G) T30N occurs at the dimerization interface of the DNA-binding domain of the transcriptional repressor FabR in the Pseudomonas aeruginosa structure 3LSR. (H) N653H occurs at the dimerization interface between ACT4 amino-acid binding domains of the bifunctional (p)ppGpp synthase/hydrolase SpoT in the Chlorobium tepidum structure 3IBW.
In atoC, an I129S mutation occurs in both 50,000-generation clones from population Ara+1 and in a 30,000-generation clone from Ara+4; this mutation maps to a dimerization interface (fig. 4A). We found a Q506L mutation in hflB in both 50,000-generation clones from Ara+5 and in a 30,000-generation clone from Ara–5; this mutation maps to a multimerization interface (fig. 4B). In infC, an R132C substitution was fixed on the line of descent in both the Ara+4 and Ara–6 populations (fig. 4C). This mutation interacts with the anticodon of the fMet-tRNA during translation initiation on the ribosome. A D50G mutation in rpsD is on the line of descent (i.e., reached fixation or nearly so) in five populations: Ara–1, Ara–2, Ara–4, Ara+2, and Ara+3. This particular residue of the 30S ribosomal protein S4 has the strongest signal among all S4 residues for interaction with the ribosomal protein S5 in a maximum-entropy model of sequence variation within and between the two proteins (Hopf et al. 2014), and the mutation clearly maps to their interface (fig. 4D). The R132C infC mutation and the D50G rpsD mutation are the only nonsynonymous mutations found in these genes in any of the sequenced LTEE genomes (including even those that evolved hypermutability), providing further evidence that their benefits result from specific fine-tuning effects.
In nadR, pykF, and yijC (fabR), we also found parallel evolution at the amino-acid level across some LTEE populations, but with knockout mutations in other populations. In the case of nadR, Y294C substitutions are on the line of descent in four populations: Ara–5, Ara+2, Ara+4, and Ara+5. This mutation interacts with NAD in a homologous protein structure; mutations at nearby residues 290 and 298 occurred in two other populations, and these residues are on the same face of the alpha helix (because alpha helices have a period of 3.6 residues) that interacts with NAD (fig. 4E). In fact, nonsynonymous mutations in nadR fixed in all but one of the 12 LTEE populations; the exception was population Ara+1, in which an IS150 element inserted into the gene. In the case of pykF, an A301S mutation fixed on the line of descent in three populations: Ara–5, Ara+1, and Ara+5. This residue lies at the A/A’ multimerization interface of the pykF tetramer (fig. 4F), which is implicated in allostery in response to fructose 1,6-biphosphate binding (Donovan et al. 2016). However, pykF knockout mutations are also beneficial in the LTEE environment (Barrick et al. 2009; Khan et al. 2011). A 1-bp deletion fixed in Ara+4, and pykF mutations that cause frameshifts are found off the line of descent in many LTEE populations, including disruption by IS150 transposons. Biochemical analyses indicate that pykF alleles vary in their catalytic and allosteric properties, so that some changes in function might be more beneficial than knockouts of the protein (R. Dobson and T. Cooper, personal communication, January 2017). We also find parallelism at the amino-acid level in yijC (fabR). A T30N mutation is found off the line of descent in a 500-generation clone from Ara–1 clone, a 500-generation clone from Ara–2, and a 1500-generation clone from Ara+1. Other early mutations at this locus were found in populations Ara+1, Ara+5, Ara–3, and Ara–6, including a Q172* nonsense mutation that persisted in Ara–3 for at least 1000 generations. In no case, however, did any mutation in yijC (fabR) become fixed in the LTEE, indicating that positive selection was insufficient to drive them to fixation. Structural analysis shows the T30N mutation is at the dimerization interface of the protein on its DNA-binding domain (fig. 4G). We also examined the F83V mutation in the 50S ribosomal protein L6, which is encoded by rplF, as well as the K717E mutation in translation initiation factor IF-2, encoded by infB. The F83V mutation lies within 8 Å of 23S ribosomal RNA. The K717E mutation does not appear to contact any other molecule.
In contrast to these cases of parallel evolution at the amino-acid level, different nonsynonymous mutations in the spoT gene were fixed in populations Ara–1, Ara–2, Ara–4, Ara–6, Ara+2, Ara+4, and Ara+6. These mutations affect different domains of the SpoT protein (Ostrowski et al. 2008). The complete absence of any putative knockout mutations at this locus across the LTEE (Tenaillon et al. 2016) indicates that mutations in spoT are probably functional, and not knockouts. Further evidence of fine-tuning evolution in spoT is the fact that an N653H mutation evolved twice, being present in an Ara+3 2000-generation clone and an Ara–5 30,000-generation clone, although in neither case did it fix. Structural analysis shows that this mutation lies at the dimerization interface of an ACT4 domain (fig. 4H). In general, ACT domains are involved in allosteric control in response to amino-acid binding (Cross et al. 2013).
Discussion
It has been long known that, in nature, some genes evolve faster than others. In most cases, the more slowly evolving genes are core genes—ones possessed by most or all members of a species or higher taxon—and their sequence conservation reflects constraints that limit the potential for the encoded proteins to change while retaining their functionality. As a consequence, the ratio of nonsynonymous to synonymous mutations also tends to be low in these core genes. In contrast, we found that nonsynonymous mutations in nonmutator lineages of the LTEE occurred disproportionately in the core genes shared by all E. coli (table 1). Moreover, even among the core genes, those that experienced positive selection to change in the LTEE are both less diverse over the E. coli species (fig. 1) and less diverged between E. coli and S. enterica (fig. 2) than other core genes. Also, the specific sites where mutations arose in the LTEE are usually more conserved than the rest of the corresponding protein, thus excluding the possibility that mutations occurred at a subset of fast-evolving sites in otherwise slow-evolving genes.
In fact, many of the core genes under selection in the LTEE perform vital functions or regulate key aspects of cell physiology (table 2). In comparison to their E. coli B ancestor, the evolved bacteria have a shorter lag phase when transferred into fresh medium, a higher maximum growth rate, improved glucose transport, larger cell size, and altered cell shape (Lenski et al. 1998). Glucose transport is probably improved, in part, by mutations in genes encoding the pyruvate kinases that catalyze the phosphorylation of phosphoenolpyruvate (PEP) to pyruvate. By inhibiting the forward reaction, or perhaps promoting the reverse reaction, mutations affecting the kinases would increase the concentration of PEP, which drives the phosphotransferase system that brings glucose into the cell (Woods et al. 2006). Global regulatory networks also have evolved in the LTEE (Cooper et al. 2003; Philippe et al. 2007). DNA superhelicity, which links chromosome structure to gene regulation, has been under strong selection in the LTEE (Crozat et al. 2005, 2010), as has the CRP regulon that coordinates metabolism with cellular protein production (You et al. 2013) and the ppGpp regulon that regulates ribosome synthesis in response to levels of available amino acids in the cell (Scott et al. 2010, 2014).
Genes and Their Associated Phenotypes that Show Evidence of Positive Selection in the LTEE
| Process | Genes | Phenotype | References |
|---|---|---|---|
| Cell size and shape | ftsI, fabF, mrdA, mreB, mreC, mreD, yabB, fabR | Larger size, elongated shape | Lenski et al. (1998),UniProt Consortium (2015) |
| Glucose transport | pykA, pykF | Increased uptake | Woods et al. (2006) |
| Maltose transport | malT | Loss | Pelosi et al. (2006),Meyer et al. (2010),Leiby and Marx (2014) |
| Transcription | rpoB | Unknown | UniProt Consortium (2015) |
| Translation | rplF, rpsD, infB, infC | Translational speed and accuracy; possible compensation for cost of strepomycin resistance in ancestor | Schrag et al. (1997),Andersson and Hughes (2010),UniProt Consortium (2015) |
| Acetate metabolism and glyoxylate shunt | actP, arcA, arcB, atoS, atoC, iclR | Acetate assimilation | Plucain et al. (2014),Quandt et al. (2014, 2015),Basan et al. (2015) |
| DNA supercoiling | topA, fis, dusB | Changes in global transcriptional regulation | Crozat et al. (2005, 2010) |
| CRP regulon | crp | Regulation of catabolism | Cooper et al. (2003),Basan et al. (2015) |
| ppGpp regulon | spoT | Regulation of ribosome synthesis | Cooper et al. (2003),Scott et al. (2010, 2014) |
| Osmolarity regulation | fis, envZ, lrp | Unknown | Crozat et al. (2011),UniProt Consortium (2015) |
Note.—See also Tenaillon et al. (2016) for evidence of gene-level parallelism.
Some other mutations may ameliorate the fitness cost associated with a mutation in rpsL that confers resistance to strepomycin in the ancestral strain REL606, which was selected prior to the LTEE (Studier et al. 2009). The LTEE populations have maintained this resistance despite 50,000 generations of relaxed selection, probably owing to the fixation of compensatory mutations in ribosomal protein-encoding genes such as rpsD (Schrag et al. 1997; Andersson and Hughes 2010). Researchers have long known that mutations at the interface of ribosomal proteins S4 and S5 can compensate for streptomycin resistance, and that such mutations can affect translational speed and accuracy (Agarwal et al. 2015). That context, in addition to our new finding that the R132C mutation in infC interacts with fMet-tRNA during translation initiation, provides evidence for positive selection on translational speed, accuracy, or both in the LTEE.
It is clear, then, that the specific conditions of the LTEE have sometimes favored new alleles in core genes that are usually highly conserved in nature. From one perspective, this result is surprising: the LTEE’s 37 °C temperature is typical for humans and many other mammalian bodies where E. coli lives; the limiting resource is glucose, which is E. coli’s preferred energy source, such that it will repress the expression of genes used to catabolize other resources when glucose is available; and the LTEE does not impose other stressors such as pH, antibiotics, and so on. However, the very simplicity and constancy of the LTEE are presumably novel, or at least atypical, in the long history of E. coli evolution. In other words, that uniformity and simplicity—including the absence of competitors and parasites as well as host-dependent factors—stand in stark contrast to the variable and complex communities that are E. coli’s natural habitat (Blount 2015). Of course, evolutionary outcomes depend on the precise environment and the constraints it imposes. For example, compensatory mutations in rpsD and rpsE readily evolved when streptomycin-resistant Salmonella populations were passaged in broth, but not when they were passaged in mice (Björkman et al. 2000).
Given the importance and even essentiality of many core genes, it seems unlikely that all of the beneficial nonsynonymous mutations in the LTEE cause complete losses of function. Indeed, some of these beneficial mutations appear to fine-tune the regulation and expression of functions that contribute to the bacteria’s competitiveness and growth in the simple and predictable environment of the LTEE (table 2, fig. 4). As further evidence, the functional effects and fitness consequences of some of the evolved alleles depend on earlier mutations in other genes. Thus, different alleles at the same locus that evolved in different lineages may have different effects, and particular combinations of alleles are sometimes necessary to confer a selective advantage. Such epistasis between evolved alleles has been demonstrated in several LTEE populations and involves various genes including spoT and topA in population Ara–1 (Woods et al. 2011); arcA, gntR, and spoT in Ara–2 (Plucain et al. 2014); and citT, dctA, and gltA in Ara–3 (Quandt et al. 2014, 2015). In the case of Ara–3, these epistatic interactions were important for that population’s new ability to grow on citrate in the presence of oxygen (Blount et al. 2008, 2012).
In contrast, some other genes that were repeatedly mutated in the LTEE—not by point mutations, but instead by deletions and transposable-element insertions—typically encode noncore, nonessential functions including prophage remnants, plasmid-derived toxin-antitoxin modules, and production of surface structures that are probably important for host colonization (Tenaillon et al. 2016). Specific examples of both types of change have been shown to be adaptive in the LTEE environment—point mutations by affecting a gene’s function and the expression of interacting genes (Cooper et al. 2003; Philippe et al. 2007), and indels by eliminating unused and potentially costly functions (Cooper et al. 2001). We do not know the proportion of fine-tuning versus loss-of-function mutations in the LTEE, nor do we know how that proportion could be determined except by in-depth analyses of all the mutations and their biochemical effects. Therefore, we do not claim that the majority of beneficial mutations in the LTEE fine-tune protein function. However, we have presented compelling evidence that some of the beneficial mutations do have fine-tuning effects, and so we reject the extreme hypothesis that loss-of-function mutations alone account for all of the adaptation that has occurred in the LTEE.
Of course, other evolution experiments may well produce different types of genomic changes, including in some cases perhaps a preponderance of point mutations in noncore genes. For example, if the experimental environment involves lethal agents such as phages or antibiotics, then perhaps only a few noncore genes might be the targets of selection, and the resulting mutations might even interfere with adaptation to other aspects of the environment (Scanlan et al. 2015). Similarly, adaptation to use novel resources—such as the ability to use the citrate that has been present throughout the LTEE, but which only one population has discovered how to exploit (Blount et al. 2008, 2012)—may produce a different genetic signature. Yet other signatures might emerge if horizontal gene transfer from other strains or species provided a source of variation (Souza et al. 1997). Imagine, for example, a scenario in which gene flow allowed E. coli to obtain DNA from a diverse natural community; in that case, a transporter acquired from another species might well provide an easier pathway to use the citrate in the LTEE environment.
We can turn the question around from asking why core genes evolve so quickly in the LTEE, to why they usually evolve slowly in nature. Core genes encode functions that, by definition, are widely shared, and so their sequences have had substantial time to diverge and become fine-tuned to different niches (Biller et al. 2015). As a consequence, there are fewer opportunities for new alleles of core genes to provide an advantage. Moreover, given the diversity of species (including transients) in most natural communities, extant species usually fill any vacant niches that might appear as a result of environmental changes faster than de novo evolution. Nonetheless, mutations in conserved core genes might sometimes provide the best available paths for adaptation to new conditions, such as when formerly free-living or commensal bacteria become pathogens (Lieberman et al. 2011). In such cases, finding parallel or convergent changes offers a way to identify adaptive mutations when they occur in core genes. For example, E. coli and S. enterica have been found to undergo convergent changes at the amino-acid level in core genes when strains evolve pathogenic lifestyles (Chattopadhyay et al. 2009, 2012).
Finally, what does our work have to say about the relevance of experimental evolution for understanding evolution in natural populations? Researchers usually design evolution experiments to address general questions, often with a theoretical or conceptual focus, such as the roles of adaptation, chance, and history in evolution (Travisano et al. 1995). The LTEE was certainly not designed to model any natural population or community, and so it can neither substitute for time series of genomic changes in natural populations and communities, nor for studies of genetic variation within and between species. Evolution experiments may sometimes recapitulate evolution in nature, but that probably occurs only when selection in the experiment is similar to selection in nature (Wichman et al. 2000). That said, comparing the dynamics and outcomes of evolution in the laboratory to evolution in nature can be fruitful for understanding the evolutionary process (Gómez and Buckling 2011; Bailey and Bataillon 2016).
In summary, the genetic signatures of adaptation vary depending on circumstances including the novelty of the environment from the perspective of the evolving population, the complexity of the biological community in which the population exists, the intensity of selection, and the number and types of genes that can produce useful phenotypes. In the LTEE, nonsynonymous mutations in core genes that encode conserved and even essential functions for E. coli have provided an important source of the fitness gains in the evolving populations over many thousands of generations (Wiser et al. 2013; Lenski et al. 2015).
Supplementary Material
Supplementary data are available at Genome Biology and Evolution online.
Acknowledgments
We thank Alita Burmeister, Michael Wiser, and Kyle Card for comments on earlier versions of our manuscript; Jeff Barrick and Daniel Deatherage for making the LTEE genomics data accessible; and Thomas Hopf for assistance with computational analyses. This work was supported, in part, by a National Defense Science and Engineering Graduate Fellowship to RM, a grant from the National Science Foundation (DEB-1451740) to REL, the BEACON Center for the Study of Evolution in Action (NSF Cooperative Agreement DBI-0939454), and grants from NIGMS (R01GM106303) and the Raymond and Beverly Sackler Foundation to DSM.
Literature Cited
Author notes
Associate editor: George Zhang
Present address: Department of Systems Biology, Harvard Medical School, Boston, MA
Data deposition: This project has been deposited at www.datadryad.org under the accession DOI: http://dx.doi.org/10.5061/dryad.2875k.2.
