


Abstract
Recent studies have found evidence of introgression from Neanderthals into modern humans outside of sub-Saharan Africa. Given the geographic range of Neanderthals, the findings have been interpreted as evidence of gene exchange between Neanderthals and modern humans descended from the Out-of-Africa (OOA) migration. Here, we examine an alternative interpretation in which the introgression occurred earlier within Africa, between ancestors or relatives of Neanderthals and a subset of African modern humans who were the ancestors of those involved in the OOA migration. Under the alternative model, if the population structure among present-day Africans predates the OOA migration, we might find some African populations show a signal of Neanderthal introgression whereas others do not. To test this alternative model, we compiled a whole-genome data set including 38 sub-Saharan Africans from eight populations and 25 non-African individuals from five populations. We assessed differences in the amount of Neanderthal-like single-nucleotide polymorphism alleles among these populations and observed up to 1.5% difference in the number of Neanderthal-like alleles among African populations. Further analyses suggest that these differences are likely due to recent non-African admixture in these populations. After accounting for recent non-African admixture, our results do not support the alternative model of older (e.g., >100 kya) admixture between modern humans and Neanderthal-like hominids within Africa.
Introduction
The report of the Neanderthal genome sequence included the fascinating conclusion of a small amount of Neanderthal admixture in anatomically modern humans (AMH) (Green et al. 2010). Consistent with the fossil and archaeological records that show Neanderthals and AMH lived about the same time in parts of Europe and Asia, the signal of introgression was observed in genomes from non-African and North African populations (Green et al. 2010; Sanchez-Quinto et al. 2012) but was not apparent in sub-Saharan African populations (Hammer et al. 2011; Lachance et al. 2012; Wall et al. 2013). Given the signal of introgression occurs in diverse populations outside of sub-Saharan Africa, it may have been caused by gene exchange soon after the Out-of-Africa (OOA) migration of modern humans, perhaps in the Middle East region (Green et al. 2010; Stewart and Stringer 2012) in the range of 47–65 thousand year ago (kya) during the Late Pleistocene period (Tishkoff et al. 2007; Sankararaman et al. 2012). This model of relatively recent introgression outside of Africa is depicted in figure 1A (model i).
![(A) Two models of Neanderthal gene flow into AMH. Model i: A single episode of admixture occurred between AMH and Neanderthal after OOA but before AMH subsequently spread throughout Eurasia. Model ii: Neanderthal admixture happened before OOA. A subset of ancient AMH African populations who were admixed with Neanderthal subsequently moved out of Africa. The red arrows represent introgression of Neanderthals with modern humans. Time period is not on scale. Figure modified from Campbell and Tishkoff (2010). (B) Eight sub-Saharan African populations sampled in this study. The populations are marked in black filled squares, along with their names and sample locations. ASW individuals have recent West African ancestry (denoted with a circle, as this ancestry does not trace back to a single location [Bryc et al. 2010]).](https://oup.silverchair-cdn.com/oup/backfile/Content_public/Journal/gbe/5/11/10.1093_gbe_evt160/4/m_evt160f1p.jpeg?Expires=1716454413&Signature=FWco-dexdrPzt7RV1Y2wIjIbBNh6EX6wGv5DtjO~o0dY470wTRxb1S~JixPbt~yWQsnZdE8wSkhRA9GLCfucfg4xw4y8fwVNOyCcCH7uaBxRjrC2qBfL8EryN-WUrtSLYG4R7vANYoO2BO7euWTx4CY6BKwmol6YEwnzwk3tCGcMzSrFy3QsR1WEFtayGTgO67Qn3PKihj~DtojIgT~gH3Y6N9KOLW3GfAyh-4rSQhLrXXXhPx1njBsDpsI6nqNdTA8lSGyLTUU6anDW4z72EE7whhjss4R3tebk49zP8kQZp80CRxw-EMc4Uaab1b8B8xNCwoBIsJVnxofcbaX3Xg__&Key-Pair-Id=APKAIE5G5CRDK6RD3PGA)
(A) Two models of Neanderthal gene flow into AMH. Model i: A single episode of admixture occurred between AMH and Neanderthal after OOA but before AMH subsequently spread throughout Eurasia. Model ii: Neanderthal admixture happened before OOA. A subset of ancient AMH African populations who were admixed with Neanderthal subsequently moved out of Africa. The red arrows represent introgression of Neanderthals with modern humans. Time period is not on scale. Figure modified from Campbell and Tishkoff (2010). (B) Eight sub-Saharan African populations sampled in this study. The populations are marked in black filled squares, along with their names and sample locations. ASW individuals have recent West African ancestry (denoted with a circle, as this ancestry does not trace back to a single location [Bryc et al. 2010]).
An alternative explanation to the observation involves an older time of introgression and would place the location of populations exchanging genes to somewhere within Africa. As several authors pointed out, Neanderthal introgression could be the result of more ancient gene exchange between the ancestors or close relatives of Neanderthals living in Africa and an early modern human population that later gave rise to the OOA migration (Durand et al. 2011; Eriksson and Manica 2012; Yang et al. 2012). This model of ancient AMH substructure and within-Africa Neanderthal-like gene flow is depicted as model ii in figure 1A. Model ii requires that a substantial level of population structure existed among modern humans in Africa at the time of the Neanderthal-like introgression, and the population structure persisted until the OOA migration. It is known that present-day African populations show signals of population structure that predates the OOA (Tishkoff et al. 2007; Campbell and Tishkoff 2010; Gronau et al. 2011). Therefore, it is plausible that prior to the OOA migration, modern human populations in Africa varied in the number of alleles they carried due to Neanderthal-like introgression, and that a population that carried a higher amount of this variation gave rise to the OOA migration. This explanation predicts variable amounts of Neanderthal-like introgression among African populations. Another prediction of model ii is that the initial Eurasian populations derived from the OOA migration carried similar amounts of Neanderthal-like alleles. This prediction seemingly contradicts the observation that modern East Asians share more alleles with Neanderthal than modern Europeans. Nevertheless, several factors, including ascertainment bias, genetic drift, and admixture with other archaic human forms, could contribute to the observed difference (Keinan et al. 2007; Skoglund and Jakobsson 2011). In some situations, a combination of ascertainment bias and genetic drift could generate artificial differences between populations that had the same admixture history (Skoglund and Jakobsson 2011). Therefore, here we will focus on examining the prediction that the Neanderthal introgression signal varies among African populations. Previous studies of Neanderthal admixture only sampled individuals from a few sub-Saharan African populations (Green et al. 2010; Durand et al. 2011; Lachance et al. 2012; Sanchez-Quinto et al. 2012; Yang et al. 2012; Wall et al. 2013), leaving open the possibility that a more extensive sampling among sub-Saharan African populations could identify variation in the Neanderthal introgression signal. In this study, we collected data from eight sub-Saharan African populations that cover a wide range of geographically and ethnically separated populations and determined the amount of Neanderthal-like admixture in these populations.
Sample Description
Our whole-genome single-nucleotide polymorphism (SNP) data set contains a total of 63 individuals, including 38 individuals who belong to eight sub-Saharan populations (fig. 1B and table 1) and 25 individuals who belong to five non-Africans populations (table 1). Four out of the eight sub-Saharan African populations have a hunter-gatherer life style (San, Hadza, Sandawe, and Pygmy). The other four populations include Yoruba in Ibadan Nigeria (YRI), Luhya in Webuye Kenya (LWK), Maasai in Kinyawa Kenya (MKK), and African Americans with African ancestry in the Southwest USA (ASW). The overall data set contains genotypes of 4.6 million (M) high-quality nongenic SNPs in 63 modern humans (see Materials and Methods for SNP selection detail). This data set was then combined with the Neanderthal genome from Green et al. (2010) to obtain loci where the Neanderthal sequence is available. A final data set of ∼2.9 M SNPs was used in subsequent introgression and ancestry analysis.
Populations Examined in This Study
| Population | Individual | Source | |
|---|---|---|---|
| Sub-Saharan African (total 38) | San | 1 | Schuster et al. (2010) |
| Pygmy | 5 | Lachance et al. (2012) | |
| Sandawe | 5 | ||
| Hadza | 5 | ||
| YRI | 9 | Drmanac et al. (2010) | |
| LWK | 4 | ||
| ASW | 5 | ||
| MKK | 4 | ||
| Non-African (total 25) | CHB | 4 | |
| JPT | 4 | ||
| TSI | 4 | ||
| GIH | 4 | ||
| CEU | 9 | ||
| Total | 63 | ||
Non-African Genomes Share More Derived Alleles with Neanderthal Genomes Than Sub-Saharan African Genomes
We first estimated whether the Neanderthal genome shared more bases with the sub-Saharan African genomes or with the non-African genomes. This is achieved by calculating the pairwise D statistic, sometimes called the ABBA/BABA statistic, that was first introduced by Green et al. (2010) as a formal test for Neanderthal ancestry in modern human (see Materials and Methods). The theory and application of the D statistic was extended for SNP data in which the values were computed using either population or sample allele frequencies (Durand et al. 2011; Patterson et al. 2012), and the D statistic always considers a group of four populations. The pairwise D statistics are calculated by assigning H1 to be one of the eight sub-Saharan African populations and H2 to be one of the five non-African populations, as compared with Neanderthals. If H1 and H2 share the same amount of Neanderthal genomes, the D value is expected to be zero (Green et al. 2010; Durand et al. 2011; Patterson et al. 2012). A negative D statistic implies that H2 is genetically closer to Neanderthals than H1, whereas a positive D statistic implies H1 is closer. The D statistics of the pairwise comparison between the sub-Saharan African population (H1) and the non-African population (H2) is summarized in figure 2A. A Bonferroni-corrected P value for 40 hypothesis tests is 0.0013 (0.05/40), corresponding to a standard normal Z score of ∼3 standard deviation (SD). All comparisons of sub-Saharan Africans (H1) and non-Africans (H2) give significant negative D statistics (D from −4.7% to −6.6%, |Z| ≫ 3 SD, for details see supplementary table S1, Supplementary Material online), indicating that Neanderthal genomes are closer to non-Africans than to sub-Saharan Africans, consistent with results from Green et al. (2010).
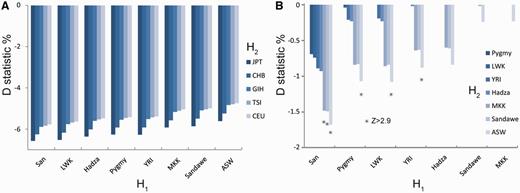
Neanderthal admixture with modern human populations. (A) D statistic for pairwise comparisons of non-Africans with sub-Saharan Africans. Each bar represents a D statistic which is calculated for an H1 (sub-Saharan African) population and an H2 (non-African) population. All D statistic values are significant. (B) D statistics among sub-Saharan African populations. Asterisks indicate significance (|Z| > 2.9 SD corrected for 28 hypotheses).
Sub-Saharan African Genomes Vary in Their Similarity to Neanderthal Genomes
Under model ii of ancient AMH substructure and within-Africa Neanderthal-like gene flow, the Neanderthal similarity could vary among sub-Saharan Africans (fig. 1A, model ii). Therefore, we compared the relative similarities of the genomes from eight sub-Saharan African populations to the Neanderthal genome (see Materials and Methods). As shown in figure 2B, although none of the D values approached the range found between African and non-African genomes, we did observe statistically significant D values for several sub-Saharan African pairs (|Z| > 2.9 SD, corrected for 28 hypothesis tests at P = 0.05). For the test of D(San, H2; Neanderthal, Chimpanzee), where H1 is San and H2 is any other sub-Saharan African populations (fig. 2B), the D statistics are always negative (D from −0.69% to −1.68%), suggesting that Neanderthal genome shares more alleles with these populations than with San (for details see supplementary table S2, Supplementary Material online). Specifically, the comparison of San with Sandawe, MKK, and ASW gives statistically significant D (|Z| > 2.9 SD, for details see supplementary table S2, Supplementary Material online, significant Z scores were highlighted in red). These observations are consistent with the results between pairs of African and non-African populations, where the D values were the lowest for comparisons involving Sandawe, MKK, and ASW (fig. 2A). Taken together, these results suggest that Sandawe, MKK, and ASW share higher number of Neanderthal alleles than other African populations. In addition to the comparisons between San and Sandawe, MKK, or ASW, ASW is more similar to Neanderthal (|Z| > 2.9 SD) in comparisons with Pygmy, LWK, and YRI (fig. 2B). The variation in D statistics among sub-Saharan African comparisons is consistent with the model ii of ancient AMH substructure and within-Africa Neanderthal-like gene flow, as well as some recent findings (Hammer et al. 2011; Wall et al. 2013).
The Variation in Similarity to Neanderthal among African Populations is Correlated with Variation in Recent Gene Flow from Non-African Populations
The differences in D statistics among sub-Saharan African comparisons are considerably lower than those found in comparisons involving pairs of sub-Saharan African and non-African genomes. Three scenarios could explain this difference. First, if model ii is true, a lower D value between African populations is expected if there has been gene exchange among African populations since the time of introgression from Neanderthal-like genomes and if this African gene exchange did not affect the population that gave rise to the OOA migration. This would leave the non-African populations showing higher contrasts with African populations (i.e., more extreme D values) and modest D values among some pairs of African populations. Second, if the model ii is true, then a low value of D between sub-Saharan African populations may be expected because the timing of Neanderthal-like introgression would have been longer ago, when the Neanderthal ancestors were more closely related to the sub-Saharan AMH populations present at that time. However, this explanation would not explain why Green et al. (2010) observed larger values of D between non-African and sub-Saharan African populations. Third and finally, the model ii may be false, and the cause of low but varying D values between African populations is the result of varying amounts of recent introgression into sub-Saharan African populations from non-African populations. Under this view, the original model of Neanderthal introgression into non-African genomes (fig. 1A, model i) is correct, and varying amounts of recent introgression into Africa would have introduced these Neanderthal alleles into some African populations more than others.
To examine this last scenario, we determined the relationship between the D statistics and the mixed ancestry of sub-Saharan Africans. We used the program ADMIXTURE to determine genetic ancestry of all 63 individuals in this study. ADMIXTURE assumes that each individual is drawn from an admixed population with contributions from a set number of ancestral populations (Alexander et al. 2009). Because we are estimating the amount of European or Asian ancestry in sub-Saharan individuals, the program was run with k = 3 populations, corresponding to the three major continents, Africa, Europe, and Asia, where individuals in our data set were collected. On average, ASW, Sandawe, and MKK individuals show more than 16% non-African ancestry in the analysis (fig. 3). Overall, the estimated amount of non-African admixture in African populations is highly correlated with their D statistics (r = 0.93, P = 0.002, table 2). This high correlation supports the explanation that recent admixture with non-Africans had introduced Neanderthal alleles into some African populations more than others. It should be noted that although ADMIXTURE predicts the contribution of three putative ancestral populations in each individual genome, the contribution could be indirect. For example, as noted in Tishkoff et al. (2009), MKK and Sandawe might not have large amounts of Eurasian ancestry. They have large amounts of Cushitic ancestry which originated in Ethiopia, and those populations are more genetically similar to the non-Africans and may have experienced gene flow (Tishkoff et al. 2009). So the non-African ancestry predicted in these populations could be through indirect contribution from their ancestral populations.
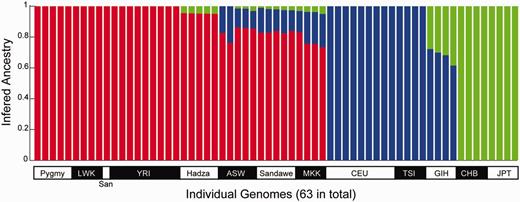
Individual ancestry inferred by the ADMIXTURE program. Results from k = 3 are shown. Each individual’s genome is represented by a vertical bar composed of colored sections, where each section represents the proportion of an individual’s ancestry derived from one of the three ancestral populations. Individuals are arrayed horizontally and grouped by population as indicated.
Correlation between the D Statistic and the Estimated Non-African Ancestry in Sub-Saharan Africans
| Pygmy | LWK | YRI | Hadza | MKK | Sandawe | ASW | |
|---|---|---|---|---|---|---|---|
| D(San, H2; N, C) (%) | 0.69 | 0.74 | 0.89 | 0.93 | 1.48 | 1.49 | 1.68 |
| Non-African Ancestry (%) | 0.0 | 0.0 | 0.0 | 4.69 | 23.12 | 16.85 | 16.79 |
| Pearson correlation | 0.93 (P = 0.002) | ||||||
| Pygmy | LWK | YRI | Hadza | MKK | Sandawe | ASW | |
|---|---|---|---|---|---|---|---|
| D(San, H2; N, C) (%) | 0.69 | 0.74 | 0.89 | 0.93 | 1.48 | 1.49 | 1.68 |
| Non-African Ancestry (%) | 0.0 | 0.0 | 0.0 | 4.69 | 23.12 | 16.85 | 16.79 |
| Pearson correlation | 0.93 (P = 0.002) | ||||||
Conclusion and Future Direction
In summary, although we observed varying D values in an extensive comparison among sub-Saharan African genomes, our results are consistent overall with the original report of Neanderthal admixture into non-African modern humans (Green et al. 2010) and several recent studies (Sankararaman et al. 2012; Yang et al. 2012). Our data do not provide support for the alternative model (model ii) of Neanderthal-like admixture with some African populations prior to the OOA migration (Eriksson and Manica 2012).
It is worth noting that our test does not have a lot of power to address the related and more general question of how modern humans evolved from archaic humans in Africa and about the role of population structure in that process. In this light it is useful to recall that for neutral variants, the expected age of a variant is correlated with the effective population size and the allele frequency (Kimura and Ohta 1973). Assuming an effective population size of 10,000 and a generation time of 20 years, the average age of a SNP with an allele frequency of 20% is approximately 322 thousand years, far older than the origin of modern humans. Therefore, we all harbor a large amount of variation that arose before the origin of modern humans, and a substantial fraction of this arose before the origin of Neanderthals. The comparison of modern human and Neanderthal genomes offers an exceptional but limited glimpse into the history of modern human population structure. With the advancement in technology and analytical methods in the genomic field, we will soon have more data (e.g., sequence data from more, older archaic hominid) and better methods to understand the role of population structure in human evolution.
Materials and Methods
Data Collection
Whole-genome SNP data of 63 unrelated modern human individuals was collected from three sources: one San individual sequenced using the Illumina Genome Analyzer (Schuster et al. 2010) (>12.3× coverage) and 62 individuals sequenced by Complete Genomics (>50× coverage). Within the 62 individuals sequenced by Complete Genomics, 47 unrelated individuals were from the Complete Genomics panel (ftp://ftp2.completegenomics.com/, last accessed October 31, 2013) (Drmanac et al. 2010), and 15 sub-Saharan African hunter-gathers from Lachance et al. (2012). Altogether the data set includes 38 sub-Saharan African individuals from eight populations and 25 non-African individuals from five populations.
To obtain a set of high-quality noncoding SNPs, the combined data sets were filtered using a series of filters as described in Gronau et al. (2011). Specifically, SNPs that are within recombination hotspots, repetitive regions, segmental duplication regions, simple repeat regions, and CpG sites were excluded. In addition, SNPs near genic regions (within 10,000 bp of HG19 RefSeq regions) or showed no synteny with the Chimpanzee genome (PanTro2) were also excluded from the data set. The final data set contains ∼4.5 M high-quality SNPs that are in the unique, noncoding portions of the genome.
The sequence contigs of the Neanderthal genome and their alignment to the human reference genome hg18 (all-hg18.bam and all-hg18.bam.bai) was downloaded from http://genome.ucsc.edu/Neandertal (last accessed November 6, 2013). Because the modern human genomes were aligned to the human reference genome hg19, the hg18 coordinates of the Neanderthal contigs were converted to hg19 using the liftOver tool (http://hgdownload.cse.ucsc.edu/admin/exe/linux.x86_64/liftOver, last accessed October 31, 2013). Because the Neanderthal genome only has ∼1.3× coverage on average and is not suitable for accurate genotype inference, all SNPs were considered as homozygous for subsequent analysis. The Neanderthal genome was then combined with the 63 modern human genomes at overlapping loci and yielded a data set of ∼2.9 M autosomal SNPs.
From the combined data set, we selected SNPs that are informative for accessing Neanderthal admixture. Assuming the chimpanzee genome has the ancestral allele, we selected SNPs for which 1) the Neanderthal genome has the derived allele (i.e., different from chimpanzee) and 2) the Neanderthal allele is either the reference or the alternative allele in the human data set. Using these criteria, we selected a total of 282,032 informative SNPs for the D statistical analysis.
Data Analysis
The D statistic (Green et al. 2010; Durand et al. 2011) was used to access the differences in similarity to Neanderthals for a pair of modern human populations. Pairwise D statistics were calculated between eight sub-Saharan African populations and five non-African populations (40 pairs) or among the eight sub-Saharan Africans (28 pairs). The D statistic D(H1, H2; N, C) always considers a group of four populations: two modern human populations such as Africans or non-Africans (marked as H1 and H2), the Neanderthal (marked as N), and common chimpanzee as an outgroup (marked as C). A negative D statistic implies that H2 is closer to Neanderthal, whereas a positive D statistic implies H1 is closer to Neanderthal. For each pair of population, the sign of the D value could be positive or negative, depending on the order of the two populations. For simplicity, only the negative D values (i.e., H2 is more similar to Neanderthal) are shown in supplementary tables S1 and Supplementary Data, Supplementary Material online. The D statistic was calculated using the program qpDstat as part of the software package ADMIXTOOLS 1.0 (Patterson et al. 2012).
To examine the extent of mixed ancestry, we used a model-based algorithm to determine genetic ancestry of each individual in a given number of ancestral populations without population designation as implemented in ADMIXTURE (ver. 1.22) (Alexander et al. 2009). We tested our data with k = 2, 3, 4 ancestral populations using default settings. ADMIXTURE uses SNPs that are not affected by linkage disequilibrium (LD). To remove SNPs that are in LD, the data set was pruned using PLINK (Purcell et al. 2007) with the cutline value r2 = 0.2 in 50 SNPs sliding window with 5 SNPs overlapping. The pruned SNP data set contains ∼1.1 M SNPs.
Acknowledgments
This work was supported by the National Institutes of Health (R00 HG005846 to J.X.; DP1 ES022577 to S.A.T.; and F32 HG006648 to J.L.). The authors thank the two anonymous reviewers for their constructive and valuable comments.
Literature Cited
Author notes
Associate editor: Richard Cordaux
