


ABSTRACT
The giant squid (Architeuthis dux; Steenstrup, 1857) is an enigmatic giant mollusc with a circumglobal distribution in the deep ocean, except in the high Arctic and Antarctic waters. The elusiveness of the species makes it difficult to study. Thus, having a genome assembled for this deep-sea–dwelling species will allow several pending evolutionary questions to be unlocked.
We present a draft genome assembly that includes 200 Gb of Illumina reads, 4 Gb of Moleculo synthetic long reads, and 108 Gb of Chicago libraries, with a final size matching the estimated genome size of 2.7 Gb, and a scaffold N50 of 4.8 Mb. We also present an alternative assembly including 27 Gb raw reads generated using the Pacific Biosciences platform. In addition, we sequenced the proteome of the same individual and RNA from 3 different tissue types from 3 other species of squid (Onychoteuthis banksii, Dosidicus gigas, and Sthenoteuthis oualaniensis) to assist genome annotation. We annotated 33,406 protein-coding genes supported by evidence, and the genome completeness estimated by BUSCO reached 92%. Repetitive regions cover 49.17% of the genome.
This annotated draft genome of A. dux provides a critical resource to investigate the unique traits of this species, including its gigantism and key adaptations to deep-sea environments.
Context
Cephalopods are the most behaviourally complex of the invertebrate protostomes [1]. Their large, highly differentiated brains are comparable in relative size and complexity to those of vertebrates [2], as are their cognitive capabilities [1]. Cephalopods are distributed worldwide from tropical to polar marine habitats, from benthic to pelagic zones, and from intertidal areas down to the abyssal parts of the deep sea, with the only exception being the Black Sea. Cephalopod populations are thought to be currently increasing in some regions for a variety of reasons [3], including potential predator release as a consequence of the depletion of fish stocks [4]. The class Cephalopoda contains ∼800 species, with the vast majority belonging to the soft-bodied subclass Coleoidea (cuttlefishes, octopuses, and squids), and a small handful belonging to the Nautiloidea (nautiluses) [5]. Cephalopods are ecologically important as a primary food source for marine mammals, birds, and for many fish species. They are also increasingly important as a high-protein food source for humans and are a growing target for commercial fisheries and farming [6].
Cephalopods show a wide variety of morphologies, lifestyles, and behaviours [7], but with the exception of the nautiluses they are characterized by rapid growth and short lifespans, despite a considerable investment in costly sensory adaptations [2]. They range in size from the tiny pygmy squids (∼2 cm) to animals that are nearly 3 orders of magnitude larger, such as the giant squid, A. dux (average length 10–12 m, and reported up to 20 m total length) [6, 8, 9], to the colossal squid, Mesonychoteuthis hamiltoni (maximum length remains unclear, but a recorded weight of 500 kg makes it the largest known invertebrate [10]). Cephalopods can rapidly alter the texture, pattern, colour, and brightness of their skin, and this both enables a complex communication system, as well as provides exceptional camouflage and mimicry [11]. Together these allow cephalopods to both avoid predators, and hunt prey highly efficiently, making them some of the top predators in the ocean. The remarkable adaptations of cephalopods also extend to their genome, with recent work demonstrating increased levels of RNA editing to diversify proteins involved in neural functions [12].
Over recent years, oceanic warming and acidification, pollution, expanding hypoxia, and fishing [13–15] have been shown to affect cephalopod populations. Mercury has been found in high concentrations in the tissue of giant squid specimens [16], and accumulation of flame retardant chemicals has also been detected in the tissue of deep-sea cephalopods [17]. Consequently, there is an urgent need for greater biological understanding of these important, but rarely encountered animals, in order to aid conservation efforts and ensure their continued existence. A genome is an important resource for future population genomics studies aiming at characterizing the diversity of the legendary giant squid, the species which has inspired generations to tell tales of the fabled Kraken.
Methods
DNA extraction, library building, and de novo genome assembly
High-molecular-weight genomic DNA was extracted from a single A. dux individual (NCBI:txid256136; marinespecies.org:taxname:342218) using a cetyl trimethylammonium bromide–based buffer followed by organic solvent purification, following Winkelmann et al. [18] (details in the Supplementary Methods). We generated 116 Gb of raw reads from Illumina short-insert libraries, 76 Gb of paired-end reads from libraries ranging from 500 to 800 bp in insert size, and 5.4 Gb of mate-pair with a 5-kb insert (Supplementary Table S1). Furthermore, we generated 3.7 Gb of paired-end reads using Moleculo libraries (3 high-throughput libraries and 4 high-fidelity libraries). The k-mer distribution of the reads under a diploid model in kmergenie [19] predicted the genome size to be 2.7 Gb.
An initial assembly generated with Meraculous (Meraculous, RRID:SCR_010700) [20] using Illumina and Moleculo data (N50 of 32 kb, assembly statistics in Supplementary Table S2) was used as input for Dovetail Genomic's HiRise scaffolding software together with the Hi-C data generated from 2 Chicago libraries corresponding to a physical coverage of the genome of 52.1×. This “Meraculous + Dovetail” assembly (statistics in Table 1) was the one used for the genome annotation (non-coding RNAs, protein-coding genes, and repeats) and comparative genomics analyses presented in this article. Further scaffolding was performed using 23.38 Gb of Pacific Biosciences reads (19 single-molecule real-time sequencing [SMRT] cells, mean read length of 14.79 kb) using the default parameters in PBJelly (PBJelly, RRID:SCR_012091) [21] (see assembly statistics in Supplementary Table S2). The genome gene content completeness was evaluated through the BUSCO (BUSCO, RRID:SCR_015008) v.3.0.2 datasets: Eukaryota, Metazoan [22].
Statistics of the giant squid genome assembly (Meraculous + Dovetail) and corresponding gene prediction and functional annotation
| Global statistics | Genome | Gene models with evidence |
|---|---|---|
| Genome assembly* | ||
| Input assembly | Meraculous | |
| Contig N50 length (Mb) | 0.005 | |
| Longest contig (Mb) | 0.120 | |
| Scaffold N50 length (Mb) | 4.852 | |
| Longest scaffold (Mb) | 32.889 | |
| Total length (Gb) | 2.693 | |
| BUSCO statistics (1Euk/2Met) (%) | ||
| Complete BUSCOs | 86.1/88.5 | 81.6/78.3 |
| Complete and single-copy | 85.1/87.6 | 79.9/77.7 |
| Complete and duplicated | 1.0/0.9 | 1.7/0.6 |
| Partial | 4.3/3.6 | 9.6/5.7 |
| Missing | 9.6/7.9 | 8.8/16.0 |
| Total BUSCOs found | 90.4/92.1 | 91.2/84.0 |
| Genome annotation/gene prediction | ||
| Protein-coding gene number | 33,406 | |
| Transcript evidence | 30,472 | |
| Mean protein length (aa) | 339 | |
| Longest protein (aa) | 17,047 | |
| Mean CDS length (bp) | 1,015 | |
| Longest CDS (bp) | 51,138 | |
| Mean exon length (bp) | 199 | |
| Mean exons per gene | 5 | |
| Functional annotation (number of hits) | ||
| Swissprot | 15,749 | |
| Uniref90 | 29,553 | |
| Gene Ontology terms | 4,712 | |
| Conserved Domains Database | 15,280 |
The transcript evidence was confirmed by blastp hits with e-value < 10E−6 using the transcriptomes of 3 other species of squid (see the “Transcriptome sequencing” section).
*The presented statistics are to contigs/scaffolds with length ≥500 bp.
Euk: Database of Eukaryota orthologs genes, containing a total of 303 BUSCO groups.
Met: Database of Metazoa orthologs genes, containing a total of 978 BUSCO groups.
Transcriptome sequencing and de novo assembly
Given the extreme rarity of live giant squid sightings, we were unable to collect fresh organ samples (following the recommendations of Moltschaniwskyj et al. [23]) containing intact RNA from the species to assist with the genome annotation. As an alternative, we extracted total RNA from gonad, liver, and brain tissue from live-caught specimens of 3 other oegopsid squid species (Onychoteuthis banksii, NCBI:txid392296;Dosidicus gigas, NCBI:txid346249; and Sthenoteuthis oualaniensis, NCBI:txid34553; Supplementary Fig. S1), using the Qiagen RNeasy extraction kit (Qiagen, ValenciaCA, USA). The RNA integrity and quantity were measured on a Qubit fluorometer (Invitrogen, Eugene, OR, USA) and on the Agilent Bioanalyzer 2100 (Agilent, Santa Clara, CA, USA). The Illumina TruSeq Kit v.2.0 was used to isolate the messenger RNA and prepare complementary DNA libraries for sequencing, following the recommended protocol. Compatible index sequences were assigned to individual libraries to allow for multiplexing on 4 lanes of 100-bp paired-end technology on an Illumina HiSeq 2000 flow cell. Sequencing of the complementary DNA libraries was performed at the National High-Throughput Sequencing Center at the University of Copenhagen in Denmark. We assessed the quality of the raw reads using FastQC (FastQC, RRID:SCR_014583) v0.10.0 [24]. After removing indexes and adaptors with CutAdapt [25], we trimmed the reads with the FASTX-toolkit [26], removing bases with a Phred-scale quality score <25. Reference transcriptomes for each species were built after pooling the reads from all tissues and using these as input in Trinity (Trinity, RRID:SCR_013048) [27]. This software was used with the default settings including a fixed k-mer size of 25 as suggested by the authors. Annotation of coding regions was performed with the EvidentialGene pipeline [28].
Protein extraction, separation by 1D SDS-PAGE, MALDI-TOF/TOF, and protein identification
Given the practical impossibility of obtaining RNA from a giant squid specimen, we produced a library of giant squid peptide sequences to guide the gene annotation process.
Proteins were solubilized from a giant squid mantle tissue sample according to the procedure described by Kleffmann et al. [29] and using the following buffers: (i) 40 mM Tris–HCl, 5 mM MgCl2, and 1 mM dithiothreitol (DTT), pH 8.5; (ii) 8 M urea, 20 mM Tris, 5 mM MgCl2, and 20 mM DTT; (iii) 7 M urea, 2 M thiourea, 20 mM Tris, 40 mM DTT, 2% CHAPS (w/v), and 1% Triton X-100 (v/v), and (iv) 40 mM Tris, 4% sodium dodecyl sulfate (SDS) (w/v), and 40 mm DTT. All buffers were augmented with protease inhibitors (Halt™ Protease Inhibitor Cocktail, EDTA-Free, Thermo Scientific). Tissue samples were ground in liquid nitrogen before homogenization, or homogenized directly with ultrasound (probe sonication at 60 Hz, for 3 min) in buffer (i). Solubilized proteins were collected by ultracentrifugation at 100,000g and 4°C. Each extraction was performed in duplicate for each specific buffer and extracts were pooled. Protein extracts were subsequently stored at −20°C. Total protein content was estimated according to the Bradford method [30].
Protein separation by 1D SDS-PAGE (polyacrylamide gel electrophoresis) was carried out as described in Santos et al. [31]. A total of 53 µL of sample (39 µg protein) was diluted in 72 µL of loading buffer (0.01% bromophenol blue, 2% SDS, 20% glycerol, 5% β-mercaptoethanol [w/v/v] in 62.5 mM Tris-HCl, pH 6.8). The resulting solution was heated for 3 min at 99°C. Proteins were separated by SDS-PAGE with 12% (w/v) polyacrylamide gels. Electrophoresis was carried out using the mini Protean Cell (BioRad) at a constant voltage of 150 V. The separated proteins were visualized by staining with colloidal Coomassie brilliant blue [32], and lanes were cut into 15 gel sections for subsequent LC-MS/MS analysis.
LC-MS/MS analyses
All samples were analysed with the Easy-nLC system (Thermo Fisher Scientific), connected online to a Q Exactive mass spectrometer (Thermo Fisher Scientific) equipped with a nanoelectrospray ion source (Thermo Fisher Scientific). Tryptic peptides were loaded in a fused silica column (75 µm inner diameter) packed with C18 resin (3-µm beads, Reprosil, Dr. Maisch), with solvent A (0.5% acetic acid). They were then eluted with a 120-minute gradient of solvent B (80% acetonitrile, 0.5% acetic acid) with a constant flow of 250 nL/min. The Q exactive was operated in positive mode with a capillary temperature of 250 °C, using the data-dependent acquisition method, which switches from full MS scans to MS/MS scans for the 12 most intense ions. Fragmentation was achieved by higher-energy collisional dissociation with a normalized collisional energy of 25. Full MS ranged from 300 to 1,750 m/z at a resolution of 70,000, an automatic gain control of 1e6, and a maximum injection time of 120 ms, whereas MS/MS events were scanned at a resolution of 35,000, an automatic gain control of 1e5, maximum injection time of 124 ms, isolation windows of 2 m/z, and an exclusion window of 45 seconds.
de novo peptide prediction
Raw LC-MS/MS data were read using Thermo Fisher MSRawFileReader 2.2 library and imported into PEAKS Studio 7.0 and subsequently pre-processed for precursor mass and charge correction, MS/MS de-isotoping, and deconvolution. PEAKS de novo sequencing [32] was performed on each refined MS/MS spectrum with a precursor and fragment ion error tolerance of 7 ppm and 0.02 Da, respectively. Carbamidomethylation (Cys) was set as a fixed modification, and oxidation (Met) and N-terminal Acetylation as variable modifications. At most, 5 variable modifications per peptide were allowed. For each tandem spectrum, 5 de novo candidates were reported along with their local confidence scores (the likelihood of each amino acid assignment in a de novo candidate peptide). This score was used to determine the accuracy of the de novo peptide sequences. The top de novo peptide for each spectrum was determined by the highest average local confidence score among the candidates for that spectrum.
Genome annotation
Protein-coding genes were predicted by ExonHunter [33], which combines probabilistic models of sequence features with external evidence from alignments. As external evidence, we have used the transcriptomes of oegopsid squid species obtained as a part of this project (O. banksii, D. gigas, and S. oualaniensis); these transcripts were translated into proteins to facilitate cross-species comparison. In addition, known proteins from (Octopus bimaculoides), Crassostrea gigas (Pacific oyster), and Lottia gigantea (Giant owl limpet) were used to inform the gene prediction process. The proteins were aligned to the genome by BLASTX. De novo identified MS/MS-based peptides were initially also considered as external evidence but were later omitted owing to low coverage. Evidence from predicted repeat locations was used to discourage the model from predicting genes overlapping repeats. Because no sufficiently close annotated genome was available for training gene-finding parameters, ExonHunter was first run using Drosophila melanogaster parameters on a randomly chosen subset of 118 scaffolds longer than 200 kb (total length 199 Mb). Out of 12,912 exons predicted in this run, 5,716 were supported by protein alignment data and selected to train the parameters of the gene-finding model for A. dux, using the methods described by Brejová et al. [33]. Such iterative training has been previously shown to yield gene prediction results similar to those of training on curated gene sets [33–35]. Rerunning ExonHunter with the resulting A. dux model parameters on the entire genome yielded 51,225 candidate gene prediction genes. Gene prediction in A. dux is challenging owing to the fragmentary nature of the genome assembly (60% of predictions span a sequencing gap). This results in a significant number of artifacts, e.g., short genes with long introns spanning gaps in the assembly. A total of 18,054 predictions yield protein product shorter than 100 amino acids (aa), yet the median span of these predictions is >4 kb and only 32% of them are supported by transcript or protein alignments. In contrast, 83% of genes with product longer than 100 aa are supported. Another factor contributing negatively to gene prediction quality is the lack of RNA-sequencing data from A. dux due to unavailability of fresh organ samples. In most of the analyses below, we consider only 33,406 genes that were found to have transcript evidence (blastp match to a sequence from a cephalopod transcriptome, with ≥50% of the giant squid coding region covered) and/or matches in Swissprot or UniRef90 databases (Table 1). This supported set contains much fewer extremely short genes (Supplementary Fig. S4).
The function of the protein-coding genes was inferred with Annocript 0.2 [36], which is based on the results from blastp [37] runs against SwissProt and UniRef90. In addition, we performed a rpsblast search using matrices from the Conserved Domain Database to annotate specific domains present on the protein queries.
Non-coding RNAs were annotated using the cmsearch program from INFERNAL 1.1 (INFERNAL, RRID:SCR_011809) and the covariance models (CMs) from the Rfam database v12.0 [38, 39]. All matches above the curated GA threshold were included. INFERNAL was selected because it implements the CMs that provide the most accurate bioinformatic annotation tool for non-coding RNAs (ncRNAs) available [40]. tRNA-scan v.1.3.1 was subsequently used to refine the annotation of transfer RNA (tRNA) genes (Supplementary Table S3). The method uses a number of heuristics to increase the search speed, annotates the isoacceptor type of each prediction, and infers whether predictions are likely to be functional or tRNA-derived pseudogenes [41, 42]. This method uses CMs to identify tRNAs. Rfam matches and the tRNA-scan results for families belonging to the same clan were then “competed,” so that only the best match was retained for any genomic region [39].
Transposable element annotation
Repetitive elements were first identified using RepeatMasker (RepeatMasker, RRID:SCR_012954) v.4.0.8 [43] with the eukaryota RepBase [44] repeat library. Low-complexity repeats were ignored (-nolow) and a sensitive (-s) search was performed. Following this, a de novo repeat library was constructed using RepeatModeler (RepeatModeler, RRID:SCR_015027) v.1.0.11 [45], including RECON v.1.08 [46] and RepeatScout (RepeatScout, RRID:SCR_014653) v.1.0.5 [47]. Novel repeats identified by RepeatModeler were analyzed with a “BLAST, Extract, Extend” process to characterize elements along their entire length [48]. Consensus sequences and classification information for each repeat family were generated. The resulting denovo repeat library was used to identify repetitive elements using RepeatMasker.
Data Analyses
We present a main draft genome assembly produced using 200 Gb of Illumina reads, 4 Gb of Moleculo synthetic long reads, and 108 Gb of Chicago libraries, with a final size matching the estimated genome size of 2.7 Gb, and a scaffold N50 of 4.8 Mb (assembly and annotation statistics in Table 1). Genome completeness estimated by BUSCO reached 90.4% (Eukaryota) and 92.1% (Metazoa), and the completeness for the 33,406 protein-coding genes was 91.2% (Eukaryota) and 84.0% (Metazoa).
We also produced an alternative assembly including 27 Gb raw reads generated using the Pacific Biosciences platform, but this showed minimal improvement in assembly statistics, genome size larger than predicted, and lower BUSCO completeness (Supplementary Table S2).
Comparative analyses of transposable elements
We estimated the total repeat content of the giant squid genome to be approximately half its total size (∼49.1%) (Fig. 1, Supplementary Table S4). Of all the repeats present in the giant squid genome, only a few were predicted to be small RNAs, satellites, or simple or low-complexity repeats (∼0.89% of the total genome), with the vast majority (∼48.21%) instead consisting of transposable elements (TEs; i.e., short interspersed nuclear elements [SINEs], long interspersed nuclear elements [LINEs], long terminal repeat [LTR] retrotransposons, and DNA transposons; Fig. 1, Supplementary Table S4). Of the TE portion of the giant squid genome, the main contribution from annotated TEs is from DNA elements (11.06%) and LINEs (6.96%), with only a small contribution from SINEs (1.99%) and LTR elements (0.72%). TEs are a nearly universal feature of eukaryotic genomes, often comprising a large proportion of the total genomic DNA (e.g., the maize genome is ∼85% TEs [49], stick insect genome is ∼52% TEs [50], and the human genome is >45% TEs [51]); consequently, these account for the majority of observed genome size variation among animals.
![Comparison of genome repeat content among available cephalopod genomes with assembled genomes (repeat data for O. minor and O. bimaculoides from [52] and for E. scolopes from [53]). The tree indicates evolutionary relationships among the 2 available octopod cephalopods and the 2 available decapod cephalopods. Pie charts are scaled according to genome size (O. bimaculoides: 2.7 Gb, O. minor: 5.09 Gb, E. scolopes: 5.1 Gb, A. dux: 2.7 Gb), with repeat types indicated by colour.](https://oup.silverchair-cdn.com/oup/backfile/Content_public/Journal/gigascience/9/1/10.1093_gigascience_giz152/3/m_giz152fig1.jpeg?Expires=1716338615&Signature=MTktBdazrNEgnh97MFDIM0L8LQDGFpkrz9HYgHSeFTvZIiQHxguGcgz2FHRfKR-3NZEPY49QqMslO6JZpmW5LuGT1AZIIiGVnqrcduQg14WZr8B0Yjj7P3YAtKM97XxFLVM-ADTLRp1hDnnCqXxQcK3mdIxAOtULH77dkaHpcOIebywHXUnogsVgkMtTwZH5zfKaPk5Wblwu2F5tExnZAEYXzeSgWL4YAiWNYMK~yFBPS7~cXgxZkbMRwO0TI7tWEsj4fRiEhIFuyN8NUKn4HeZ-AsDHk5AD9iJLljBTXBOjTdHwB-n8Xi4kFoDJwteAFKP2WXGy-JmG5oy9MT8LuQ__&Key-Pair-Id=APKAIE5G5CRDK6RD3PGA)
Comparison of genome repeat content among available cephalopod genomes with assembled genomes (repeat data for O. minor and O. bimaculoides from [52] and for E. scolopes from [53]). The tree indicates evolutionary relationships among the 2 available octopod cephalopods and the 2 available decapod cephalopods. Pie charts are scaled according to genome size (O. bimaculoides: 2.7 Gb, O. minor: 5.09 Gb, E. scolopes: 5.1 Gb, A. dux: 2.7 Gb), with repeat types indicated by colour.
In Fig. 1, we summarize the recently reported TE analyses performed on assembled cephalopod genomes, as follows: California two-spot octopus (Octopus bimaculoides) [11] and long-arm octopus (Octopus minor) [52], Hawaiian bobtail squid (Euprymna scolopes) [53], and giant squid (A. dux). The varying sequencing strategies used to generate currently available cephalopod genomes (and accompanying variation in assembly quality) complicate the comparative analysis of TE content for this group. However, notwithstanding this caveat, it does seem clear that TEs make up a large fraction of the total genomic content across all cephalopod genomes published to date (Fig. 1). DNA transposons and LINEs dominate in available cephalopod genomes, while LTR elements and SINEs generally represent a minor portion of cephalopod TEs (Fig. 1). Within decapod cephalopods (i.e., squid and cuttlefish), patterns in TE content are generally similar; however, the giant squid has a notably larger proportion of DNA transposons (1,626,482 elements, 11.06% of the total genome) than the Hawaiian bobtail squid (855,308 elements, 4.05% of the total genome), with the bobtail squid in turn having a similar proportion of LINEs (752,629 elements, 6.83% of the total genome) to the giant squid (766,382 elements, 6.96% of the total genome; Fig. 1).
The defining ability of TEs to mobilize, in other words, to transfer copies of themselves into other parts of the genome, can result in harmful mutations. However, TEs can also facilitate the generation of genomic novelty, and there is increasing evidence of their importance for the evolution of host-adaptive processes [54]. In the giant squid genome, all classes of TEs were more frequent (∼38.23%) in intergenic regions (here defined as regions >2 kb upstream or downstream of an annotated gene) than in genic regions versus percentage of the genome in intergenic regions (∼16.6%; Fig. 2A). These findings are broadly similar to those reported for other cephalopods, although a larger proportion of the giant squid genome is composed of repeats located within genic regions (percentage of the genome represented by TEs for Octopus bimaculoides: ∼6% genic versus ∼30% intergenic, and for O. minor: ∼6% genic versus ∼40% intergenic [52]).
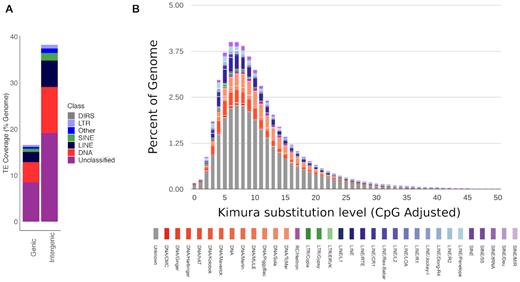
(A) Stacked bar chart illustrating the proportions (expressed as percentage of the total genome) of repeats found in genic (≤2 kb from an annotated gene) and intergenic regions (>2 kb from an annotated gene) for the giant squid genome. TE classes include DIRS: Dictyostelium intermediate repeat sequence 1 - like elements. (B) Transposable element (TE) accumulation history in the giant squid genome, based on a Kimura distance-based copy divergence analysis of TEs, with Kimura substitution level (CpG adjusted) illustrated on the x-axis, and percentage of the genome represented by each repeat type on the y-axis. Repeat type is indicated by bar colour.
A Kimura distance-based copy divergence analysis revealed that the most frequent TE sequence divergence relative to the TE consensus sequence in the giant squid genome was ∼5–8% across all repeat classes, suggesting a relatively recent transposition burst across all major TE types (Fig. 2B). Divergence peaks were most pronounced in LINE RNA transport elements, Tc/Mar and hAT DNA transposons, and unclassified TEs, with smaller divergence peaks in SINE tRNA elements and Penelope LINE elements (Fig. 2B). Divergence peaks were most pronounced in LINE RNA transport elements, Tc/Mar and hAT DNA transposons, and unclassified TEs, with smaller divergence peaks in SINE tRNA elements and Penelope LINE elements (Fig. 2B). In comparison to observations from other cephalopods, these results suggest a shorter and more intense burst of recent TE activity in the giant squid genome. Overall, further genomic sampling within each of the cephalopod clades will be needed to understand TE evolution, as closely related species can show significant differences (e.g., O. bimaculoides to O. vulgaris) [55].
Non-coding RNAs
We identified 50,598 ncRNA-associated loci in the squid sequencing data, using curated homology-based probabilistic models from the Rfam database [56] and the specialized tRNAscan-SE (tRNAscan-SE, RRID:SCR_010835) tRNA annotation tool [41]. The essential and well-conserved Metazoan ncRNAs: tRNAs, ribosomal RNAs (rRNAs) (5S, 5.8S, SSU, and LSU), RNase P, RNase MRP, SRP, and the major spliceosomal snRNAs (U1, U2, U4, U5, U6), as well as the minor spliceosomal snRNAs (U11, U12, U4atac, and U6atac), are all found in the A. dux genome. Some of the copy numbers associated with the core ncRNAs are extreme. For example, we identified (i) ∼24,000 loci that seem to derive from 5S rRNA, (ii) ∼17,000 loci that are predicted to be tRNA derived, (iii) ∼3,200 valine tRNAs isotypes and ∼1,300 U2 spliceosomal RNAs. The microRNA mir-598 also exhibits high copy numbers at 172. Many of these are likely to be SINEs derived by transposition. All 20 tRNA isotypes were identified in the A. dux genome. Again, many of these had relatively large copy numbers (summarized in Table 1). These ranged from 46 (Cys) up to 2,541 (Val). We identified 174 loci that share homology with 34 known small nucleolar RNA (snoRNA) families; these included 15 small Cajal body–specific RNA, 41 H/ACA box, and 118 C/D box snoRNA-associated loci [10]. The snoRNAs are predominantly involved in rRNA maturation. We identified 7,049 loci that share homology with 283 families of microRNA. Some of these may be of limited reliability because CMs for simple hairpin structures can also match other, non-homologous, hairpin-like structures in the genome, e.g., inverted repeats. A number of cis-regulatory elements were also identified. These included 235 hammerhead 1 ribozymes, 133 Histone 30 untranslated region stem-loops, and 14 potassium channel RNA editing signal sequences. There are very few matches to obvious non-metazoan RNA families in the current assemblies. The only notable exceptions are bablM, IMES-2, PhotoRC-II, and rspL. Each of these families are also found in marine metagenomic datasets, possibly explaining their presence as “contamination” from the environment.
Analyses of specific gene families
Several gene families involved in development, such as transcription factors or signaling ligands, are highly conserved across metazoans and may therefore reveal signatures of genomic events, such as a whole-genome duplication.
WNT is a family of secreted lipid-modified signaling glycoproteins that plays a key role during development [57]. Comparative analysis of molluscan genomes indicates that the ancestral state was 12 WNT genes, as Wnt3 is absent in all protostomes examined thus far [58]. The giant squid has the typical 12 lophotrochozoan WNTs (1, 2, 4, A, 5, 6, 7, 8, 9, 10, 11, and 16; Supplementary Fig. S2) and therefore has retained the ancestral molluscan complement, including Wnt8, which is absent, for instance, in the genome of the slipper snail Lottia gigantea [59].
Protocadherins are a family of cell adhesion molecules that seem to play an important role in vertebrate brain development [60]. It is thought that they act as multimers at the cell surface in a manner akin to DSCAM in flies, which lack protocadherins [61]. Cephalopods have massively expanded this family, with 168 identified in the O. bimaculoides genome, whereas only 17–25 protocadherins have been identified in the genomes of annelids and non-cephalopod molluscs [11]. We identified ∼135 protocadherin genes in A. dux, many of which are located in clusters in the genome. The possibility that this gene family plays a developmental role parallel to that of protocadherins in vertebrate neurodevelopment thus remains a compelling hypothesis.
Development organization of the highly diverse body plans found in the Metazoa is controlled by a conserved cluster of homeotic genes, which includes, among others, the Hox genes. These are characterized by a DNA sequence referred to as the homeobox, comprising 180 nucleotides that encode the homeodomain [62]. Hox genes are usually found in tight physical clusters in the genome and are sequentially expressed in the same chronological order as they are physically located in the DNA (temporal and spatial collinearity) [63]. Different combinations of Hox gene expression in the same tissue type can lead to a wide variety of different structures [64]. This makes the Hox genes a key subject for understanding the origins of the multitude of forms found in the cephalopods. In the O. bimaculoides genome assembly no scaffold contained more than a single Hox gene, meaning that they are fully atomized [11]. However, in E. scolopes, the Hox cluster was found spanning 2 scaffolds [53]. In the giant squid, we recovered a full Hox gene cluster in a single scaffold (Fig. 3B). The Hox gene organization found in the giant squid genome suggests either the presence of a disorganized cluster, so-called type D, or atomized clusters, type A [64], or possibly a combination of the two (the genes are still organized but physically distant from each other). The existence of a “true” cluster seems unlikely, given the presence of other unrelated genes in between and the relatively large distances (Fig. 3C). The classification as type A (atomized) might seem most obvious, despite the co-presence of the genes in a single scaffold, due to these large distances. However, the definition of type D (disorganized) does allow for the presence of non-Hox genes in between members of the cluster (Fig. 3A). Thus, it is difficult to clearly categorize the recovered “cluster,” but it does remain clear that these genes are not as tightly bundled as they are in other Bilateria lineages. The A. dux Hox cluster is spread across 11 Mb of a 38-Mb scaffold, and this suggests a far larger size range in the cephalopods than in other described animals, as recently suggested based on the genome of E. scolopes [53]. It is possible that this is the reason for the apparent atomization of Hox genes in the more fragmented O. bimaculoides assembly. Hox clusters are usually found in contigs of ∼100 kb length in vertebrates [6, 7] and between 500 and 10,000 kb in invertebrates [8]. An assembled contig easily containing the complete cluster for these smaller cluster sizes would manage to cover only 1 member of the Hox gene cluster in the studied coleoids. As such, our results suggest that the Hox cluster may not be fully atomized in O. bimaculoides as previously hypothesized. Further improvements of genome assemblies in cephalopods will be required to address this question. The biological reason for this dramatic increase in the distance between the genes in the Hox cluster presents an intriguing avenue of future research. The homeodomain of all the obtained Hox genes in cephalopods was compared with those of other mollusks. Few differences were found relative to a previous study [65] because no significant modifications were observed in Hox1, Hox4, ANTP, Lox2, Lox5, Post1, and Post2. Hox1 did, however, show reduced conservation in residues 22–25 in the A. dux sequence. This observation for Hox1 in A. dux is visible only in the PacBio assembly. Additionally, the Hox3 homeodomain analysis supports a basal placement of the nautiloids within cephalopods. The Lox4 gene was the most variable among all groups. To date, Hox2 remains undetected in the coleoid cephalopods [66]. Assembly errors notwithstanding, gain and loss of Hox genes has been attributed to fundamental changes in animal body plans, and the apparent loss of Hox2 may therefore be significant. For example, Hox gene loss has been associated with the reduced body-plan segmentation of spider mites [43]. The circumstance that Hox2 has been readily found in Nautilus, but remains undetected in all coleoids sequenced thus far, might signify an important developmental split within the Cephalopoda. Alternatively, and equally intriguing, this Hox gene may have undergone such drastic evolutionary modifications that it is presently undetectable by conventional means.
![Schematic representation of the Hox gene clusters. Different scaffolds are separated by 2 slashes. (A) Simplified classification of the Hox clusters genomic organization. Type A identifies the lack of a “typical” Hox cluster configuration, i.e., genes are scattered through the genome (not closely placed); Type S indicates a Hox cluster that is separated by a chromosomal breakpoint; Type D clusters comprehend all the genes in the same location but encompassing a larger region than in organized clusters and may display non-Hox genes and repeats in between; Type O indicates a very compact cluster embracing a short region with only Hox genes. Non-coding RNA and microRNA can be found. (B) Simplified scheme of the chromosomal organization in various invertebrates. Scaffold length is shown underneath. Unlike in other coleoids, for Architeuthis dux all Hox genes were found in the same scaffold. However, the distance between the genes was larger than expected for invertebrate organisms, and non-homeobox genes were also present within the cluster. Hox2 remains undetected in coleoids. A. dux cluster can be found in scaffold 25. E. scolopes, O. bimaculoides, L. gigantea, C. teleta, and D. melanogaster assemblies and Hox cluster details can be found in [11, 53, 59, 70]. The asterisk indicates a gene that was reported in a different scaffold, adjacent to non-Hox genes (the length corresponds to the size of the gene). (C) Complete representation of the Hox cluster found in A. dux including the non-Hox genes. PO—predicted open reading frame; TATDN2–putative deoxyribonuclease TATDN2; ZMYM1–zinc finger MYM-type protein 1; POGK—pogo transposable element with KRAB; zinc finger—zinc finger protein; MYB-like—putative Myb-like DNA-binding domain protein; MAPRE1–microtubule-associated protein RP/EB family member 1; MGC12965–similar to cytochrome c, somatic.](https://oup.silverchair-cdn.com/oup/backfile/Content_public/Journal/gigascience/9/1/10.1093_gigascience_giz152/3/m_giz152fig3.jpeg?Expires=1716338615&Signature=WbsEPQZ2iCUyydUaQ~a8Cgki9E1rsGBcr2nCXZ6n4bB2XGKh587mG1OLvehbxZr7FhYZdNQR0hZJRs0FLz3uIMPo6n0SjlfDwLVOkkE56o1eU7xXsUZyyJoHM-HZ2ycXiCbqymakj492cRuUwfeh2Gsdzfkgv9f4dZYTz2hOB2LCX2uOlRrnXxTvvJmgT7toS~GLlIVx8ItBKxeqWwP6-~Lw2bZnm3o5BcLoc7L37Ha0YKpHZe6mOHoXDMT2m4JgE4aeuFDLHGy6RPLzLTQ0D485zeL-Y7iFBCLWLA~f9Z4foTII0b9nP~1YehoTy4ONnqmtonL7y4kwT0m1C0nALg__&Key-Pair-Id=APKAIE5G5CRDK6RD3PGA)
Schematic representation of the Hox gene clusters. Different scaffolds are separated by 2 slashes. (A) Simplified classification of the Hox clusters genomic organization. Type A identifies the lack of a “typical” Hox cluster configuration, i.e., genes are scattered through the genome (not closely placed); Type S indicates a Hox cluster that is separated by a chromosomal breakpoint; Type D clusters comprehend all the genes in the same location but encompassing a larger region than in organized clusters and may display non-Hox genes and repeats in between; Type O indicates a very compact cluster embracing a short region with only Hox genes. Non-coding RNA and microRNA can be found. (B) Simplified scheme of the chromosomal organization in various invertebrates. Scaffold length is shown underneath. Unlike in other coleoids, for Architeuthis dux all Hox genes were found in the same scaffold. However, the distance between the genes was larger than expected for invertebrate organisms, and non-homeobox genes were also present within the cluster. Hox2 remains undetected in coleoids. A. dux cluster can be found in scaffold 25. E. scolopes, O. bimaculoides, L. gigantea, C. teleta, and D. melanogaster assemblies and Hox cluster details can be found in [11, 53, 59, 70]. The asterisk indicates a gene that was reported in a different scaffold, adjacent to non-Hox genes (the length corresponds to the size of the gene). (C) Complete representation of the Hox cluster found in A. dux including the non-Hox genes. PO—predicted open reading frame; TATDN2–putative deoxyribonuclease TATDN2; ZMYM1–zinc finger MYM-type protein 1; POGK—pogo transposable element with KRAB; zinc finger—zinc finger protein; MYB-like—putative Myb-like DNA-binding domain protein; MAPRE1–microtubule-associated protein RP/EB family member 1; MGC12965–similar to cytochrome c, somatic.
On a final note, we analyzed genes encoding reflectins, a class of cephalopod-specific proteins first described in E. scolopes [67]. Reflectins form flat structures that reflect ambient light (other marine animals use purine-based platelets), thus modulating iridescence for communication or camouflage purposes [68]. The giant squid genome contains 7 reflectin genes and 3 reflectin-like genes (Supplementary Fig. S3). All of these genes, with the exception of 1 reflectin gene, appear on the same scaffold, which corresponds very well with the distribution pattern of octopus reflectin genes [11].
Conclusions
Not only because of its astonishing proportions, but also for the lack of knowledge of the key facets of its deep-sea lifestyle, the giant squid has long captured the imagination of scientists and the general public alike. With the release of this annotated giant squid genome, we set the stage for future research into the enigmas that enshroud this awe-inspiring creature. Furthermore, given the paucity of available cephalopod genomes, we provide a valuable contribution to the genomic description of cephalopods, and more widely to the growing number of fields that are recognizing the potential that this group of behaviourally advanced invertebrates holds for improving our understanding of the diversity of life on Earth in general.
Availability of Supporting Data and Materials
The datasets supporting the results of this article are available in the NCBI database via Bioproject PRJNA534469. The 3 transcriptome datasets (TSA) have IDs GHKK01000000, GHKL01000000, and GHKH01000000 and the sequence data used for the genome assemblies have ID VCCN01000000. Proteomics data are available via ProteomeXchange with identifier PXD016522. Supporting data are also available via the Gigascience repository GigaDB [69].
Additional Files
Supplementary Methods:
DNA extraction
MALDI-TOF/TOF and protein identification
Repeat assembly from raw reads with REPdenovo
Repeat assembly from raw reads with RaAS
Supplementary Figures:
Figure S1. Sample details.
Figure S2. Phylogenetic tree: WNTs.
Figure S3. Phylogenetic tree: reflectins.
Figure S4. Size distribution of protein-coding genes.
Supplementary Tables:
Table S1. Sequence data.
Table S2. Assembly statistics.
Table S3. Copy numbers of RNA isotypes.
Table S4. Repeat summary.
Abbreviations
aa: amino acids; BLAST: Basic Local Alignment Search Tool; bp: base pairs; BUSCO: Benchmarking Universal Single-copy Orthologs; CDS: coding sequence; CM: covariance model; DIRS: Dictyostelium intermediate repeat sequence 1 - like elements; DTT: dithiothreitol; Gb: gigabase pairs; kb: kilobase pairs; LC-MS/MS: liquid chromatography tandem mass spectrometry; LINE: long interspersed nuclear element; LTR: long terminal repeat; MALDI-TOF: matrix-assisted laser desorption/ionization-time of flight; Mb: megabase pairs; NCBI: National Center for Biotechnology Information; ncRNA: non-coding RNA; PAGE: polyacrylamide gel electrophoresis; rRNA: ribosomal RNA; SDS: sodium dodecyl sulfate; SINE: short interspersed nuclear element; SMRT: single-molecule real-time sequencing; snoRNA: small nucleolar RNA; TE: transposable element; tRNA: transfer RNA.
Ethics Statement
Sampling followed the recommendations from Moltschaniwskyj et al. 2007 [23].
Competing interests
The authors declare that they have no competing interests.
Funding
R.R.F. thanks the Villum Fonden for grant VKR023446 (Villum Fonden Young Investigator Grant), the Portuguese Science Foundation (FCT) for grant PTDC/MAR/115347/2009; COMPETE-FCOMP-01-012; FEDER-015453, Marie Curie Actions (FP7-PEOPLE-2010-IEF, Proposal 272927), and the Danish National Research Foundation (DNRF96) for its funding of the Center for Macroecology, Evolution, and Climate. H.O. thanks the Rede Nacional de Espectrometria de Massa, ROTEIRO/0028/2013, ref. LISBOA-01-0145-FEDER-022125, supported by COMPETE and North Portugal Regional Operational Programme (Norte2020), under the PORTUGAL 2020 Partnership Agreement, through the European Regional Development Fund (ERDF). A.C. thanks FCT for project UID/Multi/04423/2019. M.P. acknowledges the support from the Wellcome Trust (grant number WT108749/Z/15/Z) and the European Molecular Biology Laboratory. M.P.T.G. thanks the Danish National Research Foundation for its funding of the Center for GeoGenetics (grant DNRF94) and Lundbeck Foundation for grant R52–5062 on Pathogen Palaeogenomics. S.R. was supported by the Novo Nordisk Foundation grant NNF14CC0001. A.H. is supported by a Biotechnology and Biological Sciences Research Council David Phillips Fellowship (fellowship reference: BB/N020146/1). T.B. is supported by the Biotechnology and Biological Sciences Research Council-funded South West Biosciences Doctoral Training Partnership (training grant reference BB/M009122/1). This work was partially funded by the Lundbeck Foundation (R52-A4895 to B.B.).
H.J.T.H. was supported by the David and Lucile Packard Foundation, the Netherlands Organization for Scientific Research (#825.09.016), and currently by the Deutsche Forschungsgemeinschaft (DFG) under grant HO 5569/2-1 (Emmy Noether Junior Research Group). T.V. and B. Brejova were supported by grants from the Slovak grant agency VEGA (1/0684/16, 1/0458/18). F.S. was supported by a PhD grant (SFRH/BD/126560/2016) from FCT. A.A. was partly supported by the FCT project PTDC/CTA-AMB/31774/2017. C.C. and Y.W. are partly supported by grant IIS-1526415 from the US National Science Foundation. Computation for the work described in this article was partially supported by the DeiC National Life Science Supercomputer at DTU.
Authors' Contributions
R.D.F. and M.T.P.G. designed the study. J.S., H-J.H., and R.T. carried out the sampling. A. Campos, A.R., B.F., G.C.A., H.O., and I.W. performed the laboratory work. R.D.F., A. Couto, A.M., C.B.A., F.S., P.G., T.B., A.H., I.B.H., C.C., B.P., F.P., M.P., F.M., O.S., S.R., M.Z.R., and D.P. analyzed the data. E.J., G.Z., J.V., O.F., and Q.L. contributed with genomic resources. R.D.F., L.F.C.C., A.A., Y.W., B.M., R.S., T.V., B.B., T.S-P., and M.T.P.G. contributed with supervision and computational resources. R.R.F., T.S-P., R.N., and M.T.P.G paid for sequencing. R.D.F. wrote the manuscript with contributions from all authors. All authors have read and approved the manuscript.
ACKNOWLEDGEMENTS
We would like to thank Anders Hansen, Tobias Mourier, Kristin Rós Kjartansdóttir, and Lars Hestbjerg Hansen for help with generating sequencing data; Shawn Hoon for sharing transcriptome data; Annie Lingren for help with sample shipping; and Peter Smith for providing samples and the support of the entire team at Dovetail.
