


Summary
Convergence in the eastern Mediterranean of oceanic Nubia with Anatolia and the Aegean is complex and poorly understood. Large volumes of sediment obscure the shallow structure of the subduction zone, and since much of the convergence is accommodated aseismically, there are limited earthquake data to constrain its kinematics. We present new source models for recent earthquakes, combining these with field observations, published GPS velocities and reflection-seismic data to investigate faulting in three areas: the Florence Rise, SW Turkey and the Pliny and Strabo Trenches. The depths and locations of earthquakes reveal the geometry of the subducting Nubian plate NE of the Florence Rise, a bathymetric high that is probably formed by deformation of sediment at the surface projection of the Anatolia–Nubia subduction interface. In SW Turkey, the presence of a strike-slip shear zone has often been inferred despite an absence of strike-slip earthquakes. We show that the GPS-derived strain-rate field is consistent with extension on the orthogonal systems of normal faults observed in the region and that strike-slip faulting is not required to explain observed GPS velocities. Further SW, the Pliny and Strabo Trenches are also often interpreted as strike-slip shear zones, but almost all nearby earthquakes have either reverse-faulting or normal-faulting focal mechanisms. Oblique convergence across the trenches may be accommodated either by a partitioned system of strike-slip and reverse faults or by oblique slip on the Aegean–Nubia subduction interface. The observed late-Quaternary vertical motions of coastlines close to the subduction zone are influenced by the interplay between: (1) thickening of the material overriding the subduction interface associated with convergence, which promotes coastal uplift; and (2) subsidence due to extension and associated crustal thinning. Long-wavelength gravity data suggest that some of the observed topographic contrasts in the eastern Mediterranean are supported by mantle convection. However, whether the convection is time dependent and whether its pattern moves relative to Nubia are uncertain, and its contribution to present-day rates of vertical coastal motions is therefore hard to constrain. The observed extension of the overriding material in the subduction system is probably partly related to buoyancy forces arising from topographic contrasts between the Aegean, Anatolia and the Mediterranean seafloor, but the reasons for regional variations are less clear.
1 INTRODUCTION
The active tectonics of the eastern Mediterranean is ultimately related to the N–S convergence between Nubia and Eurasia at ∼10 mm yr−1 (Reilinger et al. 2006; DeMets et al. 2010). The leading edge of Nubia is the seafloor of the eastern Mediterranean, consisting of oceanic crust (e.g. Le Pichon et al. 1979; Chaumillon & Mascle 1997), possibly as old as Palæozoic (Granot 2016), yet nowhere is it in contact with the stable Eurasian plate. Instead, the southern margin of Eurasia consists of continental material moving relatively rapidly (typically > 10 mm yr−1; Reilinger et al. 2006; Nocquet 2012) with respect to the stable interior, and in a variety of directions. The ultimate fate of the Nubian oceanic crust is subduction into the mantle, shown by the occurrence in several places of earthquakes as deep as 100–150 km (e.g. Caputo et al. 1970; Jackson & McKenzie 1984; Hatzfeld & Martin 1992; Hatzfeld 1994). However, at shallow levels the Nubian oceanic crust is covered by sediment up to 10 km thick, detached from the underlying basement by décollement layers, particularly in Cretaceous shale and Messinian salt (Chaumillon & Mascle 1997; Huguen et al. 2001). Most of this sediment is not subducted into the mantle (e.g. Mann 1983; Briqueu et al. 1986; Zellmer et al. 2000) and its presence obscures the usual bathymetric features of typical oceanic subduction zones. Nonetheless, the region contains several prominent, deep and linear bathymetric escarpments that are clearly related to faulting (Emery et al. 1966; Jongsma 1977; Le Pichon et al. 1979; Huchon et al. 1982). Some of these have, through frequent historical usage, acquired the name of ‘trench’; though they are not situated at the surface projection of a major subduction-zone megathrust, as in other oceanic settings. This paper is concerned with how the convergence between Nubia and the material to its north is accommodated between the longitudes of western Crete and Cyprus (Fig. 1), including the deformation of oceanic sediments and of the continental crust that overrides the subduction interface. Studies of the region can draw on observations from earthquakes, GPS (on land), marine geophysics and coastal tectonics, but everywhere below sea level is obscured by sediment and it is known that much of the convergence is accommodated by aseismic processes (e.g. Jackson & McKenzie 1988; Shaw & Jackson 2010). As a result, important features of the convergence that are the object of this study have until now remained relatively poorly understood.
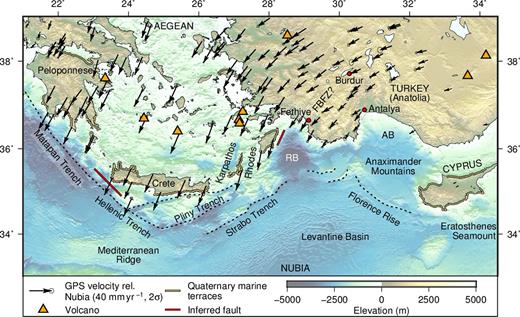
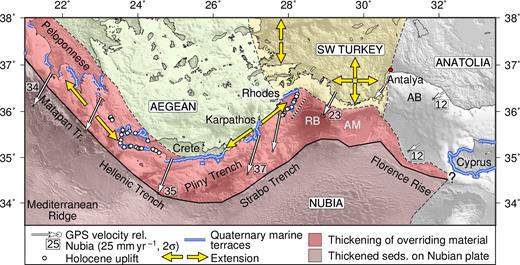
GPS velocities and selected tectonic features in the eastern Mediterranean. Coasts where uplift of Pliocene–Quaternary marine terraces has been observed are marked by yellow and black lines, GPS velocities relative to stable Nubia are shown by black arrows and active volcanoes are marked by orange triangles. The tsunamigenic reverse faults inferred by Shaw et al. (2008) and Howell et al. (2015) to explain uplift of Crete and Rhodes in large earthquakes are marked by thick red lines. ‘RB’, ‘AB’ and ‘FBFZ’ refer to the Rhodes Basin, Antalya Basin and the often-hypothesized Fethiye–Burdur Fault Zone. Terrace locations are compiled from Kelletat et al. (1976), Gauthier (1979), Angelier (1979), Dreghorn (1981), Peters et al. (1985), Stiros et al. (2000), Kontogianni et al. (2002), Gaki-Papanastassiou et al. (2009, 2011), Stiros et al. (2009), Zomeni (2012) and our own fieldwork. GPS velocities are from the data of Nocquet (2012), rotated into a Nubia-fixed reference frame using the pole of Reilinger et al. (2006). Volcanoes are from Siebert & Simkin (2002). Topography is SRTM15 (Becker et al. 2009; Sandwell et al. 2014).
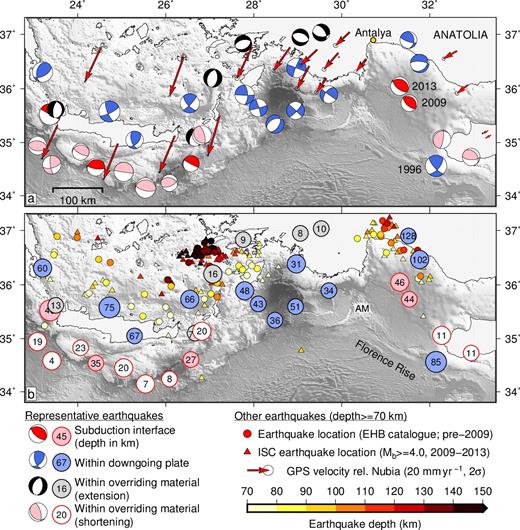
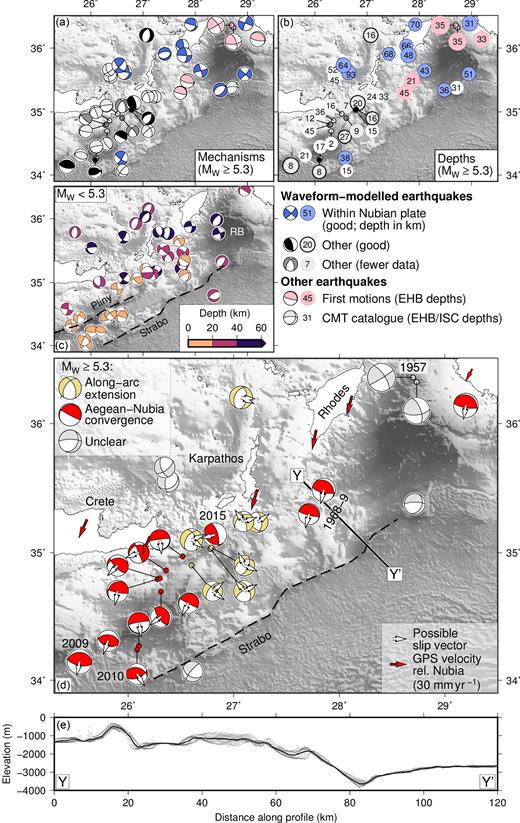
Overview of the seismicity of the eastern Mediterranean. (a) Representative mechanisms of waveform-modelled earthquakes on the subduction interface between Eurasia and Nubia (red), in the downgoing Nubian plate (blue) and reverse-faulting (pink) and normal-faulting (black) earthquakes within the overriding Aegean material (for a more complete compilation see Shaw & Jackson 2010). Focal mechanisms are scaled by magnitude, with the size of the earthquakes in the key representative of Mw 6.0. Red arrows show selected GPS velocities relative to Nubia. (b) Centroid depths of the earthquakes in (a) in km. Depths of earthquakes from the EHB and ISC catalogues are marked by small coloured circles and triangles respectively (Engdahl et al. 1998; International Seismological Centre 2017). Note that in the W part of the subduction zone there are many more earthquakes that define the subduction interface (not shown; see Shaw & Jackson 2010), but NE of the Florence Rise, the two earthquakes shown are the only ones with Mw ≥ 5.0 likely to have occurred on the subduction interface. ‘AM’ shows the location of the Anaximander Mountains. Mechanisms are from Jackson & McKenzie (1984), Lyon-Caen et al. (1988), Taymaz et al. (1990), Parke (2001), Benetatos et al. (2004), Pilidou et al. (2004), Shaw & Jackson (2010) and this study.
The clearest evidence for subduction is in the western part of the region, from western Crete to Rhodes, where earthquakes occur in a zone dipping north to a depth of about 150 km, above which lies the Aegean volcanic arc. This is often referred to as the Hellenic subduction zone. Here Nubia is subducted northwards beneath the southern Aegean, and convergence is rapid (40 mm yr−1; see Fig. 1; Reilinger et al. 2006) as a consequence of N–S extension in Greece. This is the best-studied region of convergence in the eastern Mediterranean, and contains a number of features that are relevant to this study as a whole.
Aseismic processes. Since 1900 the release of seismic moment in earthquakes on the part of the Hellenic subduction zone interface (or megathrust) shallower than 40 km accounts for ≲10 per cent of what might be expected if that interface slipped only in earthquakes (e.g. Jackson & McKenzie 1988; Shaw & Jackson 2010). The much longer, though incomplete and imperfect, historical earthquake record of the past 2000–3000 yr confirms that the seismicity in the 20th century is typical of earlier periods, and that there are nowhere near enough large (Mw ≳ 7.5) earthquakes in that longer record to alter the conclusion that most of the convergence is aseismic (e.g. Ambraseys 2009; Shaw & Jackson 2010). GPS observations in the southern Aegean are also consistent with low levels (<20 per cent) of elastic strain accumulation on the subduction interface at depths between 15 and 45 km (Fig. 1; Reilinger et al. 2006; Vernant et al. 2014). It is therefore likely that slip over much of the shallow part of the subduction interface is accommodated by aseismic processes, and that the frequent, though relatively small (Mw < 7.0), earthquakes that do occur rupture small (<25 km-wide) isolated patches that can accumulate elastic strain (Howell et al. 2017).
Earthquake focal mechanisms and faulting. Sufficient earthquakes occur on the subduction interface for their depths and mechanisms to identify that surface’s location (Fig. 2; e.g. Taymaz et al. 1990; Shaw & Jackson 2010). Other earthquakes occur within the downgoing Nubian lithosphere, both seaward of Crete, Karpathos and Rhodes and within the downgoing slab to the north. The P axes of these earthquakes show a clear pattern of along-strike shortening (e.g. Taymaz et al. 1990; Shaw & Jackson 2010). Above the subduction interface, earthquakes seaward of Crete, Karpathos and Rhodes are mostly related to shortening of the overlying sediments. Within and between the islands themselves, shallow earthquakes mostly have normal-faulting focal mechanisms and accommodate arc-parallel extension that is visible using GPS (Nocquet 2012), on-shore geology and off-shore seismic reflection (e.g. Mascle et al. 1982; Papanikolaou et al. 1988; Armijo et al. 1992; Caputo et al. 2010).
Bathymetric escarpments. The subduction interface would project to the sea bed about 100 km south of Crete, but it does not actually do so. Instead it is covered by an accumulation of thickened sediment forming the Mediterranean Ridge, the sediment being material scraped off the subducting Nubian crust and separated from it by décollement horizons (e.g. Chaumillon & Mascle 1997; Chamot-Rooke et al. 2005). This geometry makes clear that prominent linear and deep escarpments like the Hellenic, Pliny and Strabo ‘trenches’ closer to Crete (Fig. 1) are not trenches in the usual oceanic sense of locations where subduction zone interfaces reach the surface, but instead show the locations of faults within the overriding material.
Coastal motions and tsunamigenic earthquakes. Shaw et al. (2008) showed that the timing and distribution of uplifted late-Holocene palæoshorelines on Crete (Fig. 1) are consistent with coseismic uplift during a large (Mw ∼ 8) earthquake in AD 365, on a reverse fault above the subduction interface that projects to the surface at the 3 km-deep escarpment known as the Hellenic Trench. Uplifted late-Holocene palæoshorelines are also observed on Rhodes (Fig. 1; Gauthier 1979; Pirazzoli et al. 1989), where their presence has been attributed to a large earthquake sometime before 2000 BP (Stiros & Blackman 2013; Howell et al. 2015), probably on a reverse fault that reaches the surface SE of Rhodes at the foot of a steep escarpment bounding the Rhodes Basin (Kontogianni et al. 2002; Howell et al. 2015).
Faulting of this type is the likely origin of rare very large tsunamigenic earthquakes like the AD 365 and AD 1303 events (also Mw ∼ 8; Ambraseys 2009), accounting for a small (<10 per cent) part of the convergence within a subduction zone where the majority (>90 per cent) of convergence occurs by aseismic processes on the subduction interface (Shaw & Jackson 2010). In addition to their significance as a tsunami hazard in the eastern Mediterranean (England et al. 2015), these reverse faults above the subduction interface indicate one way in which the sedimentary cover of the Nubian ocean crust could be thickened rather than being subducted into the mantle. The escarpments of the Pliny and Strabo Trenches may be maintained by reverse faulting in the same manner as the Hellenic Trench, though they have often been assumed to involve strike-slip motion in earlier studies (e.g. McKenzie 1972; Huguen et al. 2001; Özbakır et al. 2013) in spite of little support for that sense of motion in earthquake data (Shaw & Jackson 2010; Özbakır et al. 2013; Howell et al. 2015).
East of Rhodes the situation is less clear than to the west, as convergence rates are slower and there have been fewer recent earthquakes. Running NW from western Cyprus towards the Antalya Basin (S of Turkey; Fig. 1) is a band of deformation associated with a bathymetric feature called the Florence Rise and a NE-dipping zone of earthquakes reaching depths of ∼130 km (Fig. 2; Jackson & McKenzie 1984; Wdowinski et al. 2006). West of Cyprus, the 1996 Mw 6.8 earthquake occurred at 85 km depth (Fig. 2; discussed in detail by Pilidou et al. 2004), so this zone of deeper earthquakes may steepen to the south; however, there are too few other earthquake data to confirm this. GPS measurements show that central Turkey (Anatolia) rotates anticlockwise relative to Eurasia as a largely undeforming block (with < 2 mm yr−1 internal deformation) about a pole in the Nile delta (Reilinger et al. 2006). Deformation along the line of the Florence Rise would then be expected to involve NE–SW shortening between Anatolia and Nubia at rates that decrease from 15–20 mm yr−1 in the north to ∼5 mm yr−1 near Cyprus (Wdowinski et al. 2006; Özbakır et al. 2017). Nonetheless, other authors have assumed it to be principally strike-slip instead (e.g. Woodside et al. 2002; Sellier et al. 2013).
In the E–W section of the zone of convergence between Rhodes and the Antalya Basin the situation is particularly unclear. Convergence takes place at ∼15–20 mm yr−1 between Nubian oceanic crust and western Turkey, which is extending. There are few offshore earthquakes and no evidence of deeper (>50 km) events indicative of a subducting slab; several authors have attributed this absence of deeper seismicity to a tear in the downgoing Nubian plate (e.g. Wortel & Spakman 2000; Berk Biryol et al. 2011; Jolivet et al. 2015; Govers & Fichtner 2016). Previous authors have also suggested that an onshore NE–SW-trending zone of left-lateral strike-slip deformation exists in SW Turkey, called the Fethiye–Burdur Fault Zone (Fig. 1; e.g. Tiryakioğlu et al. 2013; Hall et al. 2014a). Offshore to the south, in the Anaximander Mountains, many bathymetric features and deformed structures are identified in seismic reflection studies. Most of these structures are enigmatic in origin and all of them involve the thick sedimentary cover (Dumont & Woodside 1997; ten Veen et al. 2004; Aksu et al. 2009).
We will discuss the deformation in all these regions, synthesizing our new earthquake source inversions and field observations with published earthquake-source models, GPS velocities, Quaternary geology, geomorphology and reflection-seismic data to develop a kinematic picture of the deformation that is consistent with all of them. A coherent and robust knowledge of the kinematics is a prerequisite for a discussion of the dynamic origin of the deformation (e.g. Özeren & Holt 2010; Özbakır et al. 2013; England et al. 2016). This study will reveal that vertical coastal motions close to the Nubian convergent zone between Crete and Cyprus are influenced by the interplay between: (1) thickening of the material above the subduction interface by shortening and underplating of sediment, which promotes uplift; and (2) extension and crustal thinning of the overriding material, which promotes subsidence.
We will also discuss long-wavelength gravity data, which suggest that many of the observed topographic contrasts in the eastern Mediterranean are supported by mantle convection. Uplift and subsidence due to changes in crustal thickness may be superimposed on longer-wavelength vertical motions associated with this convection, but since the time dependence of the convective pattern in the eastern Mediterranean and its motion relative to Nubia are poorly constrained, it is difficult to determine the contribution of mantle convection to observed rates of present-day vertical coastal motions.
2 METHODS
2.1 Earthquake data
Hypocentral depths from earthquake catalogues based on arrival-time data can be unreliable and are often fixed when inverting for epicentral location (e.g. Engdahl et al. 1998), though some catalogues provide more reliable locations and focal mechanisms than others. When considering earthquakes in the eastern Mediterranean we therefore impose quality controls for depths, locations and mechanisms of earthquakes.
The most reliable depths and mechanisms are obtained through inversion of body waveforms using the procedure discussed below. Where available, we use these depths and mechanisms, and epicentres from the EHB (before 2009; Engdahl et al. 1998) or reviewed ISC catalogues (International Seismological Centre 2017). ISC locations are only available until mid-2014, so for earthquakes since this time we use USGS PDE epicentres. Where body-waveform modelled solutions are not available, we use gCMT mechanisms (Dziewonski et al. 1981; Ekström et al. 2012) and depths from the EHB and ISC catalogues. The relative reliability of these different resources is reviewed by Engdahl et al. (2006).
2.2 Body-waveform modelling of earthquake source parameters
We use the MT5 program (Zwick et al. 1994) and the method of McCaffrey & Abers (1988) and McCaffrey et al. (1991) to invert body-waveform data to obtain focal mechanisms and depths of earthquakes. This technique is now too routine to justify a detailed description. We deconvolve seismograms (from the IRIS DMC) from instrument responses and reconvolve them with the response of a WWSSN 15–100s long-period seismometer. At these periods, earthquakes with Mw ≤ 7.0 can be approximated as a point source (the centroid), and the MT5 program uses a downhill inversion technique to find source parameters that minimise the misfit between observations and synthetic seismograms. This technique, which is discussed elsewhere (e.g. Maggi et al. 2000; Shaw & Jackson 2010; Craig et al. 2014), is capable of determining earthquake centroid depths to within about ± 4 km (e.g. Molnar & Lyon-Caen 1989; Taymaz et al. 1991; Maggi et al. 2000) and can also improve estimates of strike, dip and rake compared to gCMT mechanisms. (Dziewonski et al. 1981; Ekström et al. 2012).
We use the same velocity model as Taymaz et al. (1990) and Shaw & Jackson (2010) for the western part of the Hellenic subduction zone, which is consistent with what is known of the upper crustal structure offshore (e.g. Chaumillon & Mascle 1997; Huguen et al. 2001; Sellier et al. 2013). Estimates of strike, dip and rake are insensitive to the choice of velocity model, and the sensitivity of centroid-depth estimates is also low (Taymaz et al. 1990), since these depend on the average seismic velocities between the centroid and the surface (which generally vary by ≲10 per cent, contributing only 1–2 km to centroid-depth uncertainty). We choose a velocity model that facilitates comparison with earlier waveform-modelled earthquake sources. For shallow earthquakes, the model consists of a layer of sediment 8 km thick (a VP of 4.5 km s−1, a VS of 2.59 km s−1 and a density, ρ, of 2.4 kg m−3) overlying a crustal layer (a VP of 6.5 km s−1, a VS of 3.75 km s−1 and a ρ of 2.86 kg m−3) which contains the earthquake, with a water layer of 1–4 km depth depending on the earthquake location. For earthquakes deeper than ∼40 km, we use a 2-layer velocity model with a 30 km-thick crustal layer (a VP of 6.5 km s−1, a VS of 3.75 km s−1 and a ρ of 2.86 kg m−3) and a mantle layer with a VP of 7.8 km s−1, a VS of 4.5 km s−1 and a ρ of 3.3 kg m−3.
The technique is illustrated in Fig. 3, which shows the fits of synthetic to observed waveforms for a shallow (11 km) Mw 6.1 reverse-faulting earthquake in NW Cyprus in 1995 (Fig. 3a) and an Mw 5.3 earthquake in 2003 in the downgoing Nubian plate NE of the Florence Rise (Fig. 3b). For the deeper earthquake, there is a clear separation between direct arrivals and depth phases, while for the shallower earthquake the observed superposition of these phases in the long-period seismograms is well matched by the computed synthetic seismograms.
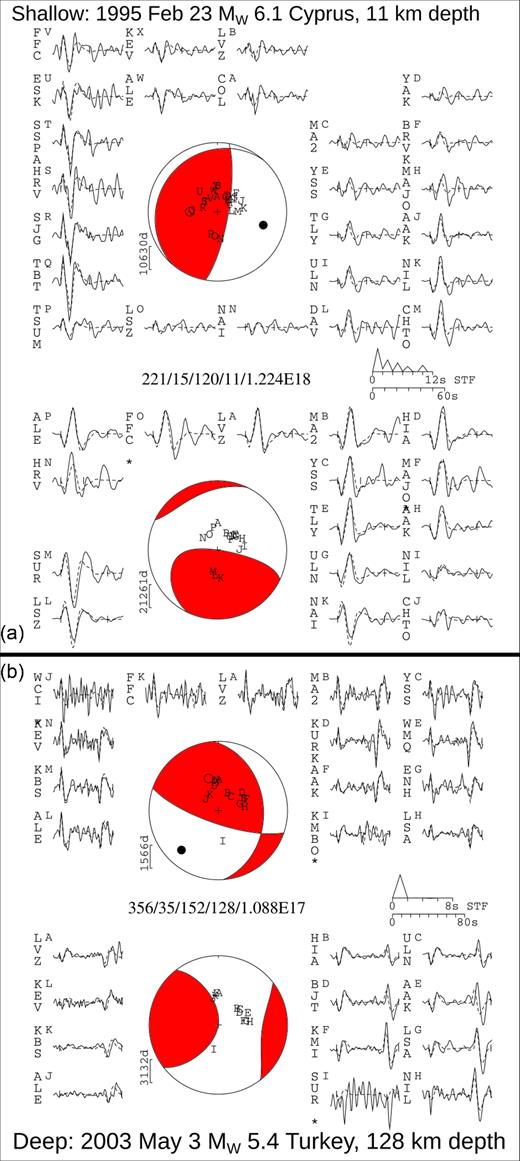
Comparison of observed waveforms to synthetics for example shallow and deep earthquakes. (a) Fit of synthetic (dashed lines) to observed waveforms (solid lines) for an Mw 6.1 reverse-faulting earthquake in Cyprus in 1995, at 11 km depth. (b) Fit of synthetic waveforms to observations for an Mw 5.4 reverse-faulting earthquake at 128 km depth beneath S Turkey in 2003. The event headers (at the centre of each box) show the strike, dip, rake, centroid depth (in km) and scalar seismic moment (in Nm) of the minimum-misfit solution for each earthquake. The top focal sphere in each box shows the lower-hemisphere stereographic projections of the P-waveform nodal planes, and the positions of the seismic stations used in the inversions. The lower panels in each box shows the SH focal spheres. Capital letters next to the station codes correspond to the positions of stations on the focal spheres, ordered clockwise by azimuth, starting at north. The inversion window is marked by vertical lines on each waveform. The source-time function (STF) is shown, with a waveform time scale below it. The amplitude scales for the waveforms are shown below each focal sphere. The P- and T-axes within the P-waveform focal sphere are shown by a solid and an open circle, respectively.
The seismological estimates of source parameters for the earthquakes listed in Table 1 are the primary new data presented in this study, along with our field observations. We will use their depths and mechanisms, along with published geodetic, geological and reflection-seismic data to illuminate the kinematics of the Florence Rise, SW Turkey and the Pliny and Strabo Trenches.
Dates and source parameters of earthquakes in the eastern Mediterranean obtained by inversion of body waveforms. Moment magnitudes (Mw) were calculated using the formula of Hanks & Kanamori (1979). Epicentres are from the EHB catalogue (Engdahl et al. 1998) for earthquakes before 2009 and the ISC catalogue (International Seismological Centre 2017) between 2009 and January 2014. For earthquakes since February 2014 we use USGS PDE epicentres.
| Year | Month | Day | Lon. (°) | Lat. (°) | Depth (km) | Strike (°) | Dip (°) | Rake (°) | Mw | Epicentre |
|---|---|---|---|---|---|---|---|---|---|---|
| 1990 | 07 | 18 | 29.533 | 37.032 | 10 | 96 | 49 | −119 | 5.4 | EHB |
| 1994 | 11 | 13 | 29.058 | 36.946 | 8 | 285 | 48 | −94 | 5.4 | EHB |
| 1995 | 05 | 29 | 32.244 | 35.058 | 15 | 258 | 28 | 150 | 5.2 | EHB |
| 1995 | 02 | 23 | 32.269 | 35.060 | 11 | 221 | 15 | 120 | 5.9 | EHB |
| 2003 | 05 | 03 | 31.514 | 36.898 | 128 | 356 | 35 | 152 | 5.4 | EHB |
| 2005 | 01 | 23 | 29.708 | 35.894 | 34 | 228 | 61 | 0 | 5.7 | EHB |
| 2007 | 10 | 29 | 29.342 | 36.908 | 20 | 275 | 37 | −107 | 5.3 | EHB |
| 2009 | 06 | 19 | 28.4806 | 35.3441 | 36 | 245 | 43 | −64 | 5.8 | ISC |
| 2009 | 07 | 01 | 25.5396 | 34.1472 | 7 | 268 | 23 | 76 | 6.5 | ISC |
| 2009 | 12 | 22 | 31.5347 | 35.7334 | 44 | 313 | 27 | 90 | 5.2 | ISC |
| 2010 | 04 | 24 | 26.0835 | 34.2407 | 8 | 67 | 58 | 66 | 5.4 | ISC |
| 2011 | 04 | 01 | 26.5466 | 35.7317 | 66 | 138 | 69 | 11 | 6.1 | ISC |
| 2012 | 06 | 10 | 28.9676 | 36.3847 | 31 | 201 | 83 | 0 | 6.2 | ISC |
| 2012 | 07 | 09 | 28.9489 | 35.5969 | 51 | 43 | 79 | 2 | 5.7 | ISC |
| 2012 | 09 | 12 | 24.0647 | 34.8285 | 23 | 280 | 19 | 70 | 5.5 | ISC |
| 2013 | 06 | 15 | 25.0440 | 34.4507 | 20 | 284 | 2 | 95 | 6.2 | ISC |
| 2013 | 06 | 16 | 25.1864 | 34.4242 | 18 | 182 | 8 | 343 | 6.0 | ISC |
| 2013 | 12 | 28 | 31.3184 | 36.0497 | 46 | 293 | 28 | 75 | 5.9 | ISC |
| 2015 | 04 | 16 | 26.82 | 35.14 | 20 | 344 | 68 | 103 | 6.1 | PDE |
| 2015 | 06 | 09 | 26.79 | 35.04 | 16 | 23 | 56 | −117 | 5.3 | PDE |
2.3 GPS data
We use the GPS data set of Nocquet (2012), which combines data from many other studies (Clarke et al. 1998; Kahle et al. 2000; McClusky et al. 2000; Reilinger et al. 2006; Aktug et al. 2009; Floyd et al. 2010), and supplement these in SW Turkey with the newer data of Tiryakioğlu et al. (2013). These data are published in a Eurasia-fixed reference frame, but we change the reference frame depending on the region of interest. For example, when investigating Anatolia–Nubia convergence we use a use a Nubia-fixed reference frame, and when considering internal deformation of SW Turkey we use an Anatolia-fixed reference frame. We rotate the velocities into these reference frames using the rotation poles of Reilinger et al. (2006).
In the following sections we investigate faulting in three previously enigmatic regions of convergence in the eastern Mediterranean: the Florence Rise, SW Turkey and the SE Aegean.
3 NUBIA–ANATOLIA MOTION: THE FLORENCE RISE AND ITS RELATIONSHIP TO SUBDUCTION
3.1 Previous work
The Florence Rise is a prominent bathymetric high between Cyprus and SW Turkey, standing 300–800 m above the sediments to its NE and SW (Fig. 1; Sellier et al. 2013). Reflection-seismic data show that there are reverse faults with offsets of hundreds of metres beneath the Florence Rise (Sage & Letouzey 1990) and in the sediments on either side, where there are many folds associated with the presence of Messinian salt (e.g. Woodside et al. 2002; Sellier et al. 2013). There is a high spatial density of faults on the Florence Rise itself; these faults were interpreted as part of a left-lateral strike-slip system by Woodside et al. (2002), who also suggested that some of the bathymetric highs were flower structures, concluding that the structure of the Florence Rise is related to the accommodation of transpressional motion. Sellier et al. (2013) also concluded that motion there is transpressional based on reflection-seismic and multibeam-bathymetry data, but suggested that there has also been significant shortening since the Pliocene. Based on these interpretations and in the absence of seismicity data, reflection-seismic studies in the eastern Mediterranean have generally assumed that deformation at the Florence Rise is dominated by either transform or transpressional motion (e.g. Aksu et al. 2014; Hall et al. 2014a,b).
Conversely, GPS data show that the direction of relative motion between Nubia and both Cyprus and Anatolia is expected to be approximately perpendicular to the strike of the Florence Rise, where faulting should be dominated by shortening (Fig. 2; e.g. Wdowinski et al. 2006; Özbakır et al. 2017). Prior to 2009 there had been very few shallow earthquakes in this region, making it difficult to determine the shape and the location of the Anatolia–Nubia subduction interface and the azimuth of slip on it, and therefore the relative contributions of strike-slip and reverse faulting to deformation around the Florence Rise.
3.2 The 2009 and 2013 earthquakes: slip on the subduction interface
Fig. 4 shows the focal mechanisms and depths of earthquakes in the region NE of the Florence Rise, between Cyprus and SW Turkey. These earthquakes reach depths of ∼130 km and clearly show that the downgoing plate dips to the NE in this part of the subduction zone, with a strike of ∼300° and a dip of ∼30°. The focal mechanisms of two reverse-faulting earthquakes in 2013 and 2009 at ∼45 km depth are marked in red; the best-fitting source parameters for these events are listed in Table 1 and the fits of synthetic to observed waveforms are found in the Supporting Information.
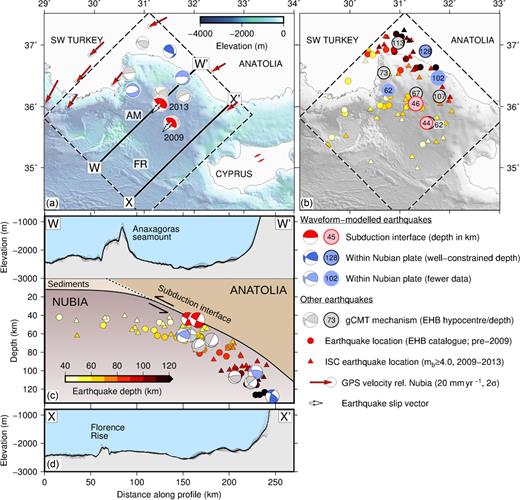
Seismicity of the part of the subduction zone between Cyprus and SW Turkey. (a) Focal mechanisms of earthquakes on the subduction interface (red) and in the downgoing plate in the area bounded by the dashed line. (b) depths of earthquakes in (a) and in the EHB and ISC catalogues (small circles and triangles; Engdahl et al. 1998; International Seismological Centre 2017). (c) Interpreted cross section through the subduction zone, with earthquake mechanisms projected onto the line W–W΄ in (a). Topography is projected from a swath 5 km either side of the line W–W΄, using SRTM15 data (Becker et al. 2009; Sandwell et al. 2014). Focal mechanisms are from Jackson & McKenzie (1984), this study and the gCMT catalogue (Dziewonski et al. 1981; Ekström et al. 2012). (d) Bathymetric profile along the line X–X΄ in (a), projected from a swath 5 km either side of the line. ‘AM’ and ‘FR’ show the locations of the Anaximander Mountains and Florence Rise respectively.
The earthquakes in 2009 (Mw 5.3) and 2013 (Mw 5.9) had waveform-modelled centroid depths of 44 and 45 km respectively. This is close to the maximum depth of earthquakes on the subduction interface in the Hellenic subduction zone (Fig. 2; e.g. Kiratzi & Louvari 2003; Benetatos et al. 2004; Shaw & Jackson 2010; Howell et al. 2017) and in several subduction zones worldwide (e.g. Tichelaar & Ruff 1993; Hayes et al. 2012; Ye et al. 2016). The dip of the NE-dipping nodal planes for both of these events is similar to the dip of the downgoing plate in this region (Fig. 4c) and they occurred close to the upper surface of that plate (defined by earthquake hypocentres in Fig. 4).
The 2009 and 2013 earthquakes are therefore probably the first earthquakes of Mw ≥ 5.0 to have occurred on the subduction interface between Anatolia and Nubia since reliable fault-plane solutions have been available. Their depths and mechanisms allow us to infer several important features of the kinematics of Anatolia–Nubia convergence in this region. First, their slip vectors (arrows on focal mechanisms in Fig. 4a) have the same azimuth as the relative motion between Nubia and Anatolia observed using GPS (Figs 2 and 4). If slip on the subduction interface has the same azimuth as the convergence, strike-slip faulting on faults parallel to the Florence Rise cannot contribute substantially to the accommodation of relative Nubia–Anatolia motion. Comparing these seismological and GPS data gives a more reliable estimate of the contribution of strike-slip faulting to deformation at the Florence Rise than reflection-seismic methods, which cannot easily determine the magnitude of any offset parallel to the strike of a fault, making it hard to reliably identify faults with a strike-slip component of slip.
Second, the NE-dipping fault plane for the 2013 Mw 5.9 earthquake projects to the surface at the base of Anaxagoras seamount (Fig. 4), a peak on the E side of the Anaximander Mountains, along strike from the Florence Rise. If, as seems likely, the 2009 and 2013 earthquakes ruptured the subduction interface, then the bathymetry of the Florence Rise and the NW–SE trending escarpments in the eastern Anaximander Mountains, such as Anaxagoras seamount (Figs 4a and c), are likely to represent deformation of sediments at the surface projection of the subduction interface; this would be consistent with the presence of several large reverse faults imaged using reflection-seismic methods (Fig. 5; Aksu et al. 2009).
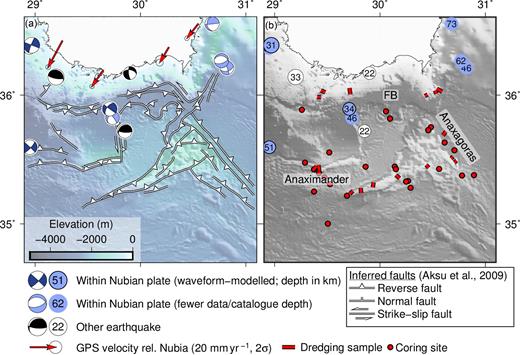
Kinematics of the Anaximander Mountains. (a) Reverse, strike-slip and normal faults inferred from reflection-seismic data by Aksu et al. (2009) (marked in white), bathymetry (SRTM15; Becker et al. 2009; Sandwell et al. 2014) and focal mechanisms of earthquakes from the gCMT catalogue (Dziewonski et al. 1981; Ekström et al. 2012), McKenzie (1978a), Jackson & McKenzie (1984), Kiratzi & Louvari (2003) and this study. Mechanisms are from the gCMT catalogue except for the dark blue earthquakes and the two reverse-faulting earthquakes marked in black (see text). (b) Depths of earthquakes in (a) and dredging and coring locations from the ANAXIPROBE cruise (Dumont & Woodside 1997). Centroid depths for the earthquakes marked in dark blue and the southernmost of the two black reverse-faulting earthquakes were estimated using body-waveform modelling (this study and Kiratzi & Louvari 2003). Otherwise, hypocentres and depths are from the EHB catalogue (Engdahl et al. 1998) for earthquakes prior to 2009, the reviewed ISC catalogue (International Seismological Centre 2017) for earthquakes between 2009 and 2013. USGS PDE depths and hypocentres are used for earthquakes since 2014. ‘FB’ shows the location of the Finike Basin.
The GPS data showing that Anatolia (central Turkey) is rotating anticlockwise relative to Nubia (Reilinger et al. 2006; DeMets et al. 2015) also indicate that the expected rate of convergence between Nubia and the overriding material decreases along the line of the Florence Rise from ∼15 mm yr−1 close to the Anaximander Mountains to ∼5 mm yr−1 near Cyprus. The greater depth of earthquakes at the NW end of this NW–SE deformation zone is also consistent with this expectation from GPS. Subducted slabs are thought to remain seismically active for 10–12 Myr (e.g. Isacks et al. 1968; McKenzie 1969; Wortel 1986), probably because after this time the potential temperature of the slab interior reaches ∼600°C and it begins to deform aseismically (Emmerson & McKenzie 2007). If the deepest earthquakes in the Nubian slab mark the point where this transition occurs and their locations correspond to parts of the slab that were at the surface 10–12 Myr ago, that would require an average convergence rate of ∼15–20 mm yr−1, which is similar to the present-day rate estimated using GPS data. This agreement could be interpreted to suggest that the rate of Nubia–Anatolia convergence has remained roughly constant for 10 Myr.
If the elevations of the Florence Rise and the eastern Anaximander Mountains above the surrounding seafloor are the result of deformation of sediments related to convergence, the greater bathymetric relief in the NW relative to the SE is also consistent with the along-strike variation in rate of convergence. We suggest that all the major observable features of the bathymetry and seismicity along the line of the Florence Rise between Cyprus and Antalya are consistent with the NE–SW convergence between Nubia and Anatolia suggested by GPS measurements (Figs 2 and 4; e.g. Reilinger et al. 2006). This interpretation of the Florence Rise as thickened sediments at the surface projection of the subduction interface is consistent with the reflection-seismic observations of Sellier et al. (2013), who noted similarities between the deformational styles at the Florence Rise and at the Mediterranean Ridge, where the Hellenic subduction zone interface projects to the surface S of Crete.
4 NUBIA–SW TURKEY MOTION: RHODES TO ANTALYA
GPS observations in a Nubia–fixed reference frame indicate that, near the coastline between Antalya and Rhodes, Nubia converges with the rapidly-deforming SW Turkey at ∼10–20 mm yr−1 in an NE–SW direction. This orientation results from the combination of the Nubia–Eurasia convergence (azimuth 330°–350°, rate 6–10 mm yr−1) with a southwards motion of SW Turkey with respect to Eurasia. To the east, Nubia–Anatolia convergence has produced an NE-dipping subducting slab with surface deformation apparently localised near the Florence Rise (Section 3). To the west, between Rhodes and Crete, another clear seismically-active subducting slab dips NW (e.g. Papazachos et al. 2000). By contrast, between Rhodes and Antalya there is no identifiable dipping seismic zone, there are no earthquakes with reliable depths > 50 km, and very few offshore fault-plane solutions to guide an interpretation of the deformation. Young offshore structures in this region trend mostly E–W. Understanding the Nubian–Turkey motions in this region requires investigation of both onshore and offshore faulting, which we now consider.
4.1 Offshore structure and earthquakes
Fig. 5 shows the bathymetry and seismicity of the offshore E–W trending Anaximander Mountains, culminating in the Anaxagoras peak in the east. Also shown are the locations of inferred faults from the reflection-seismic study of Aksu et al. (2009) and GPS velocities relative to Nubia. All GPS velocities are to the SW, which is perpendicular to the strike of the Florence Rise and the reverse faults in the eastern Anaximander Mountains. In the west, Turkey–Nubia convergence is oblique to the predominantly E–W structures offshore, which may therefore include a strike-slip component of motion, but this is difficult to confirm using reflection-seismic data.
Most of the earthquakes in this region with well-constrained depths occurred within the downgoing Nubian plate, so do not directly accommodate Turkey–Nubia convergence or the observed shortening in the Anaximander Mountains. There are two reverse-faulting earthquakes marked in black in Fig. 5(a), which could possibly have occurred on a subduction interface. However, the earthquake to the NW occurred in 1969 and its mechanism (from first motions; McKenzie 1978a) and depth (from the EHB catalogue) are both poorly constrained. Body waveforms from the southern of the two earthquakes have been modelled (Kiratzi & Louvari 2003), but there are too few data to accurately constrain its apparent depth of 22 km. Both may have occurred within the downgoing plate, rather than on or above the subduction interface. If they were on the interface, their N–S slip vectors would be oblique to the GPS convergence direction, in which case a strike-slip component of convergence would have to be taken up elsewhere.
Dredging and coring during the ANAXIPROBE cruise (sites are marked in red in Fig. 5b; Dumont & Woodside 1997) found clasts of shallow-marine Eocene limestone in mud volcanoes south of Anaxagoras Seamount (30.5°, 35.5°). ten Veen et al. (2004) correlated these with units onshore in SW Turkey, suggesting that the Anaximander Mountains share some of the geological history of SW Turkey. The recent shortening of the mountains is presumably related to convergence between Nubia and SW Turkey. However, their submergence from initially shallow-marine depths, which may have occurred since the Messinian (Hall et al. 2009; Aksu et al. 2014), may be related to earlier subsidence like that presently observed onshore in SW Turkey, which is probably partly due to crustal extension but may also be related to the generation of topography by mantle convection (as we will discuss later). We now describe the evidence for this onshore extension and subsidence.
4.2 Onshore faulting and seismicity
Fig. 6(b) shows a compilation of focal mechanisms of earthquakes onshore in SW Turkey from the gCMT catalogue (Dziewonski et al. 1981; Ekström et al. 2012), body-waveform modelling (Taymaz & Price 1992; Braunmiller & Nábělek 1996; Wright et al. 1999; Kiratzi & Louvari 2003; Yolsal-Çevikbilen et al. 2014, and this study) and first-motion data (McKenzie 1972; Taymaz & Price 1992), with slip vectors marked by white arrows where focal mechanisms are well constrained by body-waveform modelling. These earthquakes all have normal-faulting mechanisms; none are strike-slip, and very few are oblique. Studies of smaller earthquakes are also consistent with predominantly extensional recent onshore seismicity (Över et al. 2010, 2016). Offshore, earthquakes with strike-slip focal mechanisms have occurred in the Rhodes Basin (Fig. 2), but have poorly-constrained depths or well-constrained depths that place them in the downgoing Nubian plate. There is no requirement that faulting within the downgoing plate and at the surface should be the same (e.g. Isacks & Molnar 1971), so there is no evidence for shallow strike-slip faulting from the recent seismicity of SW Turkey.
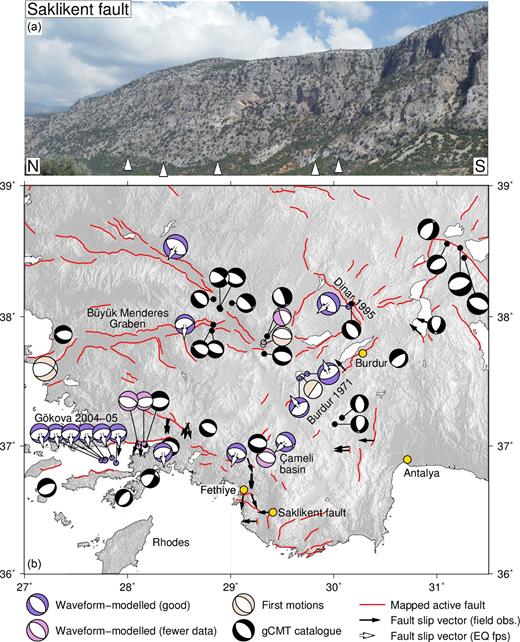
Pliocene–Quaternary and recent seismicity of SW Turkey. (a) Quaternary fault scarp of the Saklıkent Fault, marked by white triangles. (b) Focal mechanisms of earthquakes, colour-coded by data quality. Blue focal mechanisms show earthquakes for which the depths and mechanisms are well constrained by body-waveform modelling and pink focal mechanisms show earthquakes with poorly constrained depths and mechanisms (Taymaz & Price 1992; Taymaz 1993; Braunmiller & Nábělek 1996; Wright et al. 1999; Kiratzi & Louvari 2003; Yolsal-Çevikbilen et al. 2014, and this study). Beige focal mechanisms show first-motion solutions from McKenzie (1972, 1978a). Active faults from the catalogue of Şaroğlu et al. (1992) and our own fieldwork are marked in red. Black arrows show slip-vector azimuths measured during fieldwork from fault striations and white arrows show possible slip-vector azimuths for earthquakes with well-constrained focal mechanisms; both show motion of the W side of the fault relative to the E side or the S side relative to the N side. Topography is SRTM-3 (Farr et al. 2007). In the figure legend, ‘fault-plane solutions’ is abbreviated to ‘fps’.
Major mapped normal faults from the Active Fault Map of Turkey (Şaroğlu et al. 1992; Emre et al. 2016) and our own fieldwork are marked by red lines in Fig. 6, and azimuths of slip vectors on Pliocene–Quaternary fault planes measured during our fieldwork are marked by black arrows. Our fault map is less detailed than those of Elitez et al. (2016) or Alçiçek et al. (2006) in some areas, but shares the same broad-scale features; our field measurements of slip vectors are also consistent with previous studies (e.g. ten Veen 2004; Alçiçek et al. 2006).
Most of the major mapped faults are normal faults like the Saklıkent fault (Fig. 6a) which dominate the topography, and although a few strike-slip striations have been observed on faults of unknown age or along-strike extent (e.g. ten Veen 2004; Karabacak 2011; Elitez et al. 2016), no reliable offsets or slip-rates associated with strike-slip faults have been determined. Like many authors who have worked on the region, we conclude that the recent seismicity and Pliocene–Quaternary faulting of SW Turkey are both dominated by pure dip-slip normal faulting on faults with a great variety of strikes (faults with E–W, NW–SE, NE–SW and N–S strikes are shown in Fig. 6). As we will show later, this unusual variety of strike directions in the same region is itself significant.
4.3 GPS in SW Turkey
4.3.1 The Fethiye–Burdur Fault Zone: does it really exist?
Strike-slip deformation in SW Turkey has often been inferred to explain an observed gradient in GPS velocities from SE to NW (Fig. 7; e.g. Barka & Reilinger 1997; Reilinger et al. 2006; Tiryakioğlu et al. 2013). This velocity gradient is especially pronounced when velocities are presented in a Eurasia-fixed reference frame (Fig. 7a) because of the overall rotation of Turkey (Anatolia) relative to Eurasia about a pole S of Cyprus. However, it is much less obvious after this rotation has been removed, particularly in the Fethiye–Burdur region (Fig. 7b). Most GPS-based studies of the region have used a block-modelling approach to assess its kinematics, and several of them have specified a block boundary that runs SW–NE through SW Turkey (generally referred to as the Fethiye–Burdur Fault Zone or FBFZ; e.g. Eyidoğan & Barka 1996; Barka & Reilinger 1997), with the region to the S of this often modelled as a rigid block (e.g. Reilinger et al. 2006; Tiryakioğlu et al. 2013). Inverting for fault slip rates in a model with this fault geometry yields a solution with left-lateral slip on this inferred Fethiye–Burdur Fault Zone (e.g. Reilinger et al. 2006; Tiryakioğlu et al. 2013). However, the existence of a localized boundary with this slip sense is clearly inconsistent with the observed faulting and seismicity in Fig. 6.
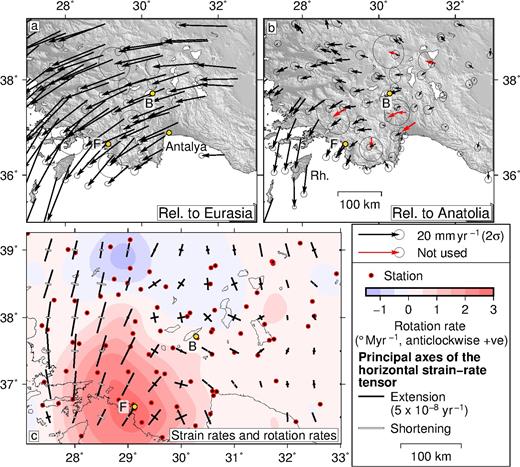
GPS-derived strain-rate and rotation-rate fields for SW Turkey. (a) GPS velocities relative to Eurasia from Aktug et al. (2009). (b) GPS velocities in the Anatolia-fixed reference frame of Tiryakioğlu et al. (2013), with the data of Aktug et al. (2009) rotated into the same reference frame. Red arrows mark sites for which velocities were not used to calculate the velocity-gradient field because of anomalous velocities compared to adjacent sites or very large uncertainties. (c) Rotation rates (anticlockwise positive) and principal horizontal strain rates calculated from the velocity-gradient field. ‘F’ and ‘B’ show the locations of Fethiye and Burdur.
Another reason for the inferred existence of the Fethiye–Burdur Fault Zone is that offshore and to the SW, the region of the Pliny and Strabo trenches (Fig. 1) is often interpreted as a system of left-lateral transform faults (e.g. Özbakır et al. 2013; Hall et al. 2014a), and the Fethiye–Burdur Fault Zone is seen as its natural along-strike continuation. Hall et al. (2014a) and Elitez et al. (2016) have suggested that the Fethiye–Burdur fault zone is a shear zone above a tear in the downgoing plate (like that suggested by Govers & Fichtner 2016), but that rather than being accommodated on strike-slip faults much of the left-lateral shear is accommodated by oblique normal faulting. How much oblique slip has occurred on Pliocene–Quaternary faults in SW Turkey is controversial (Hall et al. 2014a, and comment), but most studies and all the observed slip-vector azimuths and fault-plane solutions in Fig. 6 suggest that slip on these faults is generally dip-slip rather than oblique (e.g. Alçiçek et al. 2006; ten Veen et al. 2009; Över et al. 2016).
We do not believe that a localized or concentrated band of NE–SW left-lateral shear exists along the line of the supposed Fethiye–Burdur Fault Zone. Below, we offer an interpretation of the GPS velocity field that is consistent with observed faulting, slip-vector azimuths and fault-plane solutions of earthquakes. An essential feature of this new interpretation is that faulting is spatially distributed, and occurs on normal faults with a variety of strikes.
4.3.2 Treatment of data and choice of reference frames
Tiryakioğlu et al. (2013) published new and updated velocities for 39 sites in SW Turkey. Like them, we supplement these data with the data set of Aktug et al. (2009) shown in a Eurasia-fixed reference frame in Fig. 7(a), which includes the data of Reilinger et al. (2006).
Although the published data of Tiryakioğlu et al. (2013) and Aktug et al. (2009) supposedly both share the Eurasia-fixed reference frame of Reilinger et al. (2006), there are consistent differences of 2–4 mm yr−1 at the 17 stations present in both data sets. We reconcile the two reference frames by finding a rotation about an Euler pole that minimizes these differences in velocity, and rotate the velocities of Aktug et al. (2009) into the reference frame used by Tiryakioğlu et al. (2013).
Our main interest is in the internal deformation of SW Turkey, including relative rotations, so we prefer to use a reference frame for which differences in velocity associated with the rotation of Anatolia relative to Eurasia are not present. We therefore rotate velocities into the Anatolia-fixed reference frame of Tiryakioğlu et al. (2013), using the pole of Reilinger et al. (2006). Although strain rates derived from a velocity field are independent of the choice of reference frame, using this reference frame allows us to examine rotation rates associated with faulting in SW Turkey.
4.3.3 The strain-rate field in SW Turkey
Fig. 7(c) shows principal axes of the horizontal strain-rate tensor and rotation rates, derived using a tension factor of 1 and a diameter of the Gaussian filter of 150 km. There are four principal features of the strain-rate field, all of which are consistent with the seismicity data:
Strain rates increase from E to W. This finding is not surprising given the higher rates of seismicity observed in the west (e.g. Yolsal-Çevikbilen et al. 2014), accompanied by the enhanced topographic expressions of major graben systems such as the Büyük Menderes graben (Fig. 6) along the Aegean coast of Turkey.
The strain-rate field in the centre of Fig. 7(c) shows two extensional principal axes of the horizontal strain-rate tensor indicating extension in more than one direction. This result is consistent with earthquake and fault slip-vector observations but not with previous interpretations of the Fethiye–Burdur Fault Zone as a strike-slip shear zone.
Strain rates in the W are dominated by N–S extension. This is consistent with the presence of the E–W normal faults that dominate in this region.
No part of SW Turkey is undergoing significant horizontal shortening in any direction. For significant strike-slip faulting to occur, the horizontal strain-rate tensor would be expected to have extensional and shortening principal axes of roughly equal magnitude.
Rotation rates relative to Anatolia are small everywhere in SW Turkey except close to the coast, near Fethiye, where there is 2°–3° Myr−1 of anticlockwise rotation. We discuss this and its relationship to faulting later.
4.3.4 Horizontal extension, crustal thinning and subsidence
We assume that tl = 106 km, α = 3 × 10⁻⁵K−1 and T1 = 1315 °C (after McKenzie et al. 2005). In SW Turkey, strain rates calculated from the velocity field in Fig. 7 are typically 6–7 × 10⁻⁸ yr−1, and estimates of Moho depth from receiver functions suggest that tc is 30–35 km (Vanacore et al. 2013). Assuming values for ρ0, ρc and ρw of 3300, 2700 and 1000 kg m−3 respectively, these strain rates and values of tc correspond to average subsidence rates for the region of 0.2–0.4 mm yr−1. We now compare this estimated rate with observed rates of late-Holocene subsidence in SW Turkey.
4.3.5 Geomorphological and archaeological evidence of subsidence in SW Turkey
Geomorphological indicators such as drowned valleys, a sinuous coastline, a scarcity of beaches (Fig. 8) and the presence of tilted deltaic sequences in offshore sediments all suggest subsidence of the coast of Turkey between 28°E and 31°E during the late Quaternary (Fig. 8; e.g. Flemming 1978; Hall et al. 2009; Anzidei et al. 2011; Kızıldağ et al. 2012; Özdaş & Kızıldağ 2013; Yildiz et al. 2013; Aksu et al. 2014; Tur et al. 2015).
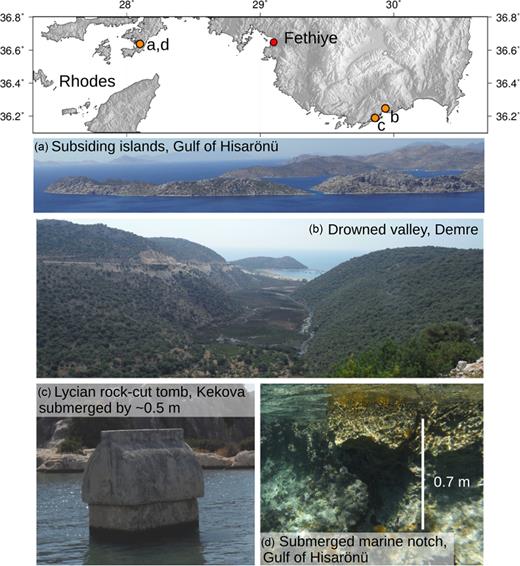
Geomorphological and archaeological evidence for subsidence of SW Turkey. Top panel: locations of sites. (a) Islands in the Gulf of Hisarönü with a coastal morphology that suggests they are subsiding. (b) A drowned valley W of Demre. (c) Lycian rock-cut tomb (∼2300 yr old; Anzidei et al. 2011), with its base at ∼0.5 m below present-day mean sea level. (d) Submerged marine notch in the Gulf of Hisarönü; this probably formed at sea level but its base is now ∼0.7 m below sea level.
Global sea level appears to have been relatively stable over the past 5000–6000 yr (e.g. Siddall et al. 2003; Lambeck et al. 2014), so an approximate subsidence rate can be estimated from the depth of an indicator below present-day sea level divided by its age (some authors also correct for a small late-Holocene sea-level rise predicted by some models of glacial isostatic adjustment; Anzidei et al. 2011). Rates of subsidence are poorly constrained, but archaeological data and the depths of submerged marine notches have been used to estimate rates of late-Holocene subsidence (Flemming 1978; Anzidei et al. 2011; Kızıldağ et al. 2012; Özdaş & Kızıldağ 2013).
Minimum rates of subsidence calculated using archaeological data range from 0.1–0.3 mm yr−1 to > 2 mm yr−1. (Flemming 1978; Anzidei et al. 2011; Kızıldağ et al. 2012; Özdaş & Kızıldağ 2013) and are therefore consistent with our estimated average instantaneous subsidence rate of 0.2–0.4 mm yr−1. Local rates of subsidence faster than this average regional rate (up to ∼2.7 mm yr−1; Anzidei et al. 2011) are observed and would be expected, as the average rate does not account for local subsidence in the hanging walls of normal faults, for loading related to sedimentation in deltas, or for late-Holocene relative sea-level rise associated with glacial isostatic adjustment.
However, in addition to these processes (all of which would contribute to late-Holocene subsidence), several authors have suggested that the topography of SW Turkey is partly supported by mantle convection (e.g. Gessner et al. 2013; Schildgen et al. 2014; Uluocak et al. 2016). It is possible that this mantle convection contributes to present-day vertical coastal motions, in which case any subsidence or uplift related to changes in crustal thickness would be superimposed on longer-wavelength vertical motions caused by mantle convection. In Section 6.2, we will use gravity data to show that mantle convection could cause subsidence of ∼0.3–2.0 mm yr−1 (i.e. at a similar rate to that calculated and observed above), depending on upper mantle viscosity. These estimates suggest that the contribution of mantle convection to observed coastal subsidence in SW Turkey may be at least as great as that of extension and crustal thinning. We therefore conclude that while extension and associated crustal thinning may contribute significantly to the observed subsidence of SW Turkey, it is unlikely to be the only process responsible.
4.4 Relationship between the deformation field and faulting
In Section 4.3 we showed that the strain-rate field in SW Turkey is predominantly extensional, with horizontal extension in two directions in some areas and one direction in others. We now consider possible configurations of faulting that can accommodate the observed strain-rate field and examine whether there is likely to be any significant strike-slip faulting in SW Turkey.
4.4.1 Divergence, shear and fault sets
First, we consider the possible configurations of faults that could accommodate the observed strain-rate field shown in Fig. 7(c), which is dominated by N–S extension in the west (along the Aegean coast), but with two extensional principal axes of the horizontal strain-rate tensor further east near Burdur.
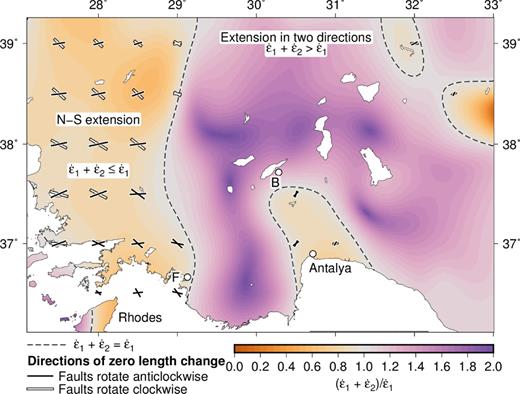
Horizontal divergence rates for SW Turkey calculated from the strain rates in Fig. 7(c) using eq. (4). See Section 4.3 for details. In regions where the strain-rate field can be accommodated by uniform slip on faults of a single strike, possible orientations of faults (directions of zero-length-change calculated using eq. 5) are shown by black and white bars. Faults marked by black bars would be expected to rotate anticlockwise in the observed velocity field and have a left-lateral component of strike-slip motion. Faults of the orientations marked by white bars would rotate clockwise and have some right-lateral slip. The lines marking directions of zero length change are scaled by the second invariant of the strain-rate tensor (|$\sqrt{\dot{\varepsilon }^2_1 + \dot{\varepsilon }^2_2}$|), with the bars in the key corresponding to a value for the second invariant of 10−7 yr−1. Note that the colour scale is designed to show the robustness of the result that |$\Delta \dot{A}_n > 1$| rather than the magnitudes of the strain rates themselves, which are shown by the length of the principal axes of the horizontal strain-rate tensor in Fig. 7(c).
Positive strain rates are extensional (black bars in Fig. 7c) and negative strain rates are compressional (white bars in Fig. 7c). Over the whole of Fig. 9, |$\dot{\varepsilon }_{1}$| is extensional (positive), so we frame the following discussion in terms of extension.
For the case of extension in a single direction achieved by pure normal faulting, |$\dot{\varepsilon }_{1}$| would be perpendicular to the strike of the fault, and |$\dot{\varepsilon }_{2}$| (parallel to the strike of the fault) would be zero. Assuming that volume is conserved, the horizontal extension is balanced by vertical shortening (crustal thinning) and |$\Delta {}\dot{A}_n =1$|.
If |$\dot{\varepsilon }_{2}$| is also extensional (|$\dot{\varepsilon }_{1} + \dot{\varepsilon }_{2} \ge \dot{\varepsilon }_{1}$|), there is horizontal extension in the direction perpendicular to |$\dot{\varepsilon }_{1}$| and therefore a component of horizontal extension in all directions. Since slip on a fault cannot accommodate length changes in the direction parallel to its strike, a strain-rate field where |$\dot{\varepsilon }_{1}$| and |$\dot{\varepsilon }_{2}$| are both extensional (such as that N and S of Burdur in Fig. 7c) will have a value of |$\Delta {}\dot{A}_n > 1$| and cannot be accommodated on faults of a single strike, so that additional faults with a different strike are required to accommodate the strain-rate field. Note that N and S of Burdur in Figs 7(c) and 9, |$\Delta {}\dot{A}_n$| is ≈2 because |$\dot{\varepsilon }_{1} \approx \dot{\varepsilon }_{2}$|, and exceeds a value of |$\Delta {}\dot{A}_n=1$| by a margin greater than any error or uncertainty resulting from the accuracy of the GPS data. This is therefore a robust result.
By contrast, horizontal strain-rate fields for which |$\dot{\varepsilon }_{1}$| and |$\dot{\varepsilon }_{2}$| have opposite signs (like the one along the Aegean coast of Turkey; Fig. 7c), where |$\Delta {}\dot{A}_n \le 1$|, can be accommodated on faults of a single strike (see also Jackson et al. 1992; Holt & Haines 1993). For example, for pure strike-slip faulting, |$\dot{\varepsilon }_{1} + \dot{\varepsilon }_{2}=0$| and the strain-rate field can be accommodated by slip on one or more faults of a single orientation.
The W coast of Turkey (where |$\Delta {}\dot{A}_n < 1$|) is dominated by E–W grabens and normal faults striking perpendicular to |$\dot{\varepsilon }_{1}$|, whereas around Burdur (|$\Delta {}\dot{A}_n > 1$|) the normal faults have a variety of different strikes, so the expectations of our analysis of the strain-rate field are consistent with observations of seismicity and Pliocene–Quaternary faulting. This analysis demonstrates that a single left-lateral strike-slip fault zone between Burdur and Fethiye, or even a single set of sub-parallel faults, cannot accommodate the strain-rate field revealed by GPS. Instead, it is likely that in this region, the horizontal strain-rate field is accommodated by NW–SE and NE–SW extension on the approximately orthogonal sets of normal faults shown in Fig. 6.
4.4.2 Orientations and rotations of faults in W Turkey predicted from GPS observations
The directions of zero-length change for the strain-rate field in Fig. 7(c) are marked by the black and white bars in Fig. 9. In the region in orange, most faults are predicted to have an approximately E–W or NW–SE strike, which is consistent with the observed strikes of faults in SW Turkey (Fig. 6). By contrast, for the region in purple in Fig. 9, there are no directions of zero-length-change for the reasons described above.
Palæomagnetic estimates of Neogene rates of rotation in SW Turkey also suggest that there have been modest anticlockwise rotations, but since there are few Pliocene–Quaternary data, most estimates are of average rotations since the early–middle Miocene and are all small (≲ 20°; Laj et al. 1982; Kissel & Laj 1988; van Hinsbergen et al. 2010). A large part of this ambiguous signal may be associated with the bulk anticlockwise rotation of Anatolia, at up to ∼3° Myr−1 (e.g. McKenzie 1978a; Şengor 1979; Allmendinger et al. 2007).
5 NUBIA–AEGEAN CONVERGENCE: THE SE HELLENIC SUBDUCTION ZONE
In Section 4.3, we considered the relationships between convergence, faulting and vertical motions onshore in SW Turkey and in the offshore Anaximander Mountains. We now discuss the same relationships for the region immediately SW of Fethiye, in the part of the Hellenic subduction zone between Crete and Rhodes (Fig. 1).
SW of Fethiye are the prominent Pliny and Strabo Trenches, at the eastern end of the Hellenic subduction zone (Figs 1 and 10). These trenches and the inferred Fethiye–Burdur Fault Zone have frequently been interpreted as linked left-lateral strike-slip shear zones (e.g. Ocakoğlu 2011; Hall et al. 2014b). Since we have concluded that strike-slip faulting in the Fethiye–Burdur region is unlikely to contribute significantly to deformation in SW Turkey, it is appropriate to assess its significance in the Pliny and Strabo trenches, and to investigate how Aegean–Nubia convergence is accommodated there.
Seismicity around the Pliny and Strabo trenches. (a) Focal mechanisms of earthquakes with Mw ≥ 5.3 and the quality of their mechanism. Earthquakes judged on the basis of depth to have occurred in the downgoing plate are shown in blue. (b) Centroid depths of earthquakes in (a). (c) Focal mechanisms of earthquakes with Mw < 5.3, colour-coded on the basis of depth. (d) Mechanisms of earthquakes with Mw ≥ 5.3 and well-constrained shallow depths or poorly-constrained depths, their slip vectors and our interpretation of their tectonic role. Slip vectors show the direction of motion of the N side of the fault relative to the S side or the E side relative to the W side (for the shallow plane for reverse-faulting earthquakes and both planes for other earthquakes). Selected GPS velocities relative to Nubia are shown by red arrows. Hypocentres are from the EHB catalogue before 2009 and the reviewed ISC catalogue from 2009 to January 2014; after January 2014 we use USGS PDE hypocentres. (e) Bathymetric profile along the line Y–Y΄, with points projected onto the line from 5 km either side. Bathymetry is SRTM15.
5.1 Interpretations of the Pliny and Strabo trenches as strike-slip shear zones
The Pliny and Strabo trenches were first interpreted as a system of transform faults by McKenzie (1978a), based on simple kinematic models and the strike-slip mechanisms of the 1957 earthquakes E of Rhodes (Fig. 10d). Early reflection-seismic studies also concluded that the structure of the trenches is consistent with strike-slip deformation based on the presence of narrow, en échelon troughs nearby (e.g. Jongsma 1977; Le Pichon et al. 1979; Mascle et al. 1982, 1986). GPS data show that relative motion between the Aegean and Nubia in the region of the trenches is oblique (∼45°) to their strike (Fig. 1; e.g. Reilinger et al. 2006), so convergence in this part of the subduction zone must have both trench-perpendicular and trench-parallel components.
More recent seismic-reflection studies have mostly inferred strike-slip or transpressional motion in the general Pliny–Strabo region, with Huguen et al. (2001, 2006) also identifying the same en échelon troughs in swath bathymetry data and Hall et al. (2009, 2014b) identifying structures in the Rhodes Basin as possible flower structures. However, it is difficult to identify strike-slip faults unambiguously using reflection-seismic methods, and it is possible that dip-slip faulting could contribute to the formation of the en échelon troughs and the main escarpments in the Pliny and Strabo Trenches, across which there is up to 2 km of bathymetric relief (Fig. 10e).
Unusually for a region interpreted as a strike-slip or transpressional shear zone, relatively few earthquakes around the Pliny and Strabo trenches have strike-slip focal mechanisms, and many have reverse-faulting or oblique-normal mechanisms (Fig. 10; e.g. Shaw & Jackson 2010). Özbakır et al. (2013) interpreted the observed diversity in focal mechanisms in terms of Riedel shears above a transform fault, but that interpretation does not account for the significant component of Aegean–Nubia motion in the direction perpendicular to the strike of the trenches.
We now use our updated and improved set of earthquake focal mechanisms to examine how oblique convergence across the Pliny and Strabo Trenches is accommodated.
5.1.1 Seismicity around the Pliny and Strabo Trenches
Earthquakes in the region of the Pliny and Strabo Trenches could accommodate: (1) deformation of the downgoing Nubian plate; (2) slip on the Aegean–Nubia subduction interface; and (3) deformation of the overriding Aegean material. Focal mechanisms for earthquakes with Mw ≥ 5.3 and our interpretations of the tectonic role of each earthquake are shown in Figs 10(a), (b) and (d).
The patterns of mechanisms of earthquakes with Mw < 5.3 are similar to those of larger earthquakes (Fig. 10c), but we discount earthquakes below Mw 5.3 (the magnitude of our smallest body-waveform modelled events) from our analysis for two reasons. Firstly, their depths are often poorly constrained, so that it is often difficult to tell whether an earthquake occurred in the downgoing plate, on the subduction interface or within the overriding material. Secondly, smaller earthquakes contribute a very minor amount of the total seismic moment, and their mechanisms may be less representative of the overall kinematics (Brune 1968).
We also exclude earthquakes with body-waveform modelled depths that place them within the downgoing Nubian plate (marked in blue in Fig. 10a) from our analysis, since these earthquakes probably accommodate arc-parallel shortening of the downgoing plate rather than Aegean–Nubia convergence. Earthquakes with Mw ≥ 5.3 and either poorly-constrained depths or well-constrained shallow depths are shown in Fig. 10(d). Of these, the only earthquakes with strike-slip mechanisms are the 1957 earthquakes E of Rhodes, which have poorly-constrained depths and mechanisms, and may have occurred within the downgoing plate. The remaining earthquakes in Fig. 10(d) have reverse-faulting and normal or oblique-normal mechanisms.
Most of the normal-faulting earthquakes in Fig. 10(d) (coloured yellow) have one possible slip-vector azimuth that is parallel to the strike of the trenches. Their occurrence may be unrelated to accommodation of convergence if they accommodate arc-parallel extension, which is observed close to the subduction zone in faulting on land and offshore and in GPS velocities (Fig. 11; e.g. Mascle et al. 1982; Armijo et al. 1992; Caputo et al. 2010; Nocquet 2012). However, their trench-parallel slip-vector azimuths are also consistent with a left-lateral component of motion and could therefore also accommodate the trench-parallel component of the oblique convergence between Karpathos and Nubia if there is slip partitioning in this region (Fitch 1972; McCaffrey 1996). In that case, the trench-perpendicular component of convergence could be accommodated either on the subduction interface or on reverse faults that project to the surface in the Pliny or Strabo Trenches (Shaw & Jackson 2010; England et al. 2015; Howell et al. 2015).
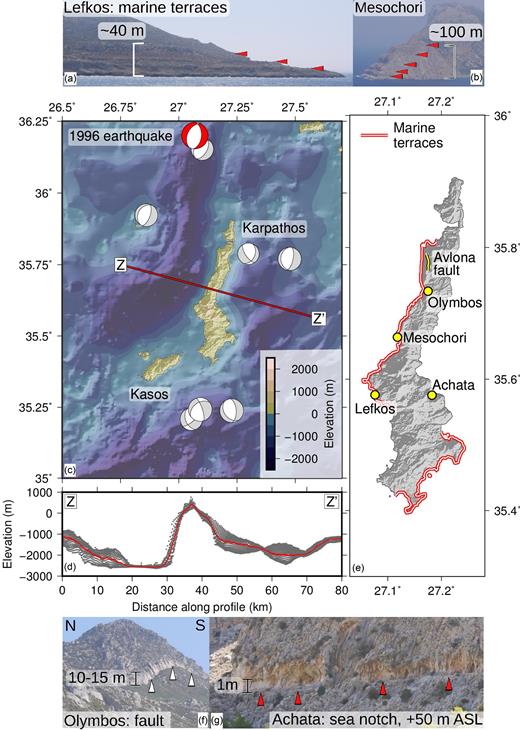
Normal faulting around Karpathos. (a,b) Flights of Pliocene–Quaternary marine terraces at sites on the W side of Karpathos in the footwall of an inferred offshore normal fault. (c) Bathymetry and focal mechanisms of shallow earthquakes around Karpathos (catalogue depths of ≤40 km). (d) Swath bathymetric profile E–W along the line Z–Z΄, with points projected from 5 km either side of the line. (e) Regions where Pliocene–Quaternary marine terraces are observed and the locations of (a), (b), (f), (g) and the normal fault near Avlona. (f) N–S striking normal fault at Olymbos. (g) Possible Pliocene–Quaternary sea notch at Achata, on the E coast of Karpathos, at ∼+50 m elevation A.S.L. Bathymetry data are from SRTM15 (Becker et al. 2009; Sandwell et al. 2014) and onshore topography is from SRTM-3 (Farr et al. 2007). Focal mechanisms are from the gCMT catalogue (Dziewonski et al. 1981; Ekström et al. 2012), except for the 1996 earthquake (marked in red), for which the focal mechanism is from Shaw & Jackson (2010).
The thrust- or reverse-faulting earthquakes in Fig. 10(d) are coloured red. Some have slip-vector azimuths that are similar to the azimuth of convergence between Nubia and Karpathos, Rhodes and Crete. Several of these earthquakes have well-constrained shallow depths (notably the 2009 earthquake), so probably accommodate shortening within the overriding Aegean material. Others (for example in 2010) have slip-vector azimuths perpendicular to the strike of the Pliny and Strabo Trenches and may indicate that their bathymetry is the expression of reverse faulting.
We conclude that the oblique convergence in the SE Hellenic subduction zone is probably accommodated by some combination of two processes:
Oblique slip on the subduction interface, with arc-parallel extension and some shortening oblique to the strike of the trenches in the overriding material.
Partitioning of oblique convergence into trench-parallel and trench-perpendicular components, with the left-lateral trench-parallel component accommodated through strike-slip and oblique-normal faulting and the trench-perpendicular component accommodated by slip on the subduction interface or on reverse faults within the overriding Aegean material.
At present, there are too few data to determine either the location of the subduction interface in the region or the azimuth of slip on it, so it is difficult to determine the relative importance of these two processes. While the kinematics of the Pliny and Strabo Trenches remain unclear, there is little justification for their widespread interpretation as simple strike-slip shear zones.
5.2 Vertical motions in the SE Hellenic subduction zone
Late-Quaternary marine terraces are observed around the coast of W Crete, preserved at elevations of up to at least 75 m, with estimated uplift rates of up to 2.0–2.7 mm yr−1 (Figs 1 and 12; e.g. Shaw et al. 2008; Tiberti et al. 2014). Late-Holocene palæoshorelines are also present in W Crete (white dots in Fig. 12) at up to 9 m above present-day mean sea level (e.g. Spratt 1865; Pirazzoli et al. 1982). Most of their uplift is thought to have occurred during the AD 365 earthquake, on a reverse fault within the overriding Aegean material (e.g. Shaw et al. 2008; Papadimitriou & Karakostas 2008; Stiros 2010). Such reverse faulting would also contribute to the longer-term Quaternary uplift by underplating Crete with subducted sediment. Similarly, late-Holocene palæoshorelines and Quaternary marine terraces are observed on Rhodes (Gauthier 1979; Pirazzoli et al. 1989), where their uplift is also attributed to offshore reverse faulting (Kontogianni et al. 2002; Howell et al. 2015).
Relationship between vertical coastal motions and rates of convergence. Coastlines where Pliocene–Quaternary marine terraces are observed are marked by blue and white lines (from the same sources as Fig. 1), and sites where uplifted late-Holocene palæoshorelines are observed are marked by white circles. White arrows show GPS velocities relative to Nubia, with velocities in mm yr−1 in boxes next to the arrows (except for the arrow NE of the Florence Rise, which is a rate of convergence estimated from nearby GPS velocities). The approximate region where the overriding material is being shortened and thickened is shown in dark red. Its southern boundary is drawn along the southern side of the Hellenic Trench system and the Florence Rise, which may mark the boundary between the sediments on the Nubian plate and the material overriding the subduction interface, and its northern boundary joins: (1) Regions of uplift thought to result from crustal thickening under W Crete and Rhodes; (2) the northernmost reverse faults imaged in the Anaximander Mountains by Aksu et al. (2009); and (3) the northern side of the Florence Rise. Regions and directions of horizontal extension in the overriding material are marked by yellow arrows. Sediments being thickened on the Nubian Plate are marked in light pink, and the Aegean, SW Turkey and Anatolia are coloured green, yellow and grey. The location of the escarpment bounding the Rhodes basin is marked by a black and white dotted line.
Western Crete and Rhodes lie immediately adjacent to the steep bathymetric escarpments of the Hellenic Trench and Rhodes Basin (Fig. 12), which are thought to occur at the surface projection of the reverse faults responsible for late-Holocene uplift. Long-wavelength uplift of parts of the Peloponnese close to the Matapan Trench may have a similar origin (Fig. 12; Howell et al. 2017). In Crete, Rhodes and the Peloponnese, the wavelength of uplift is too long to have been caused by footwall uplift associated with normal faulting, which generally produces tilting and subsidence on wavelengths of ∼10–15 km in Greece (e.g. Jackson et al. 1982; Lyon-Caen et al. 1988; Gaki-Papanastassiou et al. 2009). Instead, this long-wavelength uplift may be due to crustal thickening associated with reverse faulting and underplating of sediment (e.g. Le Pichon & Angelier 1981; Howell et al. 2017).
Simple calculations show that uplift of this rate and wavelength is plausible if the overriding crust is thickened by the addition of sediment to its base. Assuming constant crustal and mantle densities ρc and ρm of 2700 and 3300 kg m−3 respectively, ∼5.5 mm yr−1 of crustal thickening would be required to support 1 mm yr−1 of uplift if the uplift occurs above sea level (assuming that ρw = 1000 kg m−3, ∼3.8 mm yr−1 of crustal thickening would be required to support 1 mm yr−1 of uplift below sea level). There is ∼40 mm yr−1 of convergence between the Aegean and Nubia across the Hellenic Trench (Reilinger et al. 2006) and ≳10 km of sediment offshore (Chaumillon & Mascle 1997). If a 10 km thickness of sediment were to be subducted at the observed convergence rate, ∼400 m3 of sediment would be subducted every year per metre along the strike of the subduction zone. Addition of this much sediment to the base of the overriding crust over the 100 km closest to the Hellenic Trench would give average rates of crustal thickening of ∼4 mm yr−1, enough to support an average uplift rate of ∼0.7–1.0 mm yr−1 (this average rate would be faster if crustal thickening were concentrated in a region closer to the Hellenic Trench). Note that, as for our estimate of subsidence rates for SW Turkey in Section 4.3, these estimates of uplift rates due to crustal thickening assume conservation of volume. If, as we will discuss in Section 6.2, mantle convection also contributes to present-day vertical coastal motions, then uplift and subsidence due to changes in crustal thickness would be superimposed on any longer-wavelength effects associated with mantle convection, and both could contribute significantly to the total observed vertical motions.
Between eastern Crete and Rhodes there is no land above sea level except at Karpathos and Kasos (the small island SW of Karpathos; Fig. 11), and earthquake data and the presence of onshore and offshore normal faults are consistent with 4–6 mm yr−1 of NE–SW arc-parallel extension between Crete and Rhodes observed using GPS (Fig. 11; Mascle et al. 1982; Kahle et al. 1998; ten Veen & Kleinspehn 2002). Crustal thinning associated with this extension will contribute a component of subsidence to the region between E Crete and Rhodes (see Section 4.3) and the effects of mantle convection (discussed in Section 6.2) may add even more; but superimposed on this subsidence is the topography associated with the normal faulting itself and any uplift related to the crustal thickening due to Nubia–Aegean convergence. The island of Karpathos is bounded to the E and W by steep bathymetric escarpments, which the focal mechanisms of nearby earthquakes suggest are the expressions of normal faulting. Karpathos is a narrow (<15 km) horst block in the footwalls of these normal faults, with incised Pliocene–Quaternary marine terraces at up to ∼250 m above sea level (Fig. 11; Barrier 1979; Angelier et al. 1982) that are likely to be associated with localized footwall uplift rather than the much longer-wavelength uplift (≳100 km) caused by the crustal thickening seen in Crete and Rhodes. Between Crete and the Peloponnese, GPS data show ∼2 mm yr−1 of NW–SE extension (Nocquet 2012) and the many offshore N–S normal faults (Huchon et al. 1982; Kokinou & Kamberis 2009) indicate that here too, extension and subsidence dominate over any uplift from crustal thickening.
In the extreme SE of Crete, Angelier (1979) observed a specimen of Strombus bubonius, the characteristic fossil restricted in the Mediterranean to the Tyrrhenian highstand (MIS 5e; 125 kyr), at ≲10 m elevation. Based on the presence of this fossil, Peters (1985) concluded that uplift rates have been slow (≲0.1 mm yr−1) during the late Quaternary. This estimated rate is also consistent with an apparent absence of datable late-Holocene coastal uplift in E Crete (Strobl et al. 2014; Mouslopoulou et al. 2015) and the presence of a Roman fish tank close to present-day mean sea level (Flemming & Pirazzoli 1981; Gaki-Papanastassiou et al. 2009). Although present-day uplift rates in E Crete are therefore probably slow, the Pliocene–Quaternary uplift history may be more complex. Peters et al. (1985) assigned a Pliocene age to the marine terraces that reach elevations of up to ∼400 m in E Crete (corresponding to an average uplift rate of ∼0.1 mm yr−1 over the last ∼5 Myr), but suggested that some are covered by Quaternary marine sediment following Pliocene subsidence. If this assertion is correct and these terraces were below sea level during the Quaternary, then temporal changes in rates and directions of vertical motions and rapid uplift at some time during the Quaternary would be required to explain the present elevation of the highest terraces.
We conclude that there is a recognizable pattern that illustrates the competition between coastal uplift and subsidence close to the Hellenic subduction zone. Regions of rapid long-wavelength coastal uplift lie close to major bathymetric escarpments like the Hellenic Trench and Rhodes Basin, where uplift from crustal thickening overwhelms subsidence. Regions where extension and subsidence apparently dominate (such as E and W of Karpathos) lie further from their closest escarpments (such as the Pliny and Strabo Trenches), indicating that most of the crustal thickening occurs some distance seaward of the islands (Fig. 10). In such places it is not surprising that extension and subsidence dominate over crustal thickening and uplift, especially where convergence is slower or crustal thickening is spread over a wider region than at the Hellenic Trench.
6 SYNTHESIS AND DISCUSSION
6.1 Synthesis: the kinematics of convergence and vertical coastal motions
The purpose of this study was to examine the convergence between the oceanic lithosphere at the leading edge of the Nubian plate and the continental material at the southern edge of Eurasia between the longitudes of western Crete and Cyprus. Everywhere that continental material is moving relative to the stable interior of Eurasia, deformation is largely related to those motions within the southern margin of Eurasia. In the east, between Cyprus and Antalya, the convergence is slow (5–15 mm yr−1), apparently localized at the surface along the line of the Florence Rise, and occurs between Nubia and relatively stable Anatolia. Between Antalya and Rhodes, convergence of ∼15–30 mm yr−1 is between Nubia and the extending SW Turkey, and must occur mostly offshore in a broad zone that includes the submarine Anaximander Mountains. Between Rhodes and Crete oblique convergence is rapid (∼35 mm yr−1) between Nubia and the southern Aegean Sea, which although relatively rigid itself, is deforming rapidly on its southern margin, largely by arc-parallel extension. Only in the Hellenic subduction zone (between the Peloponnese and Rhodes) and NE of the Florence Rise is there evidence for an inclined earthquake zone within a subducting slab that reaches depths of 100–150 km in the mantle. The variety of kinematic and tectonic characteristics within the E–W convergent zone emphasizes the importance of a number of interacting effects.
The subduction interface. Earthquakes on a thrust or decoupling interface which must exist between the subducting oceanic crust of Nubia and its over-riding material are rare. In the western part of the Hellenic subduction zone occasional earthquakes of moderate size (Mw < 7) reveal the depth and dip of the interface, but occur on seismically-slipping patches of dimension only ≲20 km on a surface that must be slipping mostly aseismically; a conclusion robustly supported by the historic seismic-moment budget (Jackson & McKenzie 1988; Shaw & Jackson 2010) and the very low rate of elastic-strain accumulation seen in GPS observations (Vernant et al. 2014). Further east, there is no conclusive earthquake evidence for slip on the interface at all south of SW Turkey and only two possible such earthquakes NE of the Florence Rise. It is likely that most parts of the subduction interface shallower than 40 km slip aseismically, perhaps related to the thick, probably overpressured sediment that overlies the oceanic crust (Chaumillon & Mascle 1997; Huguen et al. 2001). By contrast, earthquakes within the Nubian lithosphere below the subduction interface are abundant and probably related to its internal deformation. Distinguishing these earthquakes from those on or above the subduction interface requires careful determination of the earthquake focal mechanisms and depths, and is one of the main achievements of several authors over the last 25 years (e.g. Taymaz et al. 1990; Kiratzi & Louvari 2003; Benetatos et al. 2004; Shaw & Jackson 2010; Yolsal-Çevikbilen, & Taymaz 2012; Yolsal-Çevikbilen et al. 2014).
The convergence rate. The Nubian oceanic crust is everywhere covered by thick sediments. Most of this sediment does not appear to be incorporated into the mantle (Mann 1983; Briqueu et al. 1986; Zellmer et al. 2000), but instead may be thickened in the offshore region south of the Peloponnese, Crete, Rhodes and the Turkish mainland. The thickening will lead to uplift, but at a rate that will depend on the width of the zone perpendicular to the margin over which the thickening occurs and on the convergence rate itself. In the east, Nubia–Anatolia convergence is relatively slow and thickening has led to the bathymetric ridge of the Florence Rise, which increases in relief to the NW as the convergence rate itself increases away from the Nubia–Anatolia rotation pole. Offshore SW Turkey, and in the SE Hellenic subduction zone between Crete and Rhodes, the distributed hummocky offshore bathymetry consisting of elongated ridges and the earthquake focal mechanisms indicate that shortening of the sediment cover occurs over zones ∼100 km wide. By contrast, SW Crete lies 30 km from the deep bathymetric escarpment known as the Hellenic Trench, and its coastline probably overlaps much more with the region of fastest crustal thickening, which may be responsible for the very rapid uplift (∼2 mm yr−1) of SW Crete (Shaw et al. 2008; Tiberti et al. 2014; Mouslopoulou et al. 2015). The same association is also made SW of the Peloponnese in the Matapan Trench by Howell et al. (2017).
Extension of overriding material. Over much of the convergent zone material that overlies the inferred Nubian subduction interface is extending (the exception is above the Nubia-Anatolia convergence between Cyprus and Antalya). In parts of the onshore region of SW Turkey the extension is almost radially divergent. In the Hellenic subduction zone it is dominantly arc-parallel along the line of islands between the Peloponnese, Crete, Karpathos and Rhodes. Such extension leads to crustal thinning and subsidence, and is therefore a competing influence against any uplift caused by sediment thickening in the same regions. Some care is needed in interpreting coastline observations, because the general subsidence is superimposed by saw-tooth-like block motions related to the normal faulting that accommodates the extension, which may include local uplift of footwalls. This is a familiar feature of many extending terranes, including further north in Greece (Armijo et al. 1996; Stiros et al. 2000; McNeill & Collier 2004), but footwall uplift can be distinguished from uplift related to regional thickening by its length scale: footwall uplift is a tilt occurring over a distance similar to the seismogenic thickness (10–15 km), whereas regional uplift due to crustal thickening is likely to be on a much larger scale. Thus Karpathos is an identifiable horst block bounded by normal faults, whereas the tilt of western Crete on a scale of 100 km is related to the underplating of sediment beneath it (Le Pichon & Angelier 1981; Shaw & Jackson 2010; Howell et al. 2017), whether this occurs by imbricate reverse faulting or by more uniformly distributed processes.
Vertical motions along the convergent zone. The competition between uplift from sediment thickening and subsidence (partly caused by crustal thinning) is likely to be responsible for the pattern of vertical coastline motions in the convergent zone. In SW Turkey, subsidence clearly wins and the coastline is sinking, making it very likely that shortening is distributed and occurs offshore — a conclusion supported by the offshore bathymetry, structure and earthquake mechanisms. In the SE Hellenic subduction zone, the obvious conclusion is that where Holocene or late Quaternary marine terraces are prominent above sea level on a length scale of many tens of km (in the Peloponnese, SW Crete and Rhodes) uplift is dominant and processes that promote subsidence are unable to keep the region below sea level. (The uplift of Karpathos, as a normal-fault-bounded horst block, is distinguished by its relative narrowness.) In between these regions of uplift, GPS observations and the high density of offshore normal faulting (e.g. Angelier et al. 1982; Mascle & Martin 1990) suggest that subsidence from extension or mantle convection is able to maintain the region below sea level. It is notable that in the places where inferred subsidence is dominant, the offshore bathymetry, structure and earthquake mechanisms imply that shortening is distributed over a wide zone offshore (Fig. 12); which would reduce the uplift rate onshore. By contrast, in those places where uplift is dominant (excluding Karpathos), coastlines lie much closer to the offshore bathymetric escarpments (the Matapan Trench, the Hellenic Trench and the Rhodes escarpment), and therefore overlap more with the region of greatest shortening and fastest uplift (Fig. 12).
Time dependence. An intriguing possibility is that the distribution of the fault patterns and vertical motions we see today may have changed with time over the last few million years. If, as ten Veen et al. (2004) suggest, parts of the Anaximander Mountains and the mountains onshore in SW Turkey are both formed of the same rocks (platform carbonates), then to reach their present depths below sea level, the rocks in the Anaximander Mountains would have subsided since they were formed; an absence of the Messinian M-reflector in the Rhodes Basin and Anaximander mountains suggests that subsidence occurred since the Late Miocene (Woodside et al. 2000; Hall et al. 2009; Aksu et al. 2014). This subsidence could plausibly have been related to extension similar to that now observed in SW Turkey, but the presence of active reverse faults in the Anaximander Mountains (Fig. 5) suggests that they are now being shortened and uplifted, implying a reversal of vertical motions at some point since they were formed. Such a reversal in vertical motions is similar to that suggested for E Crete by Peters et al. (1985), who inferred a change from Pliocene subsidence to Quaternary uplift. Such changes in the rates and directions of vertical motions are plausible, and might be caused by temporal variations in rates of crustal thickening, possibly related to changes in the thickness of sediment being subducted, the rate of convergence, the stresses that the subduction interface is able to support, or the rate of slab rollback and trench retreat. Alternatively, if mantle convection does contribute to coastal uplift and subsidence in the eastern Mediterranean (Section 6.2; Gessner et al. 2013; Schildgen et al. 2014; Uluocak et al. 2016), then temporal changes in mantle circulation may also contribute to these inferred variations in vertical coastal motions.
6.2 Topography supported by mantle convection and vertical coastal motions
In SW Turkey, between Fethiye and Antalya, both geomorphological and archæological evidence suggests that that the coast has subsided at an estimated rate of between 0.3 and ∼2 mm yr−1 during the late Holocene (Section 4.3; e.g. Anzidei et al. 2011), and the morphology of the coastline also indicates subsidence over the late Quaternary (Fig. 8). Such subsidence can result from three rather different effects. The most obvious (1) is crustal thinning related to extension, which we discussed in Section 4.3. This process has produced many large sedimentary basins (Sclater et al. 1980; Galloway 2008), and crustal extension is now taking place in the Aegean and SW Turkey (Section 4.4). However, present-day subsidence can also be produced by surface deformation resulting from mantle convection, if: (2) the circulation itself is time dependent (Houseman & McKenzie 1982); or (3) the surface of a plate moves up and down as it moves across a steady convective pattern. Whether subsidence is controlled by crustal thinning alone, or whether effects from convection may also be involved, can be explored using the gravity field, since only convective forces can maintain gravity anomalies whose wavelength is too great to be supported elastically (e.g. Watts & Daly 1981).
The Earth’s gravity field has now been mapped by GOCE using measurements of the gravity gradient tensor at a height of about 250 km. Comparison of DIR-R5 (Bruinsma et al. 2014), a gravity model obtained using only satellite data from GOCE, GRACE and a variety of satellite orbits, with surface gravity from altimetric measurements (Sandwell & Smith 2009; Sandwell et al. 2013), shows that DIR-R5 is accurate to wavelengths as short as 180 km (McKenzie et al. 2015). Unlike gravity models based on surface measurements, DIR-R5 is unaffected by the distribution of land and water, and has a uniform global accuracy (Bruinsma et al. 2014). Fig. 13(a) shows the free-air gravity anomaly over the eastern Mediterranean calculated from DIR-R5 using wavelengths between 4000 and 300 km. Gravity anomalies with wavelengths greater than 4000 km do not correlate with topography, and are believed to result from density variations in the lower mantle (e.g. Hager et al. 1985). Short-wavelength gravity anomalies are supported by an elastic layer whose thickness can be estimated from the correlation between gravity and topography using the approach of McKenzie et al. (2015). In Turkey, this approach shows that the thickness of the elastic layer is only about 4 km, and that the observed gravity anomalies with wavelengths greater than 300 km are not elastically supported.
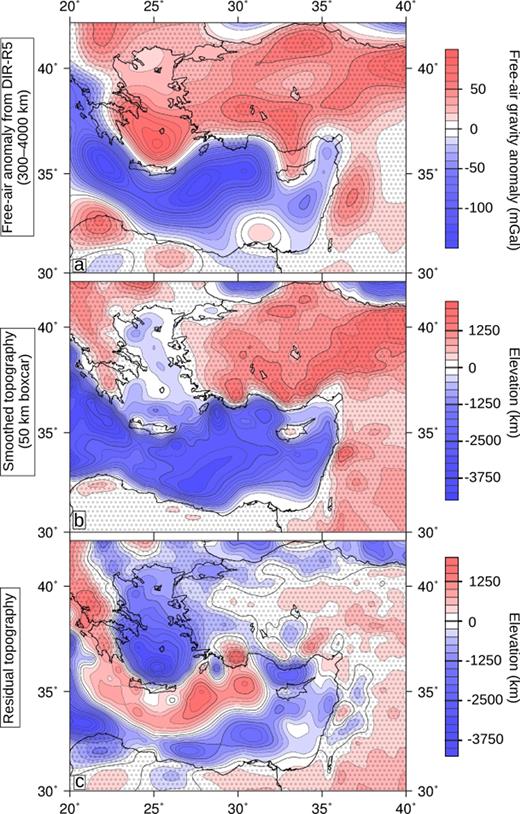
The long-wavelength gravity field and residual topography in the eastern Mediterranean. (a) The free-air gravity anomaly from DIR-R5 (Bruinsma et al. 2014), bandpass-filtered to include wavelengths between 300 and 4000 km. (b) Bathymetry (from Becker et al. 2009), smoothed using a 50 km-wide boxcar filter. (c) Residual topography, estimated by scaling the gravity in (a) and subtracting the result from the topography in (b).
Fig. 13(a) shows that the eastern Mediterranean is far from being isostatically compensated and that the region contains some of the largest long-wavelength gravity anomalies on Earth (e.g. Bruinsma et al. 2014). In general, the distribution of positive and negative gravity anomalies matches the elevations and depressions in the topography (see Figs 1 and 13b), which suggests topographic contrasts supported by mantle convection are important throughout the region (as several authors have suggested; e.g. Woodside 1976; Faccenna et al. 2013; Gessner et al. 2013; Uluocak et al. 2016). Both numerical experiments and observations of the relationship between gravity and topography in oceanic regions show that the ratio of convectively-supported gravity to topography is about 30 mGal km−1 when the topography is overlain by water (Crosby et al. 2006), corresponding to 50 mGal km−1 for continental regions where water is absent. These values have been used to remove the convectively-supported topography from the present topography (Fig. 13b) of the eastern Mediterranean to produce Fig. 13(c). The resulting map predicts that most of the region would be close to sea level in the absence of convective support. In particular, there is a steep N–S gradient in the gravity field in SW Turkey where the GPS measurements show that the surface is moving southwest relative to Nubia (Reilinger et al. 2006). The gravity gradient is about 150 mGal over 180 km, corresponding to a subaerial convectively-supported topography of about 3 km, or 5 km if it is submarine. The surface velocity relative to Nubia is about 20 mm yr−1 (Reilinger et al. 2006). Therefore, if the pattern of convection (and therefore the long-wavelength gravity field) is stationary with respect to Nubia, SW Turkey will subside at between 0.3 and 0.6 mm yr−1 as it moves south. This subsidence may provide an explanation for the foundering of shallow-marine Eocene limestones south of SW Turkish coast (Dumont & Woodside 1997; ten Veen et al. 2004) in addition to (or instead of) the extension-related subsidence discussed in Section 4.3.
These estimates of subsidence rate depend on the convective circulation being stationary in a frame fixed to Nubia. However, it seems unlikely that the convective pattern is stationary in any frame. The geometry of subduction zones in the Eastern Mediterranean has changed in the last 10 Ma as the Hellenic Arc has expanded (e.g. Le Pichon & Kreemer 2010; Schildgen et al. 2014; Jolivet et al. 2015), and is likely to have affected the deeper circulation. Boundary layer instabilities may also have arisen where shortening thickened the boundary layer (Houseman et al. 1981) or when it thickened through cooling (Houseman & McKenzie 1982). The time scale τ that governs the development of such instabilities can be estimated from numerical experiments, which show that its value is proportional to the viscosity. Houseman et al. (1981) showed that a viscosity of 2 × 10²⁰ Pa s, a typical estimate for the mantle beneath Fennoscandia (e.g. Lambeck et al. 1998; Milne et al. 2001), gives values of τ of between 4 and 8 Ma. The overriding lithosphere in the eastern Mediterranean is thinner than Fennoscandian lithosphere, so the mantle wedge above the downgoing Nubian plate will be hotter than mantle beneath Fennoscandia (Priestley & McKenzie 2006) as well as wetter (Hirth & Kohlstedt 2003), and may have a viscosity that is lower by at least an order of magnitude; this lower viscosity would correspond to a value of τ of 0.4 to 0.8 Ma. The amplitude of the topography h resulting from boundary layer instabilities is ∼2 km (Houseman & McKenzie 1982), and the numerical experiments of Parsons & Daly (1983) showed that h ∝ η0.4. Combining these estimates gives subsidence rates of 0.25–0.5 mm yr−1 for a viscosity of 2 × 10²⁰ Pa s, increasing to 1–2 mm yr−1 if η = 2 × 10¹⁹ Pa s.
These estimates of subsidence rates estimated from numerical experiments using constant viscosity fluids are unlikely to be correct to better than an order of magnitude. They are, however, similar in size to the rates of vertical coastal motions observed and also calculated in Sections 4.3 and 5.2. They and the magnitude of the gravity anomalies in Fig. 13(a) clearly show that rates of vertical coastal motions in the Eastern Mediterranean estimated from changes in surface area and conservation of volume may not be accurate, and that it is important to take topographic changes related to mantle convection into account. However, since the time dependence of mantle convection in the eastern Mediterranean is poorly constrained, it is possible that this convectively supported topography is not being formed today and that the effects of changes in crustal thickness dominate present-day vertical coastal motions. We conclude that although mantle convection and changes in crustal thickness may both contribute to coastal uplift and subsidence in the eastern Mediterranean, their relative contributions are unknown.
6.3 The dynamics of deformation in the eastern Mediterranean
GPS velocities relative to Nubia change in magnitude and direction from E to W, from 15–20 mm yr−1 in a westward direction in E Turkey to 35–40 mm yr−1 in a southwestward direction at the Hellenic subduction zone. There is much discussion of the contribution of slab rollback to Aegean extension (e.g. Le Pichon & Kreemer 2010; Sternai et al. 2014; England et al. 2016), but several studies have suggested that the buoyancy forces associated with the ∼4–5 km elevation difference between southern Greece and its adjacent Mediterranean seafloor are also important (or even dominant) in driving deformation in the Aegean and Anatolia (e.g. McKenzie 1972; Özeren & Holt 2010; England et al. 2016). These buoyancy forces are often calculated from isostatically-compensated topographic contrasts, although it is likely that convectively-supported topographic contrasts are also present (Section 6.2).
Although buoyancy forces from topographic contrasts are likely to contribute significantly to driving deformation in the Aegean, it is not clear why the Aegean is extending while Central Anatolia is not. Fig. 7(c) shows extensional strain rates that decrease in magnitude by a factor of 5 between the W coast of Turkey (the E border of the Aegean, where strain rates are as high as 7 × 10⁻⁸ yr−1) and the region N and E of Antalya (where strain rates are typically ∼1.2–1.5 × 10⁻⁸ yr−1). The topographic contrast between the mountains E of Antalya (which reach almost 3000 m above sea level; Fig. 1) and the 2.5 km-deep Antalya basin is similar to that between SW Greece and the Hellenic Trench. Both areas would be subject to the vertical forces induced by mantle convection, which could support topography (Fig. 13). If deformation in the Hellenic subduction zone and the area N and E of the Florence Rise were controlled by buoyancy forces from topographic contrasts alone, central Anatolia would be expected to be in rapid N–S or NE–SW extension. Since significant extension is not observed in central Turkey, there must be an important difference between the Hellenic subduction zone and the area to its east, but it is not yet clear why these two subduction zones are so different.
7 CONCLUSIONS
Our analysis of the kinematics of convergence in the eastern Mediterranean has shown that the role of strike-slip faulting in accommodating convergence is smaller than has previously been suggested, since there have been few recent shallow strike-slip earthquakes and strike-slip faulting is not required to explain surface motions measured using GPS near the Florence Rise or in SW Turkey (although strike-slip faulting may accommodate part of the oblique convergence in the Anaximander Mountains and near the Pliny and Strabo Trenches). Instead, the deformation of the material that overrides the subduction interface is dominated by two main processes:
A band of crustal thickening close to the subduction zone (red in Fig. 12), inferred from earthquake and reflection seismic data and the spatial distributions of uplifted late-Holocene palæoshorelines. In the E, this crustal thickening appears to be localized above the surface projection of the Anatolia–Nubia subduction interface at the Florence Rise. In the W, it occurs N of the Hellenic, Pliny and Strabo Trenches, where in places it may be wider than at the Florence Rise due to the faster convergence.
Normal faulting that accommodates mainly arc-parallel extension of the overriding material in the Aegean and SW Turkey.
Vertical coastal motions close to the subduction zone are certainly influenced by the interplay between these two processes. Where coastlines are close to the subduction zone (such as in SW Crete), they overlap more with the region of fastest crustal thickening, which is able to overwhelm any subsidence, and coastal uplift occurs. For coastlines further from the subduction zone (such as in SW Turkey), vertical coastal motions are dominated by subsidence, which is probably related to a combination of the effects of mantle convection and crustal thinning related to extension. The principal remaining uncertainties in understanding the tectonics of the eastern Mediterranean are the vertical motions caused by mantle convection. Convective support of topography is inescapable because of the observed long-wavelength gravity anomalies; but its effect on the present-day rates of vertical motions depends on the time-dependence and stability of the convection pattern and on mantle viscosity, which are unknown.
Acknowledgements
AH is supported by a Shell Exploration studentship. This study forms part of the NERC- and ESRC-funded project ‘Earthquakes Without Frontiers’ under grant NEJ02001X/1, and was partly funded by the NERC grant ‘Looking inside the Continents from Space’. The figures were mostly produced using the Generic Mapping Tools (Wessel et al. 2013). We would like to thank Anastasia Kiratzi for kindly sending us her waveform data for several earthquakes before 1990 and Camilla Penney for comments on an earlier version of the manuscript. Finally, we are very grateful to the editor (Donna Blackman), and to Jeremy Hall, Riccardo Caputo and an anonymous reviewer for their comments, which improved parts of the paper significantly.
REFERENCES
SUPPORTING INFORMATION
Supplementary data are available at GJI online.
Table S1. Dates and source parameters of earthquakes in the eastern Mediterranean obtained by inversion body waveforms.
Figure S1. Fit of synthetic to observed waveforms for the 1990 July 18 SW Turkey MW 5.4 earthquake.
Figure S2. Fit of synthetic to observed waveforms for the 1994 November 13 SW Turkey Mw 5.4 earthquake.
Figure S3. Fit of synthetic to observed waveforms for the 1995 May 29 Cyprus Mw 5.2 earthquake.
Figure S4. Fit of synthetic to observed waveforms for the 1995 February 23 Methoni Mw 5.9 earthquake.
Figure S5. Fit of synthetic to observed waveforms for the 2003 May 03 Anaximander mountains Mw 5.4 earthquake.
Figure S6. Fit of synthetic to observed waveforms for the 2005 January 23 S Turkey Mw 5.7 earthquake.
Figure S7. Fit of synthetic to observed waveforms for the 2007 October 29 Methoni Mw 5.3 earthquake.
Figure S8. Fit of synthetic to observed waveforms for the 2009 June 19 S of Rhodes Mw 5.8 earthquake.
Figure S9. Fit of synthetic to observed waveforms for the 2009 July 01 Crete Mw 6.5 earthquake.
Figure S10. Fit of synthetic to observed waveforms for the 2009 December 22 Zakynthos Mw 5.2 earthquake.
Figure S11. Fit of synthetic to observed waveforms for the 2010 April 24 Florence Rise Mw 5.4 earthquake.
Figure S12. Fit of synthetic to observed waveforms for the 2011 April 01 Crete Mw 6.1 earthquake.
Figure S13. Fit of synthetic to observed waveforms for the 2012 June 10 Karpathos Mw 6.2 earthquake.
Figure S14. Fit of synthetic to observed waveforms for the 2012 July 09 Southern Greece Mw 5.7 earthquake.
Figure S15. Fit of synthetic to observed waveforms for the 2012 September 12 Rhodes Basin Mw 5.5 earthquake.
Figure S16. Fit of synthetic to observed waveforms for the 2013 June 15 Rhodes Basin Mw 6.2 earthquake.
Figure S17. Fit of synthetic to observed waveforms for the 2013 June 16 Crete Mw 6.0 earthquake.
Figure S18. Fit of synthetic to observed waveforms for the 2013 December 28 Crete Mw 5.9 earthquake.
Figure S19. Fit of synthetic to observed waveforms for the 2015 April 16 Crete Mw 6.1 earthquake.
Figure S20. Fit of synthetic to observed waveforms for the 2015 June 09 Crete Mw 5.3 earthquake.
Please note: Oxford University Press is not responsible for the content or functionality of any supporting materials supplied by the authors. Any queries (other than missing material) should be directed to the corresponding author for the paper.
