


SUMMARY
The occurrence of deep low-frequency (DLF) microearthquakes beneath volcanoes is commonly attributed to mass transport in the volcanic plumbing system and used to infer feeding channels from and into magma reservoirs. The key question is how magmas migrate from depth to the shallow crust and whether magma reservoirs are currently being recharged. For the first time since the improvement of the local seismic networks in the East Eifel region (Rhineland-Palatinate, Germany), we detect and locate recurrent DLF earthquakes in the lower crust and upper mantle beneath the Laacher See Volcano (LSV), using a joint data set of permanent sensors and a temporary deployment. So far, eight DLF earthquake sequences were observed in four distinct clusters between 10 and 40 km depth. These clusters of weak events (ML< 2) align along an approximately 80° southeast dipping line south of the LSV. Moment tensor solutions of these events have large shear components, and the irregular dispersion and long coda of body waves indicate interaction processes between shear cracks and fluids. We find a rotation of P-axes orientation for shallow tectonic earthquakes compared to DLF events, indicating that the stress field in the depth interval of DLF events might favour a vertical migration of magma or magmatic fluids. The caldera of the LSV was formed by the last major eruption of the East Eifel Volcanic Field only 12.9 kyr ago, fed by a shallow magma chamber at 5–8 km depth and erupting a total magma volume of 6.7 km3. The observed DLF earthquake activity and continuous volcanic gas emissions around the LSV indicate an active magmatic system, possibly connected with an upper mantle melt zone.
1 INTRODUCTION
Understanding the mechanisms of earthquakes related to magmatic and volcanic processes is a main goal of volcano seismology and a powerful tool to assess the state of activity at volcanoes. Seismic signals observed beneath volcanic systems have a broad range of frequencies and are associated with different processes at depth. While high-frequent volcano-tectonic (VT) earthquakes reflect brittle failure mostly in the shallow crust (McNutt 2002), long-period (LP) and low-frequency (LF) earthquakes occur in the upper mantle and the lower crust, as well as in the shallow crust close to the volcano edifice, and are commonly associated with unsteady mass transport in the volcanic plumbing system (Chouet 1996; Frank et al.2018). This study focuses on earthquakes between 10 and 40 km depth with dominant frequencies between 2 and 10 Hz. They are thus referred to as deep low-frequency (DLF) earthquakes. While shallow LF activity above 2 km depth is suggested to represent pressure-disruption in the steam-dominated region of the volcano (Chouet 1996) or the migration of bubbly magma in a conduit-like body (Neuberg et al.2006), DLF earthquakes are commonly attributed to movements of magma or magmatic fluids (Soosalu et al.2009; Nichols et al.2011; Shapiro et al.2017).
In contrast to high-frequent tectonic earthquakes in the brittle crust, DLF events show emergent wave onsets and do not follow the common magnitude corner-frequency (M − fc) scaling of tectonic events. They have significantly lower dominant frequencies than brittle crust earthquakes, and often show quasi-monofrequent signals or tremor-like overlapping series of repeated events. The DLF events beneath the Laacher See Volcano (LSV) predominantly occur in short pulses of several events within a few minutes. Their magnitudes rarely exceed ML 1.5. Similar observations of short-lived DLF earthquake activity have recently been made at active volcanic systems at Askja volcano in Iceland (Soosalu et al.2009) or at the Aleutian Arc (Power et al.2004), where in both cases a clear link to the magmatic plumbing system could be established.
In our study, we show and analyse for the first time DLF earthquake activity beneath the LSV in the East Eifel Volcanic Field (EEVF). The events have small magnitudes and are difficult to detect in continuous seismic recordings. Their hypocentres are constrained to a narrow, subvertical channel between approximately 10 and 40 km depth. This study covers the detection and location approach, a description of frequency characteristics of the DLF events and an estimation of moment tensor solutions and their Bayesian uncertainties. The findings are discussed in the context of the possible recharge of shallow magmatic reservoirs.
2 TECTONIC AND VOLCANIC SETTINGS OF THE EIFEL REGION
The Eifel region in Rhineland-Palatinate (Germany) is part of the Hercynian Rhenish Massif and is located between the Lower Rhine Embayment in the north and the Mosel river in the south. At present, it forms a peneplain mainly composed of Palaeozoic metamorphic rocks. Since the early Tertiary, the Rhenish Massif underwent intense uplift with distinct anomalies of nearly 300 m (Meyer & Stets 2007).
The LSV is located just outside the Neuwied Basin (NWB) and close to its northern border fault, the 120-km-long Variscean Siegen Thrust (Fig. 1), which is dipping towards SE and has an offset of about 1 km. The NWB is a tectonic depression of about 11 km by 26 km with a subsidence of about 350 m. The basin is considered to be still active, mainly because of the enhanced seismic activity within the basin. Most of the seismicity is found along the Ochtendung Fault Zone (OFZ), a lineament of microearthquakes between 2 and 12 km depth on a nearly vertical plane striking in NW–SE direction (Ahorner 1983; Dietz 2010). The largest instrumentally recorded earthquake so far occurred on 2007 August 3 on the OFZ close to the village of Plaidt, with a magnitude of ML 3.9. Macroseismic surveys revealed several earthquakes in the NWB with minimum epicentral intensities of I0 = IV–VI in the 19th and 20th centuries (Sponheuer 1952; Leydecker 2011). In 2011, an earthquake swarm (ML about –0.6 to 1.5), called the ‘Maifeld swarm’, occurred about 10 km south of the LSV and parallel to the OFZ (Weber 2012). Stress inversion from focal solutions in the NWB indicate a strike-slip regime with azimuthal orientations of approximately 290° for the P-axis and about 25° for the T-axis (Hinzen 2003; Dietz 2010). A second tectonic feature of interest is an approximately 1 km wide graben and horst zone south of the LSV crossing the border fault of the basin, the so-called Mendig Graben (Schmincke 2007, 2009). The Mendig Graben formed within hours and days during the last LSV eruption. The timing, size and extent of the Mendig Graben is similar to volcano-tectonic grabens and fissures forming during eruptions, controlled by shallow dyke intrusions (e.g. in Iceland, see Sigmundsson et al.2014). The strike and opening of the Mendig Graben may therefore indicate the orientation and depth of dykes from the LSV reservoir, and may be related to the direction of maximum horizontal compressive stress.
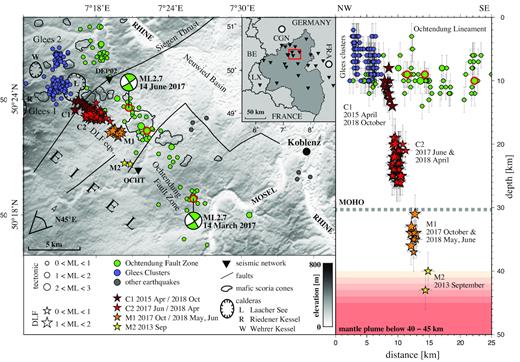
Topographic map of the East Eifel Volcanic Field including faults, calderas and scoria cones. Brittle earthquakes are marked as dots, DLF events as stars. Seismic stations are indicated as inverse triangles. Red circles mark the three largest tectonic earthquakes (ML > 2.3) in 2017 for which moment tensor solutions are discussed in this study, beach balls are given for the two largest events (ML 2.7). The city of Koblenz is marked with a black dot. The small overview map outlines the target region as a red box, the state of Rhineland-Palatinate is highlighted in dark grey. LX stands for Luxemburg and BE for Belgium, white dots give the cities of Cologne (CGN) and Frankfurt am Main (FRA). A depth section of all earthquakes is given in the right-hand panel, seen in direction to N45°E. Error bars indicate location uncertainties.
During Tertiary time, volcanic activity formed the Hocheifel volcanic field (ca. 35–44 Myr ago), mainly composed of alkali basalt. Volcanic activity resumed during Quaternary (since ca. 720 kyr) and formed two volcanic fields: (1) the West Eifel Volcanic Field (WEVF) with about 150 eruptions. Eruption activity migrated from NW to SE in the WEVF (Mertz et al.2015). The latest eruption occurred just 11 kyr ago and formed the Ulmener Maar with an up to 340 m wide inner cone (Zolitschka et al.1995). (2) The East Eifel Volcanic Field (EEVF) which is active since ca. 500 kyr with about 100 eruptive centres (Schmincke 2007). The latest eruption there was the paroxysm of the LSV just about 12.9 kyr ago (Zolitschka et al.2000). It was the most productive eruption in the Eifel (VEI 6) and was preceded by three earlier major eruptions (Kempenich, Rieden and Wehr volcanic centres) along a west towards east trend (Schmincke 2007). The LSV eruption had a total magma volume of approximately 6.7 km3 and produced massive layers of tephra, pumice and pyroclastic flows, leading to 60-m-thick ignimbrite layers in some valleys (Schmincke 2007). Millimetre-thick layers of ashes of the LSV are documented in more than 1000 km distance, in southern Sweden or northern Italy. Regarding its strength, the LSV eruption is comparable to the 1991 Pinatubo (Philippine) and larger than the 79 AD Vesuvius (Italy) or the 1980 Mt St Helens (USA) eruptions. In contrast to the older, neighbouring eruption centres Rieden and Wehr, the LSV experienced only one major pumice eruption so far. This eruption was fed by a 5–8 -km-deep phonolitic magma chamber (Harms et al.2004; Schmincke 2007). According to petrological models, the magma evolved for more than 100 kyr from a basanite melt to a phonolite magma (Bourdon et al.1994) which then differentiated further in the Laacher See magma chamber since about 33 kyr until 12.9 kyr ago (Schmitt et al.2010), when possibly a new basanite melt influx triggered the LSV eruption (Rout & Wörner 2018).
The current level of volcanic and magmatic activity in the Eifel is debated. Relative to the surrounding area, an increased gas flux is observed beneath the LSV (Goepel et al.2015), which is estimated from 5000 t yr–1 of CO2 (Aeschbach-Hertig et al.1996) to 12 800 t yr–1 of CO2 (Pérez et al.2011). Gas composition, for example noble gases (He, Ne, Ar), indicate an upper mantle origin (Aeschbach-Hertig et al.1996) and possibly multiple magma reservoirs (Bräuer et al.2013). The enhanced local seismicity (Hinzen & Reamer 2007) was hitherto not attributed to volcanic processes, but to tectonic activity at the OFZ (see Fig. 1). There is no heat flow anomaly related to the EEVF.
So far, no direct observations could be made indicating ongoing recharge in the magmatic plumbing system beneath the LSV. The location of magmatic feeding channels and active crustal magma reservoirs is unknown. However, although the volcanic hazard in the Eifel is assumed to be low, the risk in case of an eruption would be high due to the dense population and high damage potential of this region in Central Europe (Leder et al.2017). Thus, volcano-related seismic activity requires thorough monitoring and analysis.
In 1997/1998 a large-scale seismological experiment, the Eifel Plume project (Ritter et al.2000), was conducted with 158 mobile and 84 permanent seismic stations in order to determine the deep sources of the volcanism. Based on this data, Ritter et al. (2001) and Keyser et al. (2002) imaged a 100-km-wide low-velocity anomaly (vP and vS) in the upper mantle with seismic tomography. Using P-wave receiver functions Budweg et al. (2006) revealed that the 410 km discontinuity below the Eifel is depressed by approximately 20 km, indicating elevated temperature at this depth. These seismic models were interpreted as an upper mantle plume reaching down to at least 410 km depth (Wüllner et al.2006; Ritter 2007), which is supposed to represent the source of the volcanism at the surface (Mertz et al.2015). The upper boundary of the anomaly in the mantle is at about 40–45 km depth as derived from surface wave (Mathar et al.2006) and S-wave receiver function modelling (Seiberlich et al.2013). Petrophysical interpretation of the seismic anomalies suggests about 1–2 per cent partial melt (Ritter 2007), which corresponds to some 4000 km3 melt inside the seismic anomaly in the uppermost mantle.
3 SEISMIC DATA ANALYSIS
The EEVF is monitored with a permanent seismic network operated by the Seismological Survey of Southwest Germany (Erdbebendienst Südwest, EDSW), the joint Seismological Services of Rhineland-Palatinate and Baden-Württemberg. It also includes stations of collaborating institutions (Seismological Services of North Rhine-Westphalia and Hesse, the GEOFON network (GFZ Potsdam), the German Regional Seismic Network GRSN (BGR Hannover) and the Earthquake Observatory Bensberg (University of Cologne)). In addition, there are temporary deployments by the Karlsruhe Institut of Technology (KIT, since July 2014) and the GFZ Potsdam (July 2014–July 2016) (Ritter et al.2014). The region is currently covered with around 25 seismic stations (Fig. 1).
3.1 Earthquake detection and location
Automatic detection of earthquakes in the EEVF is mainly performed by the monitoring system of the EDSW. In addition, the collection of DLF events is supplemented by means of visual waveform inspection or systematic cross-correlation search. Single event location is carried out through the program ‘hypoplus’, modified after Oncescu et al. (1996), which is based on a mainly 1-D layered model of the earth’s seismic velocities.
Progressive improvements to the local seismic networks in the East Eifel region in recent years allowed for the first time the detection and location of DLF earthquakes beneath the LSV in 2013. Fig. 2 shows the unfiltered velocity waveforms of a tectonic ML 2.7 earthquake and a ML 1.3 DLF earthquake, both recorded at the local station Ochtendung (OCHT) in a few kilometres epicentral distance. Although the tectonic event has a much larger magnitude and a hundreds of times larger ground velocity at station OCHT, the waveforms of the DLF earthquake have a much lower frequency content and show much longer P- and S-wave codas. So far, eight sequences of such DLF events were observed in four spatially separated clusters in the lower crust and upper mantle (Table 1). These clusters form an approximately 80° dipping line from the southeast of the LSV to its southern caldera rim.
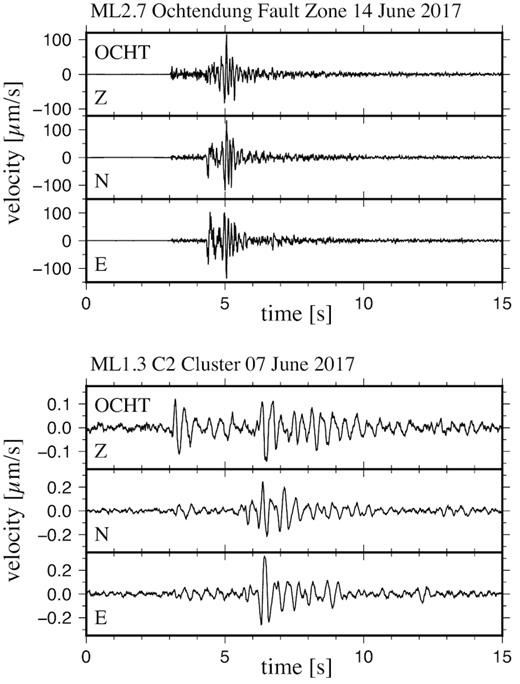
Waveform examples of a tectonic ML 2.7 earthquake on the Ochtendung Fault Zone (upper panel) and a ML 1.3 DLF event in the C2 cluster (lower panel). Shown data are from the seismic station Ochtendung (OCHT) southeast of LSV (Fig. 1), time windows are of equal length for frequency comparison.
Parameter summary of all DLF earthquake clusters. Depth residuals are ±3 km, uncertainty of fc is 3 Hz.
| Cluster | Depth [km] | Date of DLF activity | Duration of DLF sequence | ML | Number of events | fc [Hz] |
|---|---|---|---|---|---|---|
| C1 | 8–14 | 2015 April 14 | 5 min | 0.9–1.8 | 5 | 1–4 |
| 2018 October 5 | 6 min | 0.6–1.3 | 7 | |||
| C2 | 19–26 | 2017 June 4–13 | 9 d | 0.2–1.3 | 52 | 2–7 |
| 2018 April 28 | 6 min | 0.7–1.3 | 4 | |||
| M1 | 31–37 | 2017 October 25 | 36 s | 0.7–1.1 | 4 | 4–9 |
| 2018 May 18 | 50 s | 0.7–1.3 | 3 | |||
| 2018 June 5 | One single event | 0.8 | 1 | |||
| 2018 June 30 | 2 min | 0.9–1.3 | 4 | |||
| M2 | 40–43 | 2013 Sept. 18 and 22 | Two single events | 0.7 and 0.9 | 2 | 7–10 |
Fig. 1 summarizes the spatial distribution and nomenclature of all clusters of DLF events. C-clusters are located in the (lower) crust, M-clusters in the upper mantle, numbered from shallow to deep. The first observation of DLF earthquakes in September 2013 was limited to two single events at 40 and 43 km depth in the upper mantle (cluster M2) with about ±3 km uncertainty. These were the deepest earthquakes ever detected in Germany. Although these two earthquakes had small magnitudes of ML 0.9 and 0.7 only, they attracted a lot of attention among German seismologists. Independent approaches by different groups, including classical arrival time fitting as well as waveform attributed stacking approaches, all confirmed that the events must have been originated in the upper mantle (Stange et al.2014). The depth of these events was also surprising because at this depth the uppermost part of the Eifel plume and temperatures of more than 900 °C are expected (see Section 2), suggesting ductile behaviour. However, the M2-cluster has never been reactivated since. After 2013, subsequently, more DLF earthquake clusters have been detected. The most shallow cluster (C1) was initially observed in April 2015 at 8–14 km depth. Five events occurred within about five minutes, some of which show an S-coda of up to 30 s length and some similarity to so-called Tornillo events (mono-frequent low-frequency earthquakes). This cluster was once reactivated in October 2018, when six DLF earthquakes occurred within 7 min. The waveforms of the October 2018 events showed again strong mono-frequent, Tornillo-like signals and resembled the waveforms observed in 2015.
The most prominent cluster of DLF earthquakes (C2) became first time active in June 2017, when a sequence of about 50 events was detected over a period of 9 days at 19 –26 km depth. Most earthquakes occurred in pulses of a few minutes length with hours of quiescence between these pulses. Cluster C2 was once reactivated in April 2018 with a pulse of four events within 6 min. Another cluster of DLF earthquakes in the upper mantle (M1) was initially active in October 2017 (four events within 36 s, 31–37 km depth) and repeatedly reactivated in 2018: A pulse of three events in 50 s occurred in May, a single event beginning of June and another pulse of four events in less than 2 min end of June 2018. The timeline of events for the year 2017 and the temporal distribution of all DLF earthquake clusters are exemplary summarised in Fig. 3.
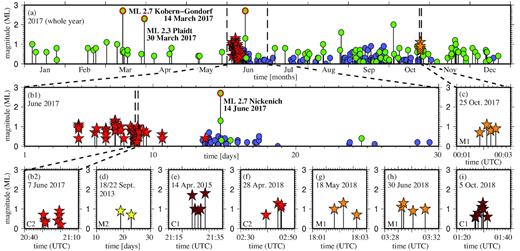
Temporal distribution of earthquake clusters. Colours and symbols are similar to Fig. 1. (a) for the whole year 2017, (b1) for June 2017, (b2) two short pulses within 30 min on 2017 June 7, (c) four events within 36 s on 2017 October 25, (d) two single events on 2013 September 18 and 22, (e) five events within 6 min on 2015 April 14, (f) single event followed by a pulse of three events on 2018 April 28, (g) three events within 50 s on 2018 May 18, (h) four events within 2 min on 2018 June 30 and (i) six events within 7 min on 2018 October 5.
Remarkably, single events and pulses of mainly less than a minute length were observed for the mantle clusters, while pulses in the crust usually lasted for several minutes. Further, the strongest C2-sequence in the beginning of June 2017 was followed just days later by a tectonic ML 2.7 earthquake on the OFZ and a swarm of more than 100 small high-frequent (ML < 1.0) events clustering in depths between 3 and 10 km in two narrow spots close to the village of Glees (Glees clusters, blue in Fig. 1). The Glees 1 cluster started on 2017 June 13 west of the LSV caldera lake, close to the monastery of Maria Laach. Activity declined by mid August and jumped northwards to the Glees 2 cluster, which was mainly active until end of October 2017 (see Fig. 3). A continuous migration of hypocentres or seismic fronts, as often seen in fluid-induced earthquake swarms (e.g. Hensch et al.2008), has not been observed. While no particular clustering of events was detected on the OFZ at the same time, slightly increased background seismicity was observed in the second half of 2017.
3.2 Frequency content and source parameters
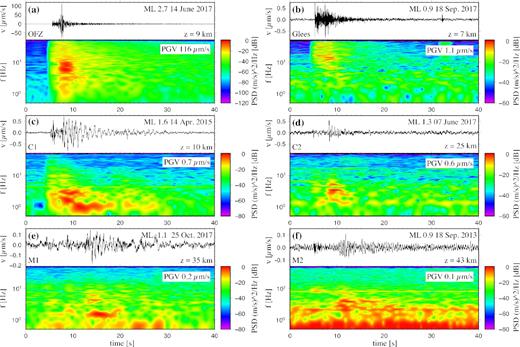
Waveform and spectrogram plots of exemplary earthquakes of each cluster. Both upper panels show high frequent brittle earthquakes of the OFZ (a) and the southern Glees 1 cluster (b), all following panels (c–f) show DLF earthquakes at various depths. The vertical component of station Ochtendung (OCHT), about 10 km SSE of Laacher See Volcano is displayed, except for the September 2013 event (f), where the station Ahrweiler (AHRW) is chosen, as OCHT was not yet installed by that time.
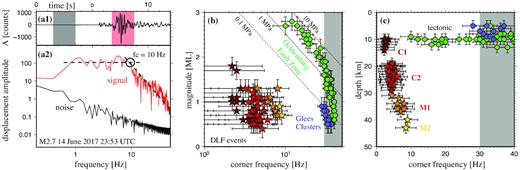
Corner frequencies fc with respect to magnitude ML and depth z. Symbols and colors are chosen similar to Fig. 1. Panel (a) gives an example for displacement waveforms and corresponding power spectra of signal (red) and noise (grey/black) of the ML 2.7 earthquake on the Ochtendung Fault Zone on 2017 June 14. The corner frequency in this example is 10 ± 3 Hz. Panel (b) shows ML with respect to fc. Dotted lines represent the stress drop, the grey box marks frequencies above 30 Hz that were excluded due to anti-alias filtering below fNy. Panel (c) shows z versus fc, grey box as in panel (b).
with |$v_S \mathrm{\approx 3500~m\, s^{-1}}$| and |$\frac{2}{3} M_L \mathrm{\approx \frac{2}{3}} M_W \mathrm{=\log _{10}}(M_0) \mathrm{-9.1}$|. Highfrequent earthquakes on the OFZ with fc< 30 Hz (approx. ML≥ 1.5) show stress drops Δσ between 1 and 10 MPa, as roughly expected for tectonic events. Due to anti-alias filtering below the Nyquist frequency (fNy = 50 Hz), values of fc > 30 Hz cannot be interpreted (grey box in Fig. 5). For DLF earthquakes, fc could be estimated down to about ML 1.0, before the signal vanishes in noise.
Corner frequencies of the observed DLF earthquake clusters seem to slightly increase with depth (see Fig. 5c and Table 1). fc ranges from 1 to 4 Hz in the C1 cluster to 7 to 10 Hz in cluster M2. This increase might reflect changes of rock parameters with depth, such as the shear modulus G, leading to higher rupture velocities and thus higher fc. Although the largest magnitudes of DLF earthquakes are found for the shallower clusters, distinct and hardly overlapping fc ranges observed at different depth levels suggest that fc is not only controlled by magnitude. In any case, the observation of higher frequencies from larger depths indicates that the unusual low frequencies of DLF earthquakes are not caused by any filter effects between source and receiver, for example due to shallow low velocity zones such as fluid reservoirs. Hence, the low frequency content points to the involvement of a source process other than tectonic.
3.3 Moment tensor analysis
3.3.1 Forward modelling and inversion approach
We apply a full waveform, probabilistic inversion method, which is developed in the frame of an open source software for seismic source parameter optimization (‘Grond’, https://pyrocko.org/grond/, Heimann et al. (2018)). It implements an efficient bootstrap-based method to retrieve solution subspaces, parameter trade-offs and uncertainties of earthquake source parameters (see Dahm et al.2018). The L1 norm is used to measure the mismatch between observation and model. Synthetic waveforms are modelled based on pre-calculated Green’s functions, assuming a regional velocity profile from the CRUST 2.0 Earthmodel database (https://igppweb.ucsd.edu/∼gabi/crust2.html, Bassin et al.2000). We run ‘Grond’ as a mixed inversion of amplitude spectra, envelope time traces, P/SH and SH/SV phase ratios of amplitude spectra plateaus, together with time domain waveforms. The spectral ratio inversion has been developed especially for the study of weak DLF events to consider the information embedded in scattered coda waves in larger epicentral distances, and was tested with synthetic seismograms. Time-shift for alignment between processed observed and synthetic waveforms are enabled, with a maximum shift constrained to <0.5 s, and a penalty misfit added when shifting. More details on the processing and the Monte Carlo directed global search optimization are described in Dahm et al. (2018) and in the supplementary information (Heimann et al. 2019), see also Heimann (2011); Heimann et al.(2017).
3.3.2 Moment tensor results
All together, we analysed 22 DLF events between 2013 and 2018 with ML > 1 and three tectonic earthquakes on the OFZ in 2017 with ML > 2.3. The total number of phases that could be used varied from event to event, depending on the signal-to-noise ratio (SNR) and the recording period of the event. For instance, the MW≈ 2.7 (ML≈ 2.7) earthquake on the OFZ on 2017 March 14 (Figs 1 and 4a) at a depth of about 9 km had 13 usable P, 2 SV and 13 SH traces in distances from 4 to 50 km (for amplitude spectra and ratios the distance range was up to 90 km). For the inversion of a MW 1.8 (ML≈ 1.3) DLF event on 2017 June 7 (Fig. 4d) at about 28 km depth we could use 10 P, 0 SV and 10 SH traces with sufficient SNR.
The three analysed tectonic earthquakes on the OFZ were used as a reference to verify our approach. The moment tensor results of these events (Table 2) are stable and robust, and have relatively small uncertainties. Waveforms, body wave spectra, envelopes and amplitude ratios are well fitted (electronic supplement). The double-couple component of the solution is in the range of 61 per cent (2017 March 30) and 72 per cent (2017 June 14; Fig. 8a). Polarities of first motions are consistent with moment tensor solutions, see Fig. 6. The nodal planes of the moment tensor solution fit very well to previous studies, indicating a vertically dipping plane with a strike in direction of the lineament of seismicity (≈150°, see green circles in Fig. 1) and a strike-slip mechanism (e.g. Hinzen 2003; Dietz 2010). The estimated moment magnitude and the centroid depth are both nominal similar to ML and the hypocentre depth, respectively. The isotropic component of the full moment tensors vary between 10 ± 6 per cent (2017-03-14) and 8 ± 5 per cent (2017-06-14). As the OFZ events are considered as purely tectonic, we do not believe the isotropic component has a physical meaning and thus interpret for the even weaker DLF events the deviatoric moment tensor only.
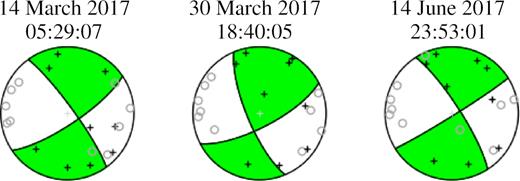
Moment tensor solutions of tectonic earthquakes (ML> 2.3) on the Ochtendung Fault Zone from 2017 (see red circles in Fig. 1). Best double-couple lower hemispheric projections (Lambert equal area) are plotted together with polarities of P-wave first motions (black crosses positive, white circles negative). Ray piercing points have been calculated using a ray tracer and the CRUST 2.0 model of the Eifel region (Bassin et al.2000).
Summary of moment tensor results of all DLF earthquake clusters (C1, C2, M1, M2) and events on the Ochtendung Fault Zone (OFZ). Origin time, latitude, longitude (both in decimal degree) and depth z (in km) are from hypocentre coordinates. Seismic moment M0 is given in 1010 Nm. The moment tensor components (northeast-down system) are normalized by the seismic moment. The mean and standard deviation of parameters are associated to the dominant cluster of the ensemble.
| Date | lat | lon | z | M0 | Mnn | Mee | Mdd | Mne | Mnd | Med |
|---|---|---|---|---|---|---|---|---|---|---|
| OFZ: March 2017, June 2017 (0.7–2.0 Hz) | ||||||||||
| 03-14 05:29:07 | 50.310 | 7.430 | 10 | 1162 | 0.84 ± 0.09 | −0.88 ± 0.09 | −0.32 ± 0.16 | 0.32 ± 0.04 | 0.05 ± 0.14 | 0.18 ± 0.17 |
| 03-30 18:40:05 | 50.373 | 7.370 | 9 | 396 | 0.67 ± 0.10 | −0.65 ± 0.11 | 0.23 ± 0.25 | 0.54 ± 0.08 | 0.33 ± 0.16 | 0.13 ± 0.21 |
| 06-14 23:53:01 | 50.390 | 7.340 | 9 | 1054 | 0.78 ± 0.14 | −0.87 ± 0.12 | 0.01 ± 0.20 | 0.39 ± 0.06 | −0.09 ± 0.24 | 0.18 ± 0.15 |
| C1: April 2015, October 2018 (0.7–3.0 Hz) | ||||||||||
| 04-14 21:23:44 | 50.400 | 7.280 | 11 | 139 | 0.17 ± 0.09 | −0.11 ± 0.11 | −0.06 ± 0.11 | −0.62 ± 0.09 | −0.58 ± 0.14 | −0.40 ± 0.21 |
| C2: June 2017, April 2018 (1.0–3.0 Hz) | ||||||||||
| 06-04 20:36:33 | 50.380 | 7.290 | 24 | 28 | 0.47 ± 0.14 | 0.17 ± 0.10 | −0.64 ± 0.09 | 0.37 ± 0.11 | −0.67 ± 0.11 | 0.17 ± 0.12 |
| 06-07 10:49:11 | 50.390 | 7.300 | 26 | 31 | −0.14 ± 0.11 | 0.85 ± 0.09 | −0.71 ± 0.09 | −0.21 ± 0.21 | 0.46 ± 0.17 | 0.04 ± 0.18 |
| 06-07 11:02:30 | 50.380 | 7.300 | 26 | 30 | 0.91 ± 0.09 | −0.18 ± 0.12 | −0.73 ± 0.09 | 0.28 ± 0.15 | −0.00 ± 0.20 | −0.37 ± 0.12 |
| 06-07 11:08:34 | 50.390 | 7.300 | 24 | 62 | 0.62 ± 0.16 | −0.03 ± 0.20 | −0.59 ± 0.16 | −0.07 ± 0.30 | 0.27 ± 0.18 | −0.58 ± 0.24 |
| 06-07 11:15:08 | 50.380 | 7.300 | 25 | 34 | −0.01 ± 0.11 | 0.83 ± 0.09 | −0.82 ± 0.08 | 0.15 ± 0.28 | 0.38 ± 0.15 | 0.07 ± 0.17 |
| 06-07 11:35:48 | 50.380 | 7.290 | 26 | 32 | −0.14 ± 0.12 | 0.91 ± 0.12 | −0.76 ± 0.07 | −0.34 ± 0.13 | 0.26 ± 0.22 | −0.04 ± 0.13 |
| 04-28 02:43:47 | 50.387 | 7.287 | 22 | 79 | −0.10 ± 0.16 | 0.66 ± 0.15 | −0.56 ± 0.15 | −0.15 ± 0.20 | 0.70 ± 0.11 | −0.03 ± 0.13 |
| M1: October 2017, May and June 2018 (1.0–3.0 Hz) | ||||||||||
| 10-25 00:02:14 | 50.370 | 7.320 | 34 | 40 | 0.74 ± 0.19 | −0.04 ± 0.22 | −0.69 ± 0.13 | −0.45 ± 0.16 | −0.38 ± 0.15 | 0.13 ± 0.18 |
| M2: September 2013 (3–10 Hz, only amplitude ratio, no uncertainties) | ||||||||||
| 09-18 21:40:51 | 50.345 | 7.339 | 43 | 3 | -0.34 | 0.68 | −0.35 | −0.65 | −0.44 | −0.17 |
The DLF earthquakes were deeper and had smaller magnitudes than the OFZ tectonic events, and moment tensor results are not as stable. The Bayesian inversion tested 21 000 trial solutions, and the ensemble of the best 1100 solutions is used for interpretation. For the OFZ events, the best ensemble was consistent, and a simple statistical analysis leads to meaningful mean values and standard deviations of source parameters. For DLF events, however, the SNR is poor and waveforms are more complex. Therefore, the best ensemble shows higher variability and groups of different mechanisms. A simple mean or median does not always represent the families of best performing solutions. We therefore declustered the ensemble of best solutions using the method of Cesca et al. (2013) (Kagan angle norm), and performed the statistical analysis for each individual cluster. The frequency range of the DLF event inversions was slightly adapted between the different cluster depths, depending on the SNR and the typical frequency range of the signals. For instance, cluster C1 consists of events with ML up to 1.8 that excited relatively strong low frequency signals. Therefore, a frequency range between 0.7 and 3 Hz was used. The fit of DLF waveforms and amplitude spectra is poor compared to the tectonic earthquakes on the OFZ. This is on one side because of the smaller magnitudes and smaller SNR of DLF events, but also because of the low-frequency ringing in DLF waveforms, which is not represented in the synthetic Green’s functions. The low-frequency ringing also explains that the estimated MW is much larger than the ML values—a trend in MW–ML scaling we generally observe for the DLF events. Further, the centroid depths of DLF earthquake moment tensors have larger uncertainties and are not as well constrained compared to the tectonic events, as their centroid moment tensor inversion is mainly based on amplitude information.
After visual inspection of the waveform fits, and by evaluation of the stability of the inversion, we present the nine best of 22 analysed moment tensor solutions of DLF events in Fig. 7 and Table 2. A more complete summary of solution plots to evaluate trade-offs and uncertainties of individual parameters is provided in the electronic supplement. The moment tensor inversion is developed for earthquake ruptures with short, step-like slip functions, and does not consider multiple and resonating sources. Therefore, results indicate the overall average radiation pattern of an equivalent centroid source. The 2013 cluster (M2) consisted of only two events with ML 0.9 and ML 0.7. Additionally, the installation of the dense seismic networks was not fully completed by that time. Therefore, the 2013 DLF events were very difficult to analyse. The presented M2 solution is retrieved from P/S amplitude ratios only and a pure double-couple (DC) constraint. Thus, the 2013 solution has an ambiguity in the polarity of the solution. We plot the normal faulting solution for the M2-cluster in Fig. 7, consistent with the solutions of all other DLF clusters. For clusters C1, C2 and M1, a deviatoric moment tensor inversion has been applied.
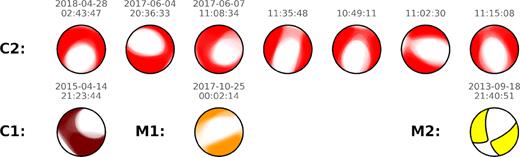
Moment tensor solutions of DLF earthquakes from Table 2. The fuzzy moment tensor plots show the P-wave radiation patterns (lower hemispheric projections), where intensities of colours give the normalized amplitude radiation from the ensemble solutions of the first dominant cluster. For the M2 cluster (2013), the best-fitting solution based on amplitude ratios is shown. Colours represent different cluster depths as defined in Fig. 1. Events can be identified by day of occurrence and hours (Table 2).
All the analysed earthquakes have a large DC component (Fig. 8a). Interestingly, the DLF cluster C1 with the strongest ringing phase and the lowest corner frequency fc has the smallest DC component. In contrast to the tectonic events on the OFZ, all DLF earthquakes show dominant normal faulting components. Fig. 7 shows some variability in the strike direction of T-axes, but provides a consistent figure in general—that is large shear crack components for deep events and a clear trend to normal faulting earthquakes with a large plunge angle of the P-axes, orientated between 35° and 70° (Fig. 8b) and gradually decreasing from depth to the surface. In contrast, the P-axes of the OFZ strike-slip events are shallow plunging between 5° and 15°. As the growth direction of hydraulic fractures is controlled by the orientation of the maximal compressive stress (similar to the P-axis), a large plunge angle of the P-axis would support the vertical migration of fluids or magma by tensile fracturing and dyking.
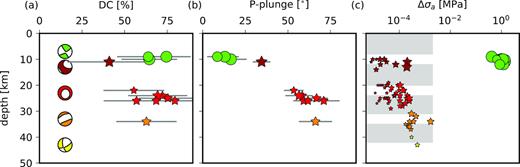
Source parameters from moment tensor analysis. (a) Double-couple components (DC) are plotted together with the P-wave radiation pattern of the representative deviatoric moment tensors (see Fig. 1 for colour scale). For C2 the average moment tensor is plotted. (b) P-axes plunge angle for the different clusters as a function of depth. (c) Apparent stress drop as a function of depth. The stress drop is estimated from the kinematic, self-similar, circular rupture model of Sato & Hirasawa (1973) and our measured corner frequency fc from |$\displaystyle { \Delta \sigma _a = ({7 \pi }\mathbin {/}{16})\cdot ({1}\mathbin {/}{0.8 v_s})^{3} M_0 f_c^{3} }$|, where a shear wave velocity of |$v_s \approx 3500 \, \mathrm{m\, s}^{-1}$| has been assumed. The grey bars show depth ranges of magma storages as postulated by Schmincke (2007).
4 DISCUSSION
The DLF earthquakes beneath the LSV are characterised by low corner frequencies, long and partly monochromatic coda waves and small magnitudes below ML2. They occur in episodic, short pulses at specific depth intervals. In addition, they are unusually deep and only found in a narrow, nearly vertical channel between about 10 and 40 km depth, dipping approximately 80° to southeast.
DLF earthquakes with such characteristics have been found beneath several explosive and caldera forming volcanoes worldwide. For instance, Soosalu et al. (2009) observed hundreds of small earthquakes (ML< 1.5) beneath the Askja volcano in the Northern Volcanic Zone of Iceland in summer 2006 and 2007. These events occurred mostly in persistent swarms at 14–26 km depth within the otherwise aseismic lower crust, and were characterized by unusually low frequencies below 5 Hz. They were interpreted to be caused by melt moving from a deep magma reservoir upwards through the crust.
Shapiro et al. (2017) analysed data from a local network monitoring the Kluchevskoy volcano group in Kamchatka and found weak DLF earthquakes at 30 km depth above an assumed crustal magma reservoir. The DLF events occurred in sequences of a few hours to days length and the activity increased months before a major eruption at one of the volcanoes. Before the eruption, activity of shallow low-frequency earthquakes also increased and the observed upward migration of low-frequency events was suggested to reflect deep volcanic fluid transport and the pre-eruptive transfer of fluid pressure from deep-seated parts of the magmatic system to shallow reservoirs. At Kluchevskoy, the DLF activity is used as evidence of the activation of the deep magmatic system beneath the volcano group.
Understanding the source mechanism of DLF earthquakes is important to estimate parameters of the magma/fluid reservoirs and eventually to assess the eruption hazard. We found strong DC components and additionally a compensated linear vector dipole (CLVD) component for most DLF events. The near-vertical P-axes reveal an upwards orientated force, suggestively induced by ascending magma or magmatic fluids. Stalling of the ascent might be enforced by the decreasing density contrast between magma and the surrounding rock when approaching shallower depths, and further supported by horizontally orientated tectonic stresses in the upper crust, evidenced by strike-slip mechanisms of earthquakes on the OFZ. Similar DC and CLVD components of DLF earthquakes have been found by Nakamichi et al. (2003) at Iwate volcano, northeastern Japan. There, the events occurred in clusters beneath 31 and 37 km depth and—same as at the LSV—were located in a vertical, pipe-like channel. Moment tensors were estimated from fitting of spectral ratios of body waves, DC components were dominating but CLVD and isotropic components were found as well. Nakamichi et al. (2003) suggested that the DLF events were associated with a multiple source process close to magma bodies, involving the opening of tensile cracks coupled with shear cracks, which are connected to a magma reservoir. To explain the shape of the moment tensors with relatively small isotropic components, the magmatic reservoir at Iwate volcano was suggested to have an oblate spheroidal shape.
The interaction of a shear crack and a neighboring magma body has also been suggested in the context of dyke-induced volcano-tectonic earthquakes beneath the Eyjafjallajökull volcano, Iceland, to explain large volumetric expansion components (Dahm & Brandsdóttir 1997). Woods et al. (2018) find direct evidence for low-frequency earthquakes related to magma movement. During the Bárðarbunga (Iceland) 2014 rifting episode, highly repetitive, swarm-like clusters of low-frequency earthquakes were detected during the stalling of the lateral dyke, at positions where ice cauldrons formed in the glacier above the dyke, indicating the localised upwards migration of magma. The low-frequency events were located between the underlying dyke and the surface. Woods et al. (2018) argue that low-frequency events comprise a brittle trigger, a shear crack and the resonance of a fluid-filled cavity, resulting in clear P and Swaves followed by a long duration, low-frequency coda. Such resonance models have been discussed since long time (Chouet & Matoza 2013), whereas the trigger mechanism and the geometry of the fluid-filled body is debated. For instance, Kumagai & Chouet (2001) explain low-frequency events at 1 Hz by the flexural mode standing waves of a rectangular shaped crack filled with gas-rich basaltic magma, which is triggered by a sudden shear crack in the brittle rock close to the fluid-filled crack. Neuberg et al. (2006) studied repeating, shallow earthquakes in the upper feeder conduit beneath Montserrat volcano. The trigger mechanism is assumed by the rupture of moving magma within the conduit in the glass transition zone. However, the parameter range where this can happen is much shallower, and the trigger model therefore cannot be applied to DLF earthquakes beneath the LSV.
Dahm (2001) developed an alternative mechanical model from the study of acoustic emissions during hydrofracture experiments in salt rock. The water injection induced events were monitored in the near field. Moment tensors of events showed dominant double-couple mechanisms. In comparison to events located far from the hydrofracture, the events close-by had P and S waves with sharp impulsive onsets followed by low frequency pulses and coda. Similarly, Benson et al. (2008), Tary et al. (2014) and Derode et al. (2015) report on low-frequency and tremor-like signals generated during hydrofracture experiments in-situ or in laboratory experiments in basalt. Dahm (2001) could estimate the rupture front direction of two events indicating fast rupture propagation parallel to the tip of the hydrofracture. The apparent irregular dispersion of the body wave pulses was explained by a systematic slowing down of the rupture towards the tip or face of the hydrofracture. A possible scenario to generate DLF events can be similar: A shear crack is induced in a brittle rock volume, close to a fluid intrusion or a volumetric reservoir. The rupture initiation generates high frequency P and S onsets as expected for earthquakes. However, the rupture front approaching the ductile and high temperature region near the magma-filled crack surface is significantly slowed down, but still shows large slip. This could explain the retarded low-frequency signals and the small apparent stress drop of our DLF events in the range of 100 Pa only (Fig. 8c). The possible coda energy with dominant frequencies may be generated by a resonance of the crack or fluid-filling, if the fluid was supersaturated and contained exsolved volatiles, leading to a sufficiently high impedance contrast.
A different explanation for DLF events beneath Askja volcano (Iceland) was given by Soosalu et al. (2009), postulating that the low frequencies are related to strong attenuation in the lower, ductile crust, so that high frequencies are damped out if the events were deep. However, such a structural model cannot explain the low-frequency character of shallow earthquakes above the Bárðarbunga lateral dyke, while deeper earthquakes contain high frequencies. Also our findings do not support the structural attenuation model to explain DLF earthquakes beneath the LSV. In Fig. 5(c) the corner frequencies fc of DLF events are plotted versus depth. A consistent increase of fc from about 2 Hz in 10 km to about 8 Hz in 40 km depth is observed, which cannot be explained by highly attenuating lower crust, since rays from deeper events would be affected by larger damping leading to lower instead of higher fc.
Summarising our findings, we tend to favour the hypothesis of a shear crack–reservoir interaction to explain the features of DLF activity beneath the LSV, with a possibly slow or slowed down shear crack rupture velocity. The shear cracks are induced by stresses in the vicinity of a magma volume, for instance sitting or moving in a pre-existing channel of the plumbing system. The slow rupture velocity would explain the radiated low-frequency waves and the small apparent stress drop of DLF events. In addition, if the magma body contained exsolved volatiles or supersaturated fluids, the impedance contrast would be sufficiently high to generate low frequency coda waves by resonance. Shear stresses induced by a propagating magma batch are spatially and temporally very localised. Therefore, DLF events cannot grow to large earthquakes in the lower crust. Repeated propagation of magma batches (e.g. Dahm 2000) may explain the episodic occurrence of pulses of low magnitude DLF events in the same depth ranges. Brittle behavior of the viscoelastic lower crust and upper mantle requires efficiently fast strain accumulation, for example due to moving magma, only lasting for the time the volume is moving. This would explain the short duration of the DLF earthquake pulses.
Activity in the four DLF earthquake clusters did not successively migrate from large to shallow depths, but jumped randomly between the clusters. Assuming that DLF events occur in the direct vicinity of a moving volume, this pattern suggests independent activity of different magma batches along the potential feeder channel, rather than a single ascent of one magma batch from the mantle to the shallow crust. However, channelised pressure interaction may be possible and has not been studied yet. It is well possible that DLF earthquake sequences did already occur before the improvement of the seismic network in recent years, but could not be detected. The observation period so far is too short to reliably discuss interactions between different clusters, or to estimate potential migration velocities of moving magmatic fluids.
In this context, the subsequent occurrence of the Glees clusters (Fig. 1, blue dots) receives attention, a swarm-like sequence of shallow tectonic events west and northwest of the LSV caldera and outside the OFZ, with magnitudes ML< 1 and with a jump of activity by about 5 km from south to north (Fig. 1), lasting about 4 months in 2017 (Fig. 3). The clusters are roughly located at the upward extension of the postulated feeder channel. Therefore, the question arises whether the Glees clusters represent sill-like intrusions of magma from the borders of a shallow crustal reservoir, or whether they may be related to increased CO2 pore pressure. Martens & White (2013) suggest the release of CO2 from a magma intrusion in the mid-crust at Mount Upptyppingar (Iceland) to have triggered a comparable sequence of shallow microearthquakes in 2007–2008. At Itawa volcano (Japan), DLF events were subsequently followed by high frequency earthquake swarms during 1998–1999, accompanied by surface deformation (Nakamichi et al.2003). However, at the LSV the lack of geodetic data as well as the lack of continuous gas measurements so far prevents us from determining if and how the Glees clusters were directly linked to the large sequence of DLF pulses in the C2 cluster in June 2017. Though it remains remarkable, that the Glees clusters and one ML 2.7 earthquake on the OFZ directly followed the most prominent DLF sequence observed so far.
If the proposed model for DLF earthquakes in the EEVF proved to be true, it would have wide implications for the interpretation of magmatic processes beneath the LSV. The conduit-like geometry of the ensemble of DLF events could indicate the feeder channel for ongoing magma supply from the mantle and the recharge of crustal reservoirs beneath the LSV. The depth and location of DLF earthquake clusters might indicate where magma batches are located or where intermediate storage levels exist. Since the DLF events are observed over a wide depth range, our findings support a model of multiple stages of magma accumulation and differentiation beneath the LSV.
This model is further affirmed by petrological studies: Lavas, tephras and xenolithes in the East and West Eifel volcanic fields have been systematically studied by composition and dating to recover the depth of magmatic reservoirs as well as their longevity. For instance, the shallow reservoir feeding the LSV eruption 12.9 kyr ago is estimated in a depth between 5 and 8 km (Schmincke 2007). U-Th dating of intrusive carbonates indicates that the magmas started to differentiate at shallow levels for 30 kyr with an accumulation of minerals 17 kyr before the eruption (Schmitt et al.2010). The shallow magma chamber was inflated about 4 kyr before the eruption, possibly related to a redistribution of differentiated magma in the chamber.
The depth range of DLF earthquakes found in our study correlates with postulated depths of magma storages (Fig. 8c), which were inferred indirectly from different types of xenoliths, thermobarometry of phenocrysts, microthermometry of fluid inclusions in minerals and other criteria (see pp. 285–286 and fig. 3 in Schmincke 2007). The detection and location of DLF earthquakes provides for the first time seismic indications that magmatic recharge in crustal reservoirs is indeed ongoing beneath the LSV, with good constraints on the depth and position of the feeder channel and likely storage levels. Such a hypothesis of ongoing upward migration of magma or magmatic fluids and the existence of isolated, crustal reservoirs is also supported by multi-isotope gas analysis (e.g. Bräuer et al.2013).
The potential existence of magma reservoirs at different depth levels and thus different stages of evolvement finally leads to the question of the volcanic hazard at the LSV. DLF earthquakes could technically not be detected in the region until a few years ago. Without having established a reference level of activity, their occurrence during the past five years cannot yet be interpreted as an increase of seismic and volcanic activity. Volcanic eruptions can be triggered by magma mixing due to the inflow of new magma into a differentiated reservoir (Sparks et al.1977; Murphy et al.1998). However, they are in most cases preceded by volcano-tectonic earthquake swarms, often several weeks or months before the eruption onset (e.g. Zobin 2018), or even years in case of the 2010 Eyjafjallajökull eruption in Iceland (Sigmundsson et al.2010). Such swarms have so far never been detected at the LSV. Although volcano-tectonic earthquakes mostly have low magnitudes, the enhanced seismic network in the region nowadays enables their detection, but requires further improvements and continuous maintenance in the future.
Ultimately, the present volcanic hazard posed by the LSV cannot be assessed solely based on the findings of our study. But bearing in mind that the LSV already experienced an explosive eruption 12.9 kyr ago, a deeper analysis of the magmatic/volcanic activity in the region and the resulting hazard is recommended. Despite of the close seismic monitoring, high resolution seismic and geophysical experiments are required to image potential shallow and deep crustal magma reservoirs. For example, large S-wave residuals on single stations close to the LSV (e.g. station DEP02 for the Glees 2 cluster) might reflect low velocity zones, possibly linked to shallow crustal fluid batches, which can only be resolved by a shallow seismic tomography. Further, geodetic measurements would help to constrain potential shallow volume changes, either during DLF sequences or during episodes like the Glees clusters. Continuous geochemical measurements would be another valuable enhancement to better understand CO2 emissions and potential changes in gas flux during episodes of seismic unrest.
5 CONCLUSIONS
By joining the seismological data of the permanent network with a temporal deployment of seismic stations, DLF earthquakes have been observed for the first time beneath the Laacher See Volcano (LSV). The events were initially detected in 2013 with tiny mantle earthquakes at approximately 40 km depth. Since then, the careful analysis revealed several episodes of DLF earthquake activity in four distinct clusters at depths between about 10 and 40 km. The DLF earthquakes clearly differ from tectonic microearthquakes commonly observed along the Ochtendung Fault Zone in the Neuwied Basin, which is only a few kilometres apart from the LSV. They show unusual low corner frequencies, suggesting a very low apparent stress drop during rupture, and long lasting low-frequency coda waves after the arrival of P and Sphases. DLF events occurred episodically in short pulses, mainly lasting for only a few minutes. They are located in persistent spots at different depth levels and overall indicate a possible feeder channel beneath the LSV from the upper mantle to the shallow crust at about 10 km depth.
We studied the location and source mechanism of DLF events and performed a Bayesian moment tensor inversion. Dominant shear crack mechanisms are indicated, with a normal faulting orientation suggesting a stress field orientation that would enable magma and fluids to migrate upwards. The favoured mechanical model to explain DLF earthquakes beneath the LSV involves shear cracks occurring close to conduits, batches or reservoirs of magma or magmatic fluids. Low-frequent P- and S-wave codas are suggestively generated by slow rupture velocities in the viscoelastic upper mantle and lower crust, as well as by resonance of adjacent fluids.
The study provides first seismological evidence of actual magmatic recharge of crustal reservoirs beneath the LSV. Positions and depth levels of possible storage systems are indicated by the location of DLF earthquakes. It is likely that DLF earthquakes already occurred before the improvements of the seismic networks, but remained undetected in the past. However, since 2013 the activity is continuing and indicating ongoing magmatic activity in the lower curst and upper mantle. Having in mind the strength and explosiveness of the past eruption of the LSV 12.9 kyr ago, an improved multidisciplinary and continuous volcano monitoring is recommended. The conduction of further specific geophysical and geochemical measurements is required to image the size, evolution and present state of potential magma reservoirs beneath the LSV and to further assess its volcanic hazard.
SUPPORTING INFORMATION
Supplementary data are available at the GFZ German Research Center for Geosciences online (Heimann et al. 2019).
Please note: Oxford University Press is not responsible for the content or functionality of any supporting materials supplied by the authors. Any queries should be directed to the corresponding author for the article.
ACKNOWLEDGEMENTS
We gladly acknowledge the state of Rhineland-Palatinate for funding the densification of the local seismic network in the Eifel region in recent years. Additional seismic data was provided by the State Seismological Service of Hesse (HLNUG, Wiesbaden), the GEOFON network of GFZ Potsdam and the German regional seismic network (GRSN) of BGR, Hannover. The Earthquake Observatory Bensberg (University of Cologne) contributed with data of the 2013 DLF earthquakes. Temporary seismic stations were provided by the Geophysical Instrument Pool Potsdam (GIPP, GFZ Potsdam) from July 2014 to July 2016 and the KArlsruhe BroadBand Array (KABBA) since July 2014. Werner Scherer and Mohsen Koushesh assisted the fieldwork. Dieter Kurrle (now at Lennartz Electronic GmbH, Tübingen), Andrea Brüstle, Jens Zeiß and Fee-Alexandra Rodler helped with detection and location of DLF earthquakes. Most figures were plotted using the Generic Mapping Tools (GMT, Wessel et al.2013). We thank the editor G. Laske and two reviewers, J. Neuberg and P. Einarsson, for their supporting comments and suggestions to further improve the readability of the manuscript.
REFERENCES
Author notes
Seismological Survey of Southwest Germany (Erdbebendienst Südwest), joint seismological services of Baden-Württemberg and Rhineland-Palatinate.
